BTC USD Long updateBe patient.
This trade might take one month to complete.
Be patient and wait and wait and wait.
BTCUSD.P trade ideas

August 2025 Monthly ScenariosChartingMyLosses | Monthly Analysis | 1M TF
Speculative structure meets macro zones
🔵 Scenario 1: Direct continuation to the highs (Blue Path)
Price holds above PH June and pushes toward the 0.78 retracement of July, targeting 121,399 USD. This would be a classic bullish continuation fueled by residual momentum and liquidity above recent highs.
🟢 Scenario 2: Support retest before continuation (Green Path)
A sweep of the 109,893–103,009 USD zone (June’s fib cluster and previous breakout range) leads to a rebound. This would validate the zone as a new macro support and could signal institutional reaccumulation before an end-of-month push to the highs.
🔴 Scenario 3: Deep retracement into OB + FVG (Red Path)
Bears attack, dragging price down to the 98,459–96,000 USD range, tapping into a Daily Order Block + FVG inefficiency. A full liquidity sweep in this zone could set up a powerful reversal toward the new max, but would require market-wide risk-on behavior to confirm.
🧠 Speculative Note
In just one month, BTC can traverse thousands of dollars. The real question isn’t "will it drop or pump?" but rather "where is price most efficient to move next?". Keep an eye on volume, reactions at fib levels, and especially how the market behaves near the prior June low (PL).

#Bitcoin Sunday Update $BTC bounced from the $112,398 support #Bitcoin Sunday Update
CRYPTOCAP:BTC bounced from the $112,398 support and is now trading above $113,700. If it holds above this level, a push toward $120K is likely. However, if downside continues, next key support sits near $110K — both supports could trigger a rebound toward $120K. Stay alert for range play before breakout.

Bitcoin Price Analysis and Market Outlook (Next: $118,100)Bitcoin Price Analysis and Market Outlook (Next: $118,100)

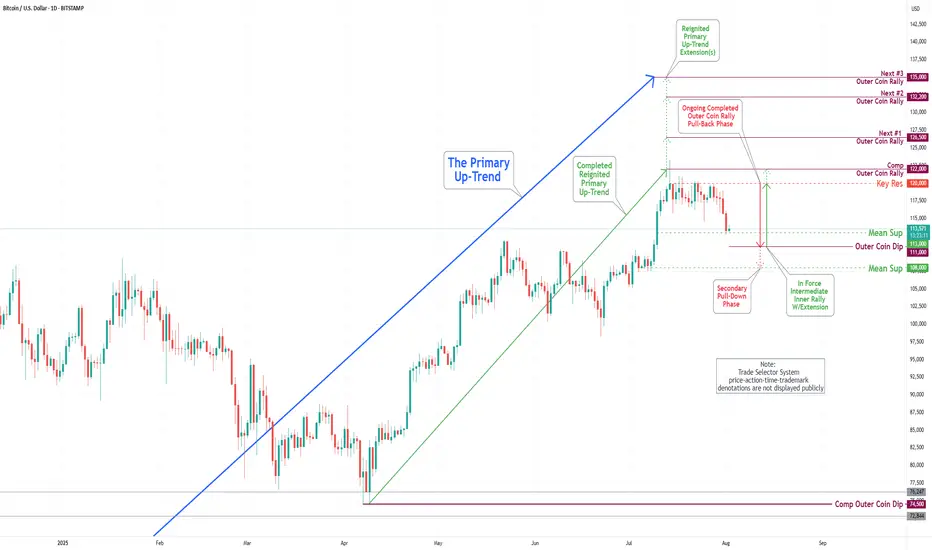
Bitcoin(BTC/USD) Daily Chart Analysis For Week of August 1, 2025Technical Analysis and Outlook:
In this week's trading session, the Bitcoin market experienced a notable pullback. The primary reason for this movement was the Key Resistance level, which led to a decline that reached our Mean Support level of 113000. This anticipated pullback is prompting the completion of the Outer Coin Dip target of 111000, with a strong likelihood of moving towards the Mean Support level of 108000.
Bitcoin – Time to Book Profits?📉 Bitcoin – Time to Book Profits? 📈
Bitcoin (BTCUSD) has had a phenomenal run! On Nov 22, 2022, it bottomed out at around $15,500 — and then, on July 14, 2025, it smashed records by hitting an all-time high of $123,000! 💥
That’s a jaw-dropping gain of approximately 693% in just under 3 years! 🤑📊
🚨 But all that glitters isn't gold...
📉 Technical outlook based on Elliott Wave Theory suggests we might be in either:
An extended Wave 4 correction, or
A fizzling Wave 5 move that’s losing steam.
🔍 Adding to this concern:
Volume is below average – a classic warning sign 🚨
Price action shows weakening momentum
No strong buying confirmation near the highs
👉 The pattern now resembles a potential distribution phase, not a fresh breakout. That means: The smart money might already be booking profits.
💡 What should investors do?
If you’ve ridden the wave up — consider taking some money off the table. This could be a good time to lock in gains and wait for a better re-entry opportunity. Remember, discipline beats excitement in trading.
📛 Caution is advised — especially for late entrants who might get caught in a correction or a prolonged sideways phase.

Correction coming in....This channel is not providing individualized trading or investment advice, nor is it a banking service, brokerage service, trading service, investment service or money management service

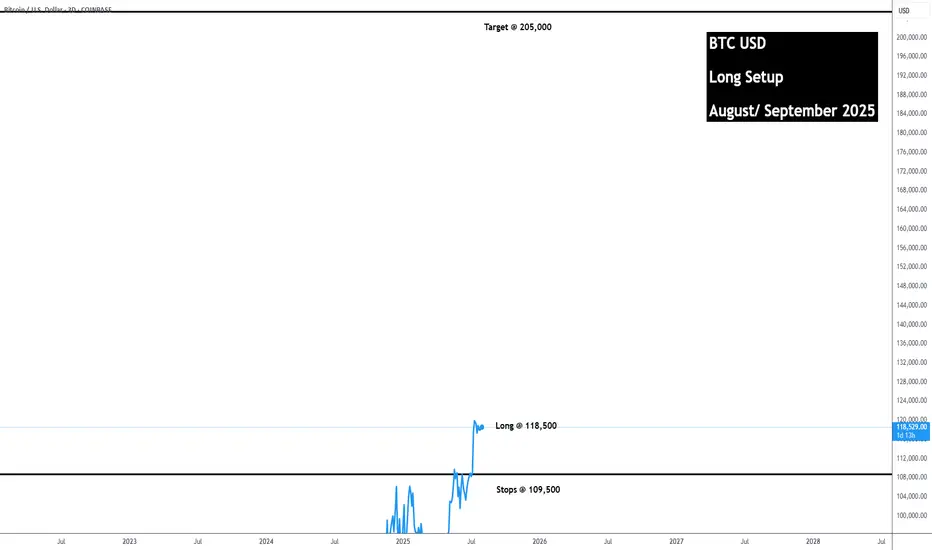
BTC USD Long 205,000 TargetI think it will reach the 200,000 range during August/ September 2025.
Update when needed.
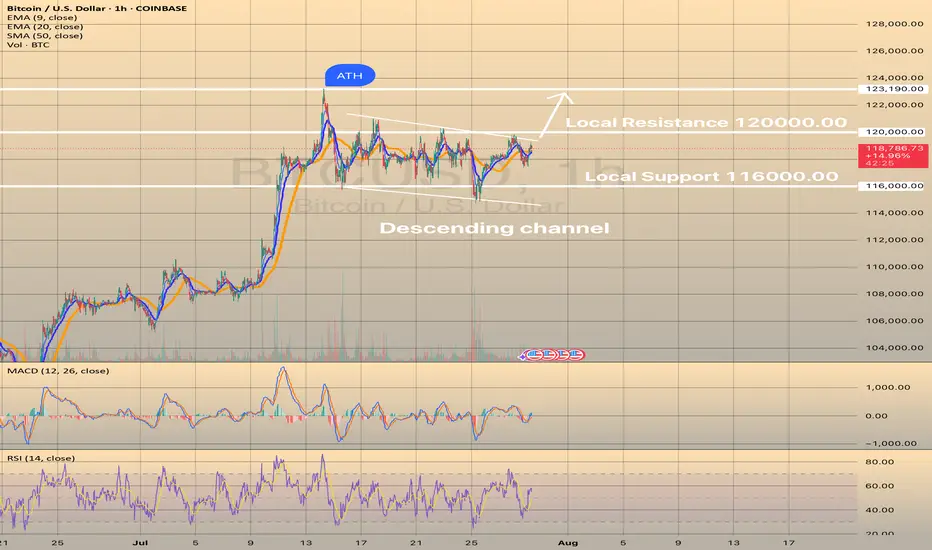
BTCUSD CONSOLIDATES BELOW RESISTANCE OF 120,000.00BTCUSD CONSOLIDATES BELOW RESISTANCE OF 120,000.00
Today the price rebounded from the SMA50 on 4-h chart and continues to consolidate below the resistance level of 120,000.00. Yesterday there was a minor pullback from this level, still the price is pretty much at the same levels as yesterday. The recommendation is still the same: would be safer for long trade to wait for a breakout of the resistance (120,000.00) with first target of 123,190.30 (ATH). However, the asset shows nice bullish set up: RSI started to show some strength with price consolidation below resistance.
double long ON BITCOIN hey .
as you saw in the previous trade and forcast we are long on the bitcoin
we got another beautiful confirmation
so i m puting a second long and already put the first on the break even :)
Bullish continuation?The Bitcoin (BTC/USD) has bounced off the pivot and could rise to the 1st resistance.
Pivot: 116,724.27
1st Support: 111,336.90
1st Resistance: 123,341.37
Risk Warning:
Trading Forex and CFDs carries a high level of risk to your capital and you should only trade with money you can afford to lose. Trading Forex and CFDs may not be suitable for all investors, so please ensure that you fully understand the risks involved and seek independent advice if necessary.
Disclaimer:
The above opinions given constitute general market commentary, and do not constitute the opinion or advice of IC Markets or any form of personal or investment advice.
Any opinions, news, research, analyses, prices, other information, or links to third-party sites contained on this website are provided on an "as-is" basis, are intended only to be informative, is not an advice nor a recommendation, nor research, or a record of our trading prices, or an offer of, or solicitation for a transaction in any financial instrument and thus should not be treated as such. The information provided does not involve any specific investment objectives, financial situation and needs of any specific person who may receive it. Please be aware, that past performance is not a reliable indicator of future performance and/or results. Past Performance or Forward-looking scenarios based upon the reasonable beliefs of the third-party provider are not a guarantee of future performance. Actual results may differ materially from those anticipated in forward-looking or past performance statements. IC Markets makes no representation or warranty and assumes no liability as to the accuracy or completeness of the information provided, nor any loss arising from any investment based on a recommendation, forecast or any information supplied by any third-party.

Beyond ICT & SMC: The Mathematical Revolution in Zone TradingIn the world of trading, there's a fundamental divide between traders who rely on subjective interpretation and those who trust mathematical precision. While concepts like ICT (Inner Circle Trader), SMC (Smart Money Concepts), and naked chart analysis have gained popularity, they all share one critical flaw: they're based entirely on personal interpretation.
The Subjectivity Problem
Ask ten ICT traders to mark their Order Blocks, Fair Value Gaps, or Breaker Blocks on the same chart, and you'll get ten different answers. Why? Because these concepts rely on:
Personal bias in identifying "significant" levels
Subjective interpretation of market structure
Discretionary decision-making on what constitutes a valid setup
Emotional influence on analysis
The same issue plagues SMC, CRT (Candle Range Theory), time-based analysis, and naked chart trading. One trader's "liquidity grab" is another trader's "breakout." One person's "strong support" is another's "weak bounce zone."
The Mathematical Solution
This indicator eliminates this guesswork entirely. Instead of relying on subjective interpretation, it:
Calculates exact entry levels using mathematical formulas based on session params
Identifies precise support/resistance zones
Standardises signals across all timeframes, ensuring consistency whether you're on 1m or 15m charts
Removes emotional bias by using algorithmic detection of significant price levels
Numbers Don't Lie
While an ICT trader might debate whether a level is "mitigation" or "inducement," our indicator simply states: "Entry at 1.0847, Stop at 1.0832." No interpretation needed. No second-guessing. Just mathematical precision derived from actual price action.
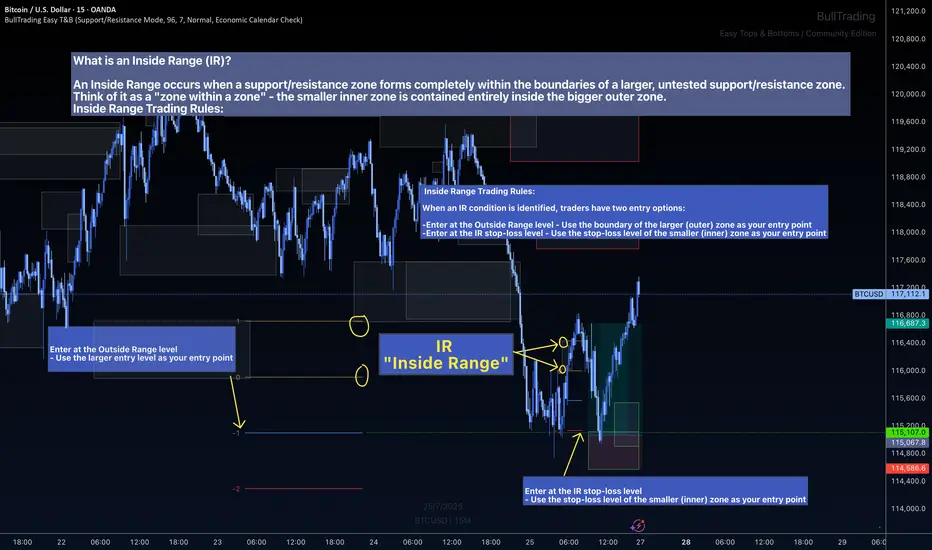
The Inside Range Advantage: When Zones Within Zones Create Superior Trading Opportunities
Most traders miss one of the most powerful setups in technical analysis: the Inside Range (IR). While ICT traders debate "nested order blocks" and SMC followers argue about "refined zones," you can easily identify Inside Ranges with this indicator and mathematically identify these high-probability setups with zero ambiguity.
What Makes Inside Ranges Special?
An Inside Range occurs when a new support/resistance zone forms completely within an untested larger zone. Think of it as the market revealing its hand twice – first showing you the broader area of interest, then pinpointing the precise level within it.
The Mathematical Edge
While discretionary traders struggle to identify these setups consistently, this indicator:
Automatically detects when a smaller zone forms within a larger untested zone
Calculates two precise entry options without any guesswork
Eliminates the confusion of nested levels that plague subjective analysis
Two Entries, Zero Confusion
Documentation and full trading system instructions can be found on the indicator's publication
When an IR forms, the indicator provides exactly two mathematically-derived entry options:
The Outside Range entry – Using the larger zone's entry level
The IR Stop-Loss entry – Converting the inner zone's stop level into an entry point
Compare this to SMC's "refined OB" or ICT's "nested FVG" concepts where traders endlessly debate which level is valid. With Inside Ranges, there's no debate – just two clear, calculated levels.
Inside Ranges represent areas where institutional interest overlaps. The larger zone shows initial interest, while the smaller zone within reveals refined positioning. By mathematically identifying these setups, you're trading where smart money has shown its hand twice.
Real Consistent Precision
Instead of squinting at charts trying to identify subjective "zones within zones," let mathematics do the heavy lifting.
In trading, consistency beats creativity. Stop drawing arbitrary lines and hoping for the best. Start trading with mathematical precision.
Documentation and full trading system instructions can be found on the indicator's publication →
Trade with confidence. Trust in mathematics. Trust in your Edge.
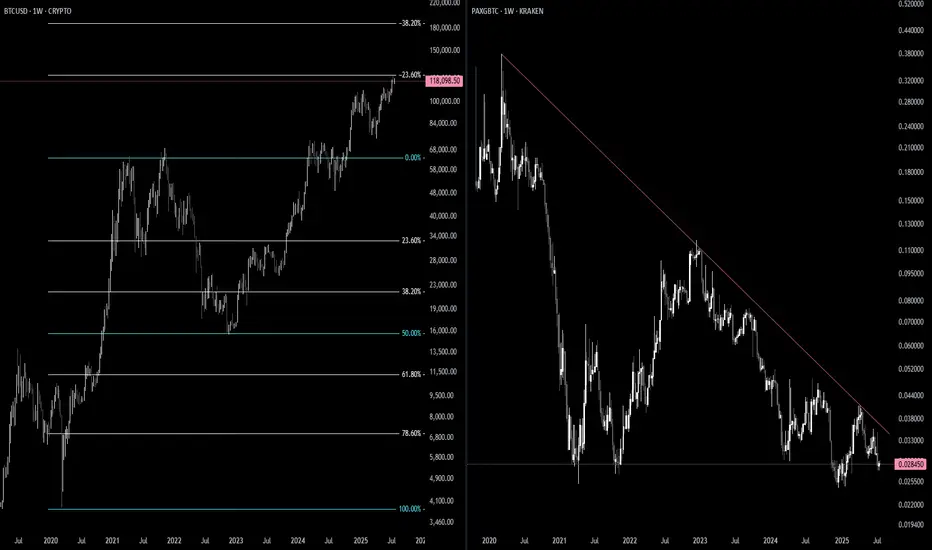
BTC / GOLD 2.0Here is another more zoomed out view of the inverse relationship of BTC to the PAXGold / BTC ratio. This is beautiful and perfect. One can see how they are practically mirrored opposite images of each other. Higher. SOON.
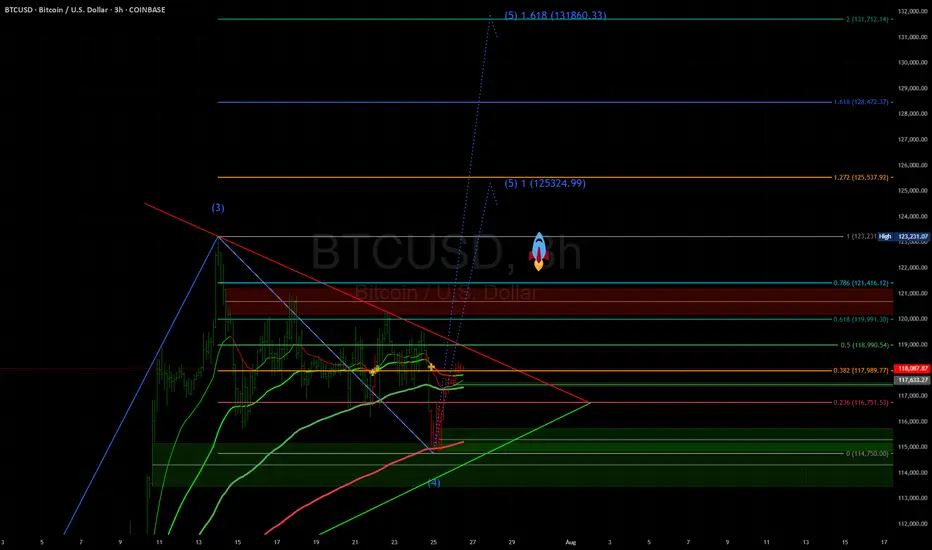
BTC 125k - $130KHello Traders,
Using Fibs and Elliot Waves I show possible BTC targets coming soon in the next leg up. Lets see how this plays out.
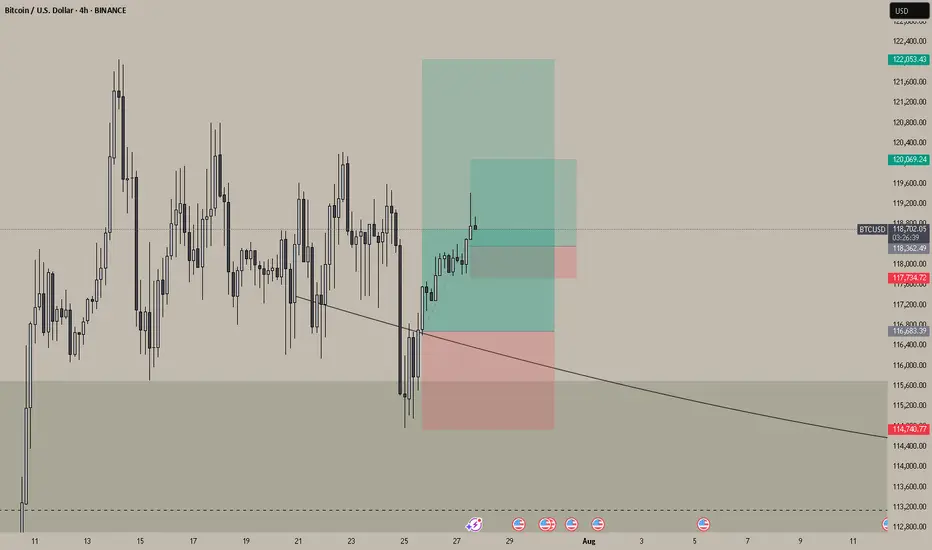
BTC USD LONG SETUPHI
IN THE LAST FORCAST WE WAS bulish on BTC
after hiting the weekly BISI and giving us a 4 h CISD
i put my entry on market at the open on the 4h CANDLE
sl swing low
target 1/2-1/3

BTC #Bitcoin (BTC/USD) on the 1-hour timeframe.The chart shows a bearish breakdown from a rounded top formation, indicating a shift from an uptrend to a downtrend in Bitcoin (BTC/USD) on the 1-hour timeframe. Price broke below a key support zone ($116,000), confirmed by a sharp red candle. The shaded area below ($112,500) suggests the next potential support or target zone. This pattern reflects weakening bullish momentum and possible further downside.

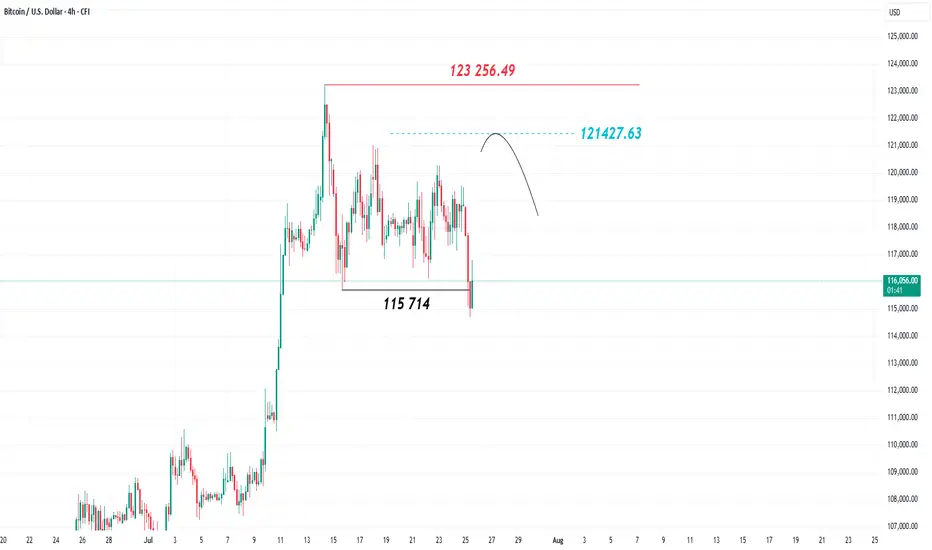
What's next for BITCOIN?After hitting a new all-time high at 123,256.49, Bitcoin, the world’s leading cryptocurrency, pulled back this week, closing on the 4-hour chart below the 115,714 level. This indicates a shift in trend from bullish to bearish and increases the likelihood of a short-to-medium-term decline.
The recent price rise appears to be corrective, and the 121,427 level is considered important and carries downside pressure, as it represents the 78% level of the Fibonacci retracement tool when measured from the recent high to the latest low. Holding below the 123,256 mark and failing to break above it would support the bearish scenario for Bitcoin.
Ethereum is Trending HigherSince April trough, Ethereum has risen by 179%, delivering a higher rate of return than Bitcoin at 66%. But most of our attention is on Bitcoin, breaking above the 120,000 level.
Why is Ethereum quietly gaining ground —and what does the future hold for Ethereum?
Mirco Bitcoin Futures and Options
Ticker: MET
Minimum fluctuation:
$0.50 per ether = $0.05 per contract
Disclaimer:
• What presented here is not a recommendation, please consult your licensed broker.
• Our mission is to create lateral thinking skills for every investor and trader, knowing when to take a calculated risk with market uncertainty and a bolder risk when opportunity arises.
CME Real-time Market Data help identify trading set-ups in real-time and express my market views. If you have futures in your trading portfolio, you can check out on CME Group data plans available that suit your trading needs tradingview.sweetlogin.com

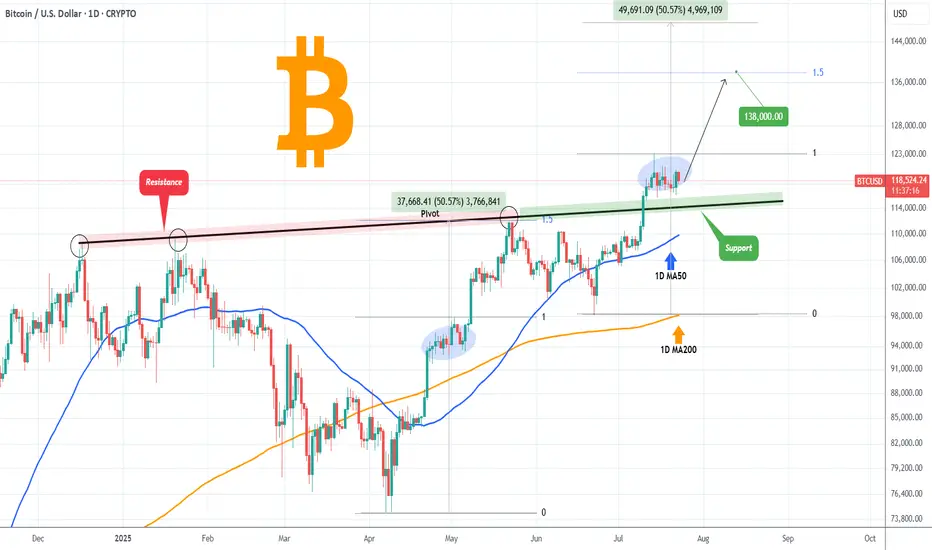
BITCOIN Former Resistance turned Support!Bitcoin (BTCUSD) is consolidating right above the December 17 2024 Pivot trend-line, a level that started off as a massive Resistance delivering two strong rejections but has now been turned into Support, holding this consolidation.
The 1D MA50 (blue trend-line) will soon cross this Pivot trend-line and will confirm it as a Support with the price technically looking for a new Bullish Leg towards the 1.5 Fibonacci extension at least ($138000), similar to the April - May uptrend, which also consisted of an Accumulation Phase much like the current.
Can the Pivot trend-line provide the necessary support for such a rebound? Feel free to let us know in the comments section below!
-------------------------------------------------------------------------------
** Please LIKE 👍, FOLLOW ✅, SHARE 🙌 and COMMENT ✍ if you enjoy this idea! Also share your ideas and charts in the comments section below! This is best way to keep it relevant, support us, keep the content here free and allow the idea to reach as many people as possible. **
-------------------------------------------------------------------------------
💸💸💸💸💸💸
👇 👇 👇 👇 👇 👇

BTCUSD--SHORT--26_07_25--breaking orange trendline
--pullback and retest trendline between levels 119597,117411
--move down towards descending channel through 111658

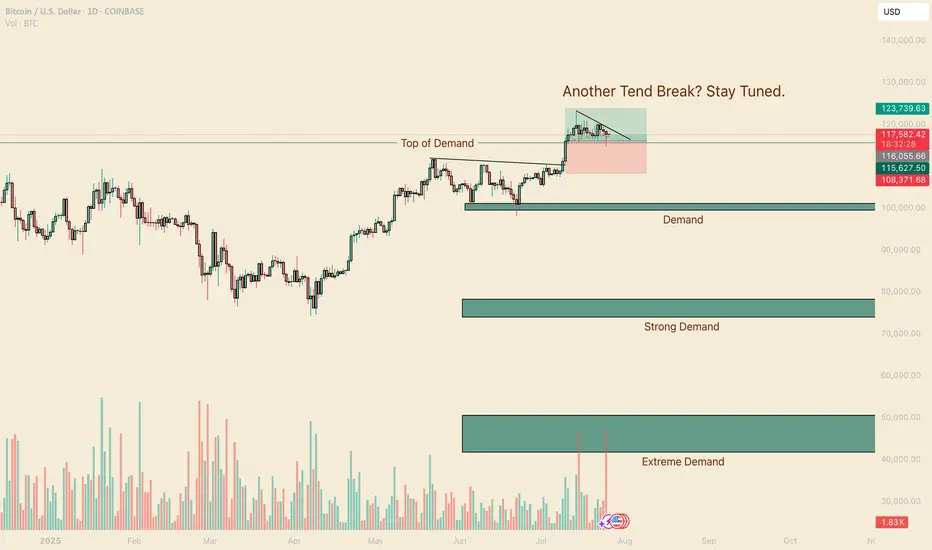
A Legends Continuation. BTCHello I am the Cafe Trader.
Today we are going to look at a trade inspired by the Legendary Trader and Scalper Al Brooks.
If you are not familiar with him I recommend having a strong foundation with price action before giving him a look.
It's no secret that BTC is at levels many thought it would never reach, and yet many others are convinced of 5 - 10x more from this run alone. It can be crushing to feel like you missed out on the move, so instead of getting FOMO, I've detailed a guide to help you in the short or the long term.
Long Term
As of right now you are looking at 4 different levels of demand. It is up to you to measure your conviction, understanding why you want to invest, and how much you are willing to risk. Recognize that Many Big hedge funds have been hesitant with accumulating hoards of Crypto do to its volatile nature, considering it too risky.
So with this in mind, I have given you 4 levels to add BTC to your long term depending on your personal conviction.
Hyper Aggressive = Top of Demand $115,500 (willing to risk 50%)
Aggressive = Demand $99,500-101,250 (willing to risk 40%)
Fair Price = Strong Demand $74,000 - 78,000 (willing to risk 25%)
Steal = Extreme Demand $42,000 - 50,800 (willing to risk 10%)
Thinking about how much you are willing to risk will help you level out your Fear of missing this move, and get pricing that meets your personal demand.
Short Term
My fellow traders, this is a nugget (inspired) from Al Brooks. The "Two Bar Trend Break" .
In a strong trend (not in a range), When you get a trend break (I like to go top of wick to top of wick for this trade), if the second bar doesn't have a huge topping tail, but closes near the top, you can enter this trade.
Here is a trade that happened this month That hasn't filled yet (it got close).
Entry At the close of the second green candle $116,000.
Measure the bottom of the First candle that broke (called the Signal candle) to the top of the second bar that broke (called the Entery Candle). If you take that measurement, and add it to your take profit, you will have a 1R Scalp (1 measure of risk to 1 measure of reward).
This isn't a true scalp, typically they should be in the same bar or next bar, but this follows similar principles.
That's all for BTC, stay tuned for more analysis as we go over Ethereum, XRP, and one more of your choosing.
Happy Trading!
@thecafetrader