A Legends Continuation. BTCHello I am the Cafe Trader.
Today we are going to look at a trade inspired by the Legendary Trader and Scalper Al Brooks.
If you are not familiar with him I recommend having a strong foundation with price action before giving him a look.
It's no secret that BTC is at levels many thought it would never reach, and yet many others are convinced of 5 - 10x more from this run alone. It can be crushing to feel like you missed out on the move, so instead of getting FOMO, I've detailed a guide to help you in the short or the long term.
Long Term
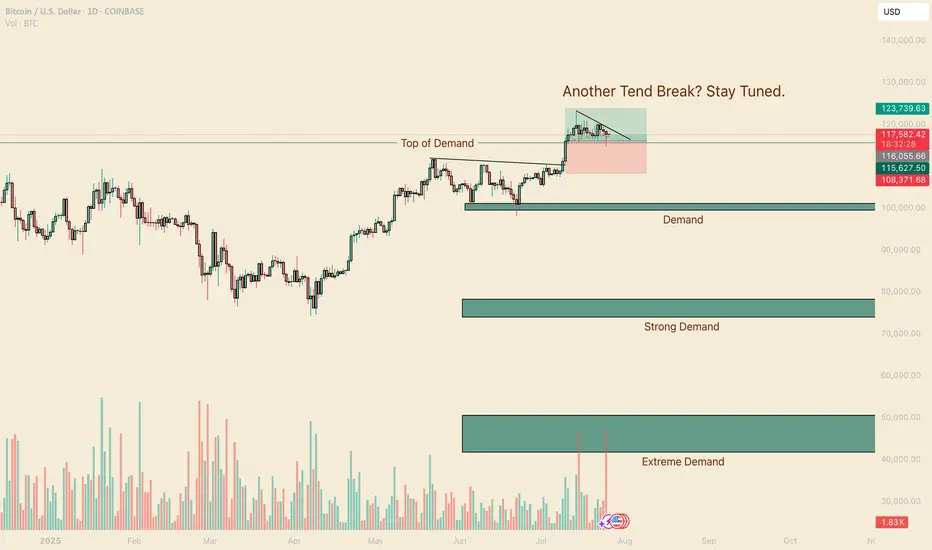
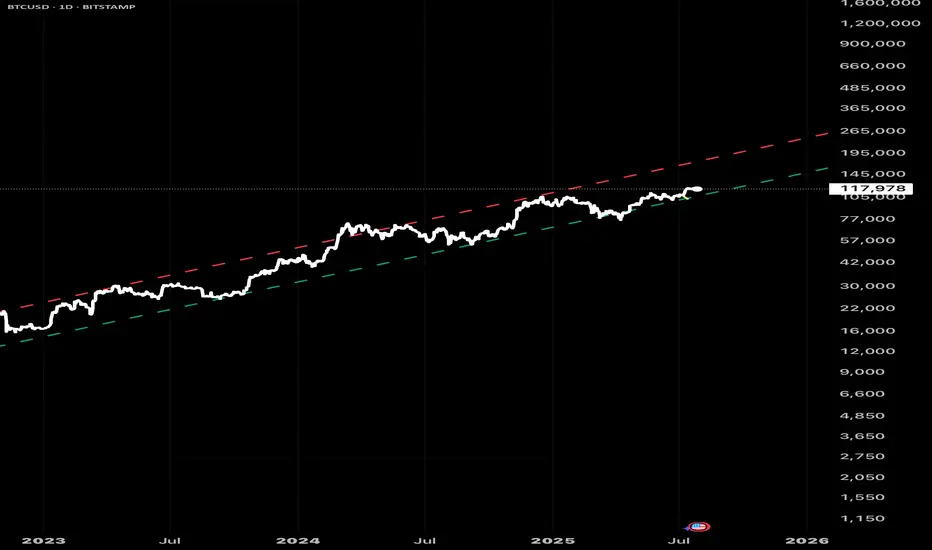
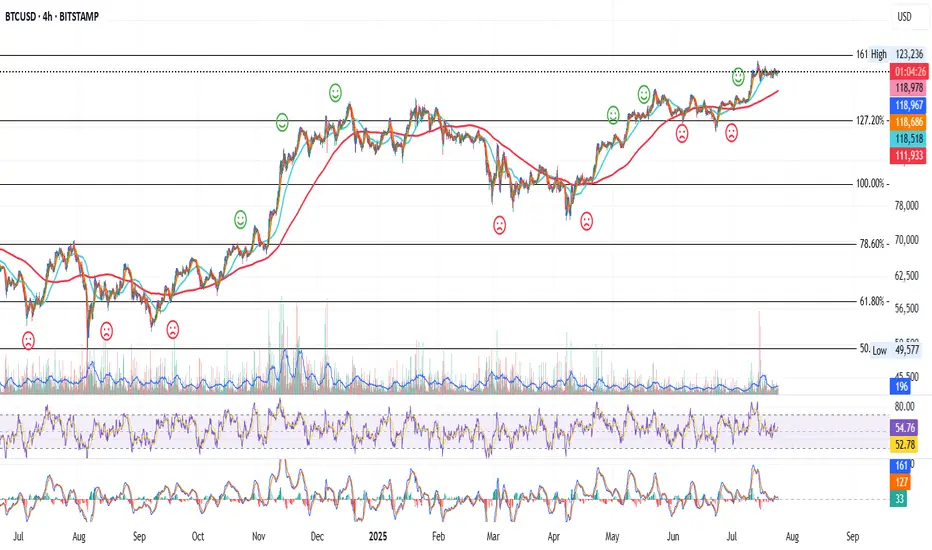
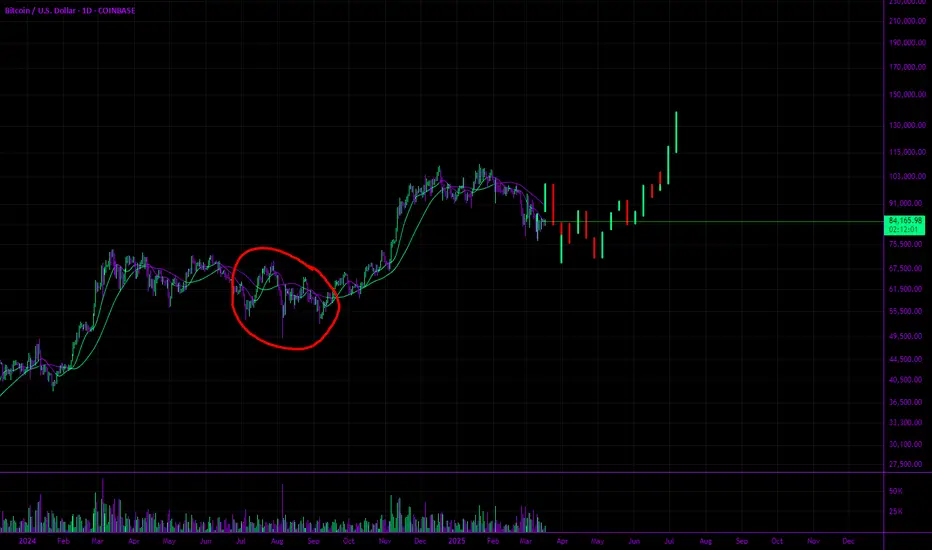
As of right now you are looking at 4 different levels of demand. It is up to you to measure your conviction, understanding why you want to invest, and how much you are willing to risk. Recognize that Many Big hedge funds have been hesitant with accumulating hoards of Crypto do to its volatile nature, considering it too risky.
So with this in mind, I have given you 4 levels to add BTC to your long term depending on your personal conviction.
Hyper Aggressive = Top of Demand $115,500 (willing to risk 50%)
Aggressive = Demand $99,500-101,250 (willing to risk 40%)
Fair Price = Strong Demand $74,000 - 78,000 (willing to risk 25%)
Steal = Extreme Demand $42,000 - 50,800 (willing to risk 10%)
Thinking about how much you are willing to risk will help you level out your Fear of missing this move, and get pricing that meets your personal demand.
Short Term
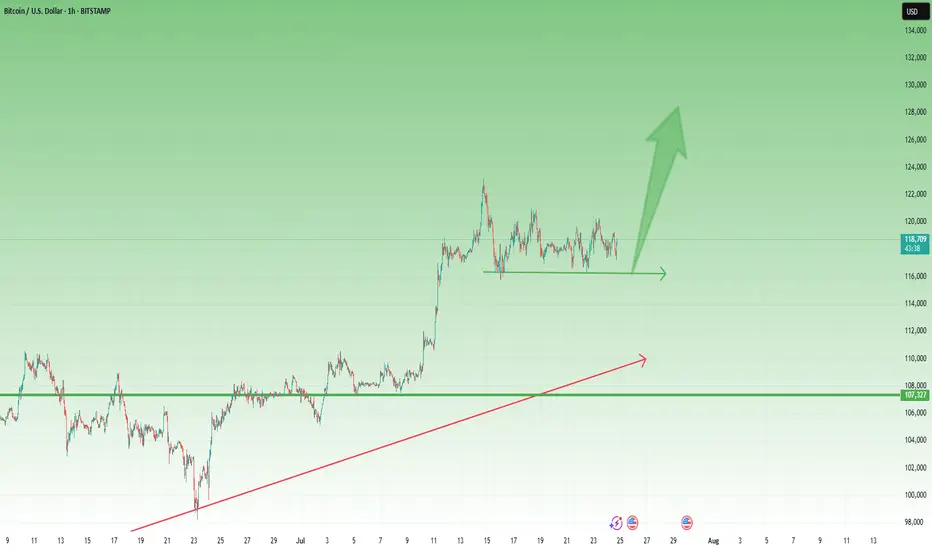
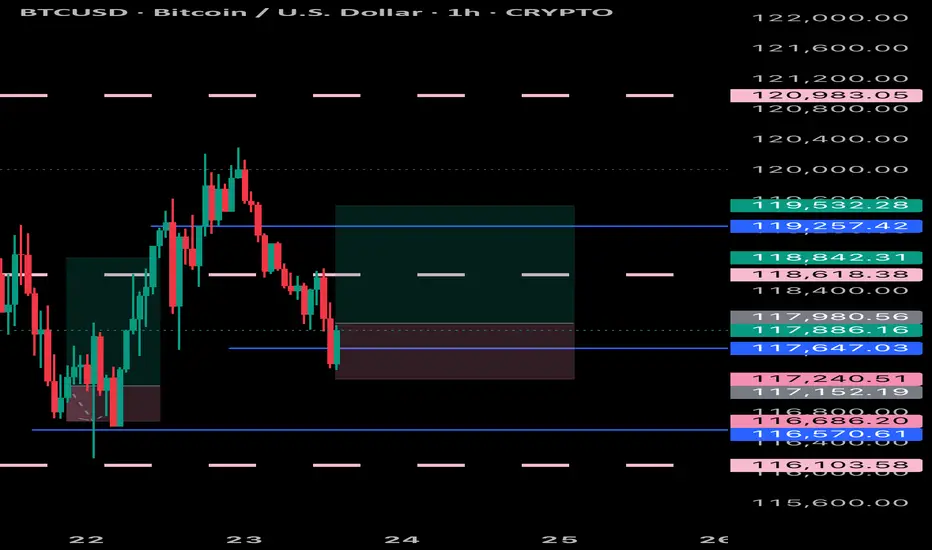
My fellow traders, this is a nugget (inspired) from Al Brooks. The "Two Bar Trend Break" .
In a strong trend (not in a range), When you get a trend break (I like to go top of wick to top of wick for this trade), if the second bar doesn't have a huge topping tail, but closes near the top, you can enter this trade.
Here is a trade that happened this month That hasn't filled yet (it got close).
Entry At the close of the second green candle $116,000.
Measure the bottom of the First candle that broke (called the Signal candle) to the top of the second bar that broke (called the Entery Candle). If you take that measurement, and add it to your take profit, you will have a 1R Scalp (1 measure of risk to 1 measure of reward).
This isn't a true scalp, typically they should be in the same bar or next bar, but this follows similar principles.
That's all for BTC, stay tuned for more analysis as we go over Ethereum, XRP, and one more of your choosing.
Happy Trading!
@thecafetrader
BTCUSD.P trade ideas
BTCUSD – Bulls Still in Control After New ATH 🔸 After the new All-Time High printed 10 days ago, Bitcoin entered a consolidation phase. So far, the market looks healthy and seems to be waiting for a trigger to continue the uptrend.
🔸 A clear support zone has formed around 116k, and as long as this level holds, bulls remain in full control of the market.
📉 For short-term traders and speculators:
Buying dips near 117.5k could offer solid risk/reward setups, with a target around 125k in case of a breakout.
Let’s see if the market gives us the trigger we’re waiting for. 🚀
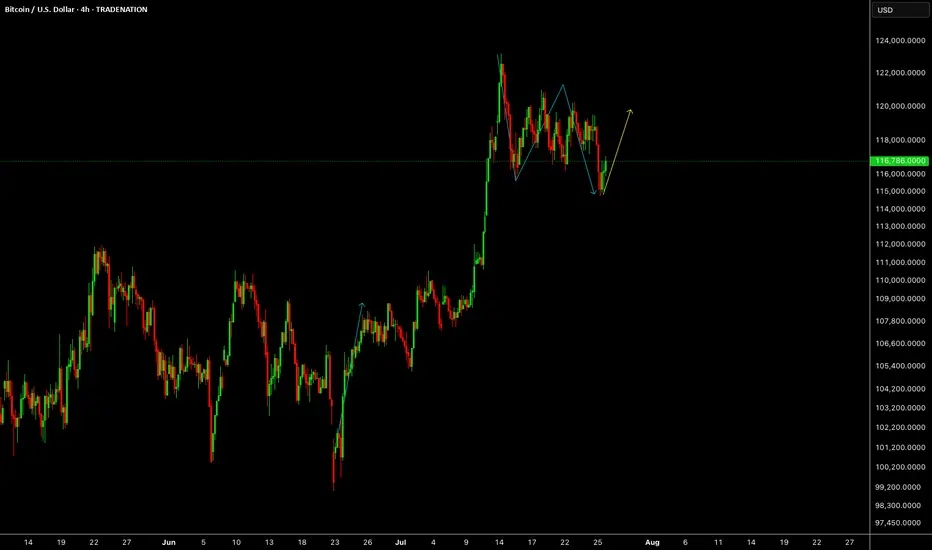
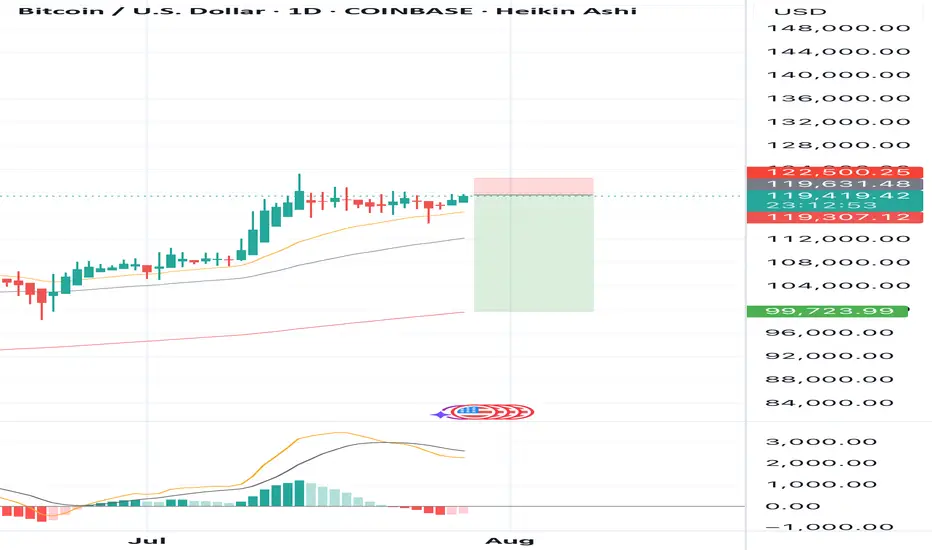
BTCUSDBTCUSD is correcting for more upside, last drop can happen just to complete the structure before upside starts again.
Disclosure: We are part of Trade Nation's Influencer program and receive a monthly fee for using their TradingView charts in our analysis.
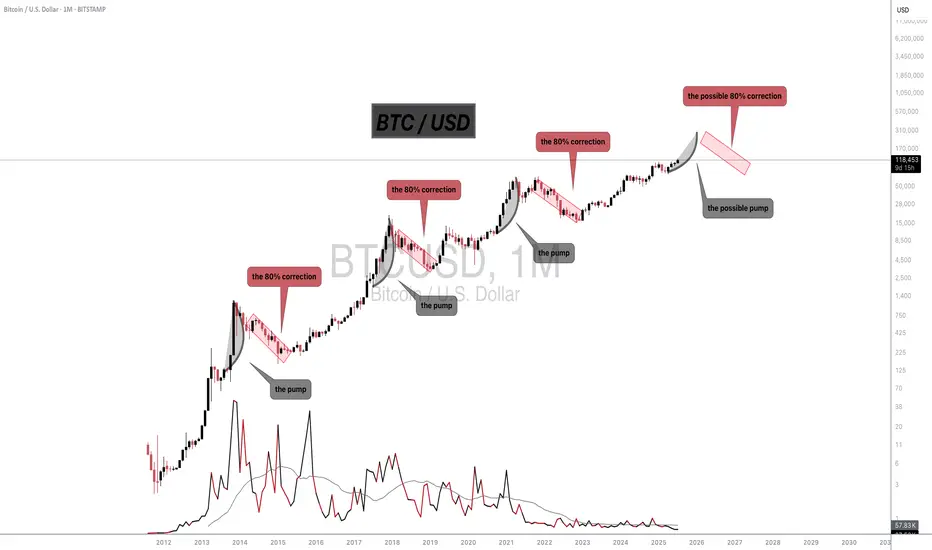
Bitcoin prediction (no fluff)I made this trend many months ago.
Thought I would share it with anyone considering BTC as a hedge against fiat inflation.
No candle sticks movement predictions.
No wedges.
No Fibonacci sequence.
The real mover of BTC is basically Stock-to-Flow corrected (downward) by BTC movement which doesn’t occur on exchanges (which is challenging to quantify).
But vague data suggests that OTC inventory is dwindling by the week.
Therefore, once OTC transactions go to zero, BTC will break upward through the top of this channel and approach the S2F.
BTC SHORT TP:113,500 25-07-2025We’re looking for a clean short from 116,200 to 116,600, aiming for targets between 113,200 and 113,600.
This move offers an average 3.5 RR on the 2-hour timeframe, and we expect it to play out within 24 hours.
Technical context: This looks like a simple bearish continuation after recent price action. Momentum has shifted and this setup offers a clean entry post-manipulation.
Manage your stop-loss according to your strategy and stay updated for the next move.
We don’t use indicators, we’re not out here drawing lines or cute little shapes — I just give you a clean trade.
If price doesn’t move within the expected time, the trade becomes invalid.
July 22 Bitcoin Bybit chart analysisHello
It's a Bitcoin Guide.
If you "follow"
You can receive real-time movement paths and comment notifications on major sections.
If my analysis was helpful,
Please click the booster button at the bottom.
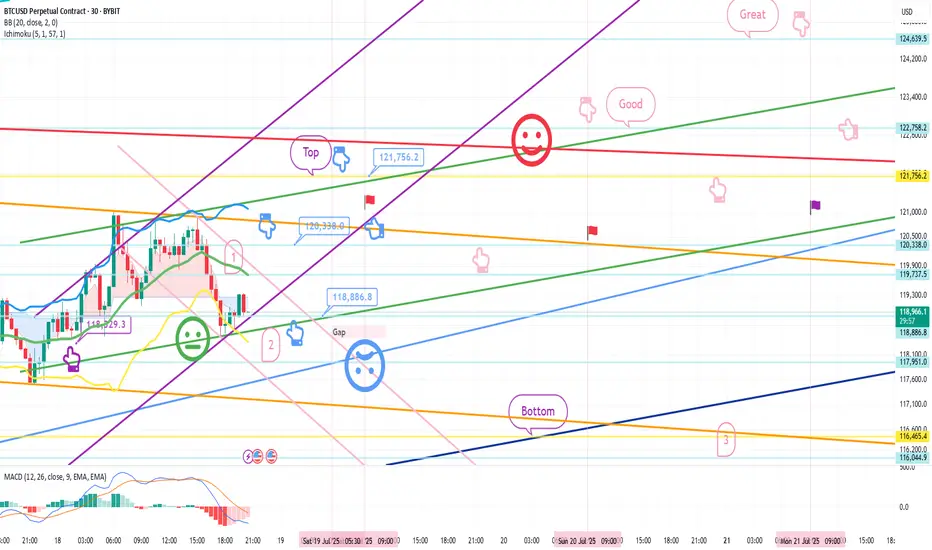
This is Bitcoin's 30-minute chart.
Nasdaq indicators will be released at 9:30 in a little while.
Although Bitcoin's mid-term pattern is broken,
it looks like a strong upward trend based on signals and candlestick positions.
In the case of Nasdaq, the 6-hour and 12-hour charts MACD dead cross is in progress,
and even if there is no plunge and only a sideways movement,
it seems likely that today's strategy will be successful.
In the bottom left, from the analysis article on the 18th,
the final long position entry point of $116,465.4 Bottom
is connected as is.
*Red finger movement path
One-way long position strategy
1. $118,461.9 long position entry section / green support line breakout, stop loss price
2. $120,338 long position 1st target -> Good, Great in order of target price
See the 1st section at the top as a touch section for an upward wave rather than a short position entry,
and if this section breaks through right away, an upward trend can be connected.
If the purple parallel line support line is maintained without breaking away,
there is a possibility of a vertical rise.
If the top section is touched,
after the first liquidation,
it would be good to use the 1st section to re-enter a long position.
The 2nd section at the bottom is important,
and if it is pushed to this section according to the movement of Nasdaq today,
it can fall strongly.
Please check the real-time support line shape.
From the breakout, Bottom -> 3 sections are open.
If you touch the 3rd section after tomorrow, the mid-term pattern will be restored.
This is the 12+ day section.
Up to this point, I ask that you simply use my analysis for reference and use only.
I hope that you will operate safely with the principle of trading and stop loss.
Thank you.
BITCOIN UPDATE Bitcoin seems to be preparing to fix its lows so it’s time to target a trade to the up side because, it had dropped to a fair amount of lows
BTC 4H – Dance with the 200MA
Bitcoin continues its strong relationship with the 200MA.
Each time price dips below it, fear spikes — but bounces off key Fib levels have followed, with price then riding higher alongside the 200MA.
Right now, price is caught between the 200MA and a nearby Fib level.
Here’s what could happen next:
– Price flips the Fib into support, ideally with help from a rising 200MA.
– Price waits for the 200MA to catch up, and they break the Fib together.
– Or, we get another panic dip, and the bounce comes after another test from below.
Whichever path it takes, we’ll be here watching it unfold.
Always take profits and manage risk.
Interaction is welcome.
BTC/USD – 4H Technical and Fundamental AnalysisBTC/USD – 4H Technical and Fundamental Analysis
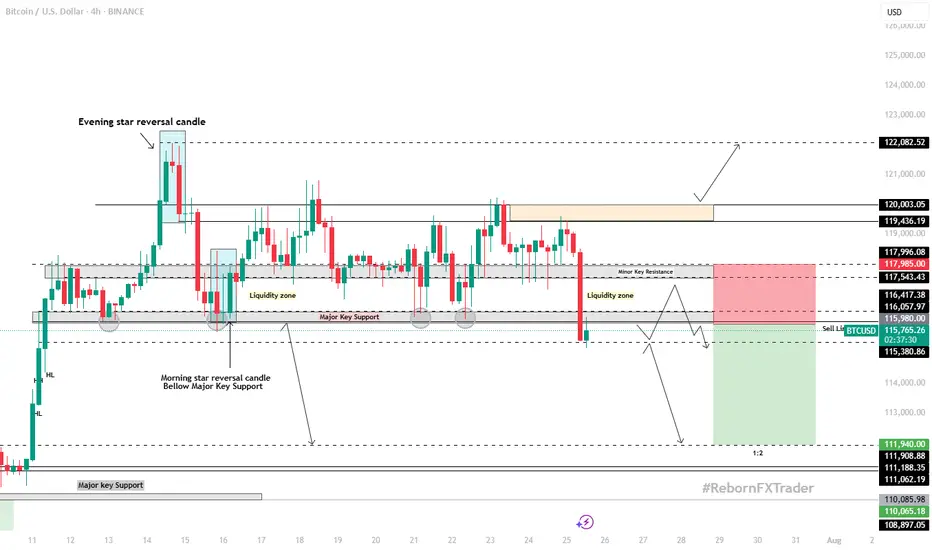
BTC/USD saw sharp downside pressure today, driven by a wave of long position liquidations—exceeding $800 million across the crypto market in the past 24 hours. The sudden shift triggered panic selling, dragging Bitcoin below its psychological and technical support near $116,000. Broader crypto market sentiment turned risk-off as large investors reduced exposure, accelerating the sell-off.
Fundamentally, the market remains cautious amid a lack of positive macroeconomic catalysts for risk assets. Speculation about stricter U.S. regulatory oversight and declining inflows into crypto ETFs also dampened sentiment. Combined with hawkish remarks from Fed officials, which keep interest rates elevated, appetite for high-risk assets like Bitcoin weakened further.
From a technical perspective, BTC/USD broke below the major support level of $116,000, confirming bearish pressure. This breakdown followed a period of consolidation, with price failing to maintain bullish momentum. A liquidity hunt appears to be underway, with price revisiting the zone to trap breakout traders before resuming its move.
We are now watching for a confirmed 4H candle close below the liquidity zone. Once confirmed, a short setup is validated, with targets aligned with the next key support zone.
📍 Sell Setup
Entry: Sell Limit at 115,980.00
Stop Loss: 117,985.00
Take Profit: 111,940.00
📌 Disclaimer:
This is not financial advice. Always wait for proper confirmation before executing trades. Manage risk wisely and trade what you see—not what you feel.
Bitcoin – Breakout Coming, But May Be a TrapBitcoin is trading within a well-defined bullish pennant structure on the 1H chart, with clear compression between a rising support and descending resistance. This pattern typically signals a continuation of the prior trend, but given the surrounding liquidity and recent FVG formation, the setup looks more nuanced. After a liquidity sweep earlier this session, price has rebounded and is currently respecting a newly formed 1H fair value gap within the pennant range.
Pennant Structure and Price Reaction
The consolidation is tight and clean, with buyers stepping in off the ascending trendline support. This area overlaps with a small FVG that has so far held as intraday support, suggesting active demand. Until this gap is violated, the structure remains intact and favors a breakout play to the upside. However, with a larger unmitigated FVG sitting just under 121,000 and a previous swing high forming a strong liquidity pool, the upside might be limited.
Buy Side Liquidity and Reversal Area
If price can push above the descending trendline, the next logical target is the buy side liquidity sitting around 120,800 to 121,200. That zone is also where sellers may step in, given it aligns with prior inefficiency and a probable stop hunt level. This makes it a high-probability reversal area. I expect price to take out that buy side before we get a meaningful shift lower again.
Displacement and FVG Reactions
Any clean displacement toward the upside, particularly into the 121k range, will be key to watch for rejection signs. Should we see rejection or an SFP at the liquidity zone, that would likely confirm the short-term top. At that point, I’d expect a return into the pennant or even a sweep of the trendline support again, setting up a deeper retracement.
Short-Term Expectations
In the immediate term, as long as price holds above the current FVG and trendline confluence, I expect Bitcoin to slowly grind higher and break out of the pennant. The objective is the liquidity above 120,800. Once that’s taken, I’ll be watching closely for signs of exhaustion or reversal patterns to get positioned short again.
Conclusion
Bitcoin is compressing within a bullish pennant and currently holding a fair value gap, suggesting bullish continuation in the short term. However, the real play may come after a sweep of the buy side liquidity near 121k, where I expect a bearish rejection and opportunity for downside positioning. The market structure remains neutral to bullish until that liquidity is tagged.
Disclosure: I am part of Trade Nation's Influencer program and receive a monthly fee for using their TradingView charts in my analysis.
___________________________________
Thanks for your support!
If you found this idea helpful or learned something new, drop a like 👍 and leave a comment, I’d love to hear your thoughts! 🚀

BTCUSD DROPPED BELOW LOCAL SUPPORTBTCUSD DROPPED BELOW LOCAL SUPPORT📉
Today bitcoin dropped below the level of 116,000.00 on high volume. However, the price didn't go somewhere far downwards and consolidates slightly below this level. Presumably, descending channel may be formed.
What is a descending channel?
A descending channel is a bearish chart pattern formed by two downward-sloping parallel trendlines connecting lower highs and lower lows in a pair’s price, indicating a consistent downtrend. It shows sellers are in control, with prices declining within a defined range.
Here I presume the price to rebound from lower border of the descending channel with possible movement towards upper border slightly below the 120,000.00 level.

BTC/USD Buy Setup (6H Chart)📈 BTC/USD Buy Setup (6H Chart)
Strategy: Trendline Support Bounce
🔹 Entry
Price: $118,674.3
Reason: Price is bouncing off a supportive trendline and holding above the 1st Support zone.
🔻 Stop Loss (SL)
Price: $114,470.6
Reason: Below the 1st Support zone to protect against breakdown.
🎯 Take Profit Targets
TP1: $123,269.6
Reason: Near recent swing high, good for partial profit.
TP2: $127,661.4
Reason: Next resistance zone, ideal for full exit or trailing stop.
#MJTrading
#Bitcoin

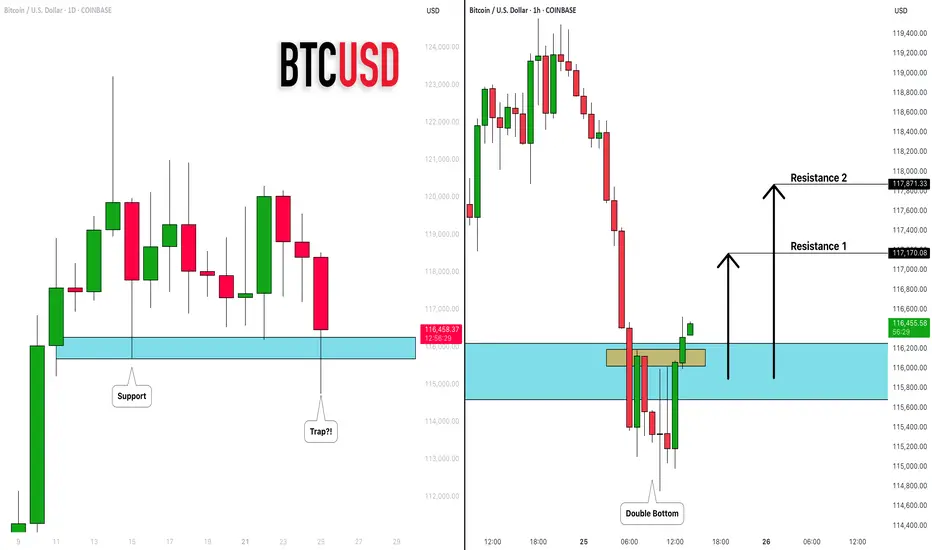
BITCOIN (BTCUSD): Recovery Starts
Bitcoin is going to rise from a key daily support.
After a liquidity grab, the market shows a clear strength,
forming a double bottom on an hourly time frame.
I expect a bullish movement at least to 117100
❤️Please, support my work with like, thank you!❤️
I am part of Trade Nation's Influencer program and receive a monthly fee for using their TradingView charts in my analysis.
WHO WILL WIN BITCOIN'S RANGE BATTLE? In this weeks analysis, Bitcoin has been stack in a tight range for almost two weeks now. Trading range between $115k and $120k. Trend is still holding up for Bullish continuation but indicators strongly cautions loud Sirens. A decisive daily close above $120,200 could be the winning whistle for Bullish Continuation, while I see selling pressure to continue to the Support Block of about 113k. Also the selling Volumes are huge but prices are always quickly absorbed suggesting an accumulation is happening more than a distribution. So my thesis for Bitcoin is sideways range bound until there is a clear market winner. I will be paying much attention to the bearish alarm and a breakdown will be confirmed when daily price decisively close below $115k confirming the divergences on the chart. Trading between the range is high risk.

SELL BTCUSD for bullish trend reversal SELL BTCUSD for bullish trend reversal
STOP LOSS : 122,500
Trade trade is based on false breakout and divergence.....
First what is false breakout, A false breakout in Forex occurs when the price breaks through a key level (like support or resistance) but quickly reverses and returns to its original range, often trapping traders who were expecting a continuation of the breakout. It's essentially a false signal, indicating a potential trend reversal or continuation, but the price doesn't follow through....
Secondly what is divergence ,In forex trading, divergence occurs when the price of a currency pair moves in one direction, while a technical indicator (like an oscillator) moves in the opposite direction. This mismatch can signal a potential trend reversal or weakening trend. There are two main types: bullish and bearish divergence.
On this trade we are taking it because we saw regular bearish divergence
Regular Bearish Divergence
In case of Regular Bearish Divergence:
* The Indicator shows Lower Highs
* Actual Market Price shows Higher Highs
We can see a strong divergence on the RSI already and There is a strong trend reversal on the daily time frame chart.....
The daily time frame is showing strength of trend reversal from this level resistance so we are looking for the trend reversal and correction push from here .....
Bitcoin vs Global M2: Can Liquidity Predict the future?This chart compares Bitcoin’s price (daily) with a Global M2 indicator that includes the monetary supply of major economies like the U.S., Eurozone, China, and Japan.
It’s not a perfect global measure — but it gives us a reliable macro signal of what global liquidity is doing.
And when it comes to Bitcoin, liquidity is everything.
Why this matters:
Bitcoin is often seen as volatile or unpredictable. But when we zoom out and overlay it with liquidity flows (like M2), a powerful pattern emerges:
Bitcoin tends to follow global M2 with a ~10-week lag.
When M2 rises, Bitcoin often rallies weeks later. When M2 contracts, Bitcoin loses momentum.
This makes M2 a powerful leading indicator — not for predicting exact price levels, but for catching the direction of trend and regime shifts.
What this chart tells us:
M2 leads, Bitcoin follows.
The curves won’t align perfectly — but the macro structure is there.
Big expansions in M2 create a friendlier environment for risk assets like BTC.
This is the same logic used by macro strategists like Raoul Pal: liquidity drives everything.
Important disclaimer:
This doesn’t mean M2 tells you where price will be on a specific date. But it can help identify turning points — and confirm whether we’re in a reflationary vs contractionary environment.
Think of it as a weather forecast, not a GPS pin.
In other words:
This chart doesn't show the price. It shows the future.

$BTCUSDT: Fictitious Fractal 136KSo. I see we are having a relatively difficult time.
My expectations are in this range for the next appx. 125 days - 365 days.
Downside: 68.6k-69.9k
Topside: 100k to 136k (round to 150k)
I drew this fractal by hand and I want to watch it closely.
I expect in the next few weeks we hit 100k and then do a nice rug to 69k range.
This is probably wrong.
I pretty much extrapolated the red brush circle into a weeks long fractal.
I am longing all the dips to 68k.
Enjoy.
Mr. Storm.
BTC predictionSome of you may feel dissatisfaction, emptiness, or longing. This longing is the loss of freedom, and it is freedom that you truly yearn for.

Bearish Outlook for BTCUSDOn the 4-hour timeframe, Bitcoin seems to be starting a corrective phase, likely moving toward the $110 mark. Current price action is facing resistance at a descending trendline, aligned with the 78.6% Fibonacci retracement level, which should limit any short-term upward moves. The price is also trading below the 50-period SMA, with a strong bearish candle from a few sessions back supporting the downward trend.
For a bullish outlook to take hold, Bitcoin would need to decisively break above the 78.6% Fibonacci level with a robust bullish candle closing above the 50 SMA. Until that happens, I remain bearish, with a target of $110.
This technical perspective aligns with the scenario where the Federal Reserve opts to maintain interest rates at 4.50% at this Wednesday's FOMC meeting
Stay cautious and trade wisely!

BTCUSD 7/27/2025Come Tap into the mind of SnipeGoat as he gives you a Full Top-Down Analysis of Bitcoins Price Action as we embark on another week of Quarter 3.
_SnipeGoat_
_TheeCandleReadingGURU_
#PriceAction #MarketStructure #TechnicalAnalysis #Bearish #Bullish #Bitcoin #Crypto #BTCUSD #Forex #NakedChartReader #ZEROindicators #PreciseLevels #ProperTiming #PerfectDirection #ScalpingTrader #IntradayTrader #DayTrader #SwingTrader #PositionalTrader #HighLevelTrader #MambaMentality #GodMode #UltraInstinct #TheeBibleStrategy

Total to 5T & BTC to...?Morning fellas,
No way BTC is stopping here. People are gonna get reckt shorting, and are not gonna believe where this price action is gonna stop.
TOTAL must reach anywhere between 4.5T & 5T, this spread across all Alts.
It has been a long time coming, and the party hasnt even started yet.
Hold your horses and trade thirsty, my friends!
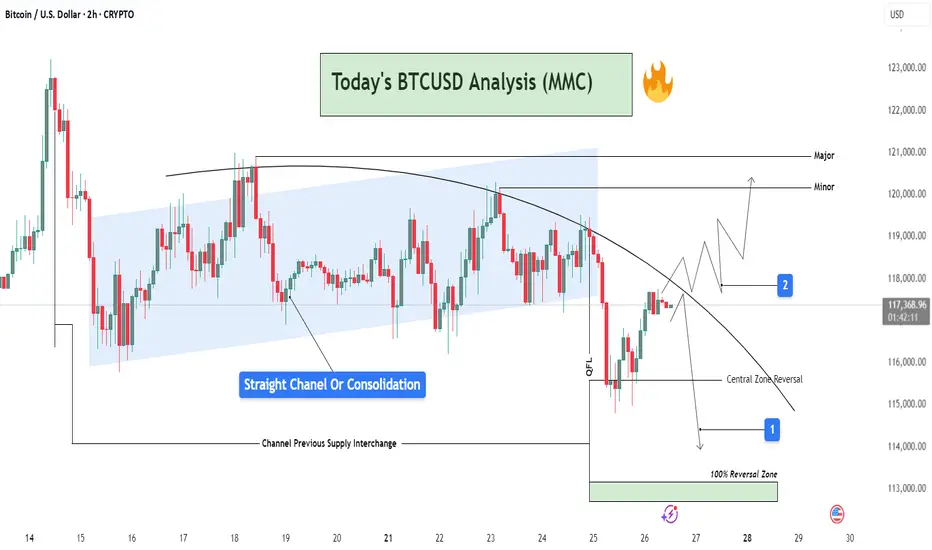
BTCUSD Analysis : Channel Break + QFL Setup | Structure Analysis📊 Chart Overview
This 2H BTCUSD chart reveals a comprehensive view of market behavior transitioning from a phase of consolidation into a potential breakout or further rejection. The price action is analyzed inside a parallel channel, transitioning into a curved resistance path, which is currently governing the market structure.
🔵 Phase 1: Consolidation Inside a Straight Channel
Price has respected a clear ascending channel (highlighted in blue) from July 16 to July 24.
This phase shows a range-bound movement with defined supply and demand zones.
Labelled as “Straight Channel or Consolidation”, this represents a potential accumulation/distribution zone.
The Channel Previous Supply Interchange marks an important S/R flip zone, now serving as a key reference for future reactions.
🔻 Phase 2: Break of Structure & Curved Resistance
Price broke down below the channel support and is now respecting a downward curved trendline.
This indicates a shift in momentum from neutral to bearish, forming lower highs.
A sharp drop occurred post-channel exit, marking a QFL (Quasimodo Failure Level) area—hinting at smart money involvement or liquidation hunt.
🔁 Reversal Scenarios & Key Levels
There are two possible future paths visualized:
🟥 Scenario 1: Bearish Continuation
Price respects the curved trendline, failing to break resistance.
A rejection near the current region (~117.5k) could lead price back toward:
Central Zone Reversal near 115,000 USD
Further into the 100% Reversal Zone (green zone) near 113,500–114,000 USD
Ideal for short entries after clear rejection confirmations.
🟩 Scenario 2: Bullish Breakout
Price breaks and sustains above the curved resistance.
Temporary resistance seen at Minor level (~120,000 USD), followed by Major resistance near 121,000 USD.
This scenario requires bullish volume and reclaim of structure, invalidating the short bias.
🧠 Strategic Viewpoint & Trade Mindset
Market is at a decision point—either confirming a bearish rejection from dynamic resistance or invalidating it for a bullish reversal.
Patience is key; wait for either:
A failed breakout attempt (short opportunity), or
A confirmed breakout and retest (long opportunity).
Use lower timeframes (15m–1h) for execution once direction is confirmed.
July 18 Bitcoin Bybit chart analysisHello
It's a Bitcoin Guide.
If you "follow"
You can receive real-time movement paths and comment notifications on major sections.
If my analysis was helpful,
Please click the booster button at the bottom.
Bitcoin 30-minute chart.
There is no Nasdaq indicator announcement today.
The mid-term pattern was broken in the morning wave,
but I proceeded as safely as possible.
At the bottom left, I connected the final long position switching section in the analysis article on the 15th with a purple finger.
*When the blue finger moves,
Bidirectional neutral
Short->Long or long waiting strategy
1. Short position entry section of $120,338 / Stop loss price when orange resistance line is broken
2. Long position switching of $118,886.8 / Stop loss price when blue support line is broken
3. Long position 1st target of $121,756.2 -> Target price in the order of Good and Great
If it falls immediately from the current position or
touches the top once and falls, it is a vertical decline condition.
If it falls immediately, it is the final long waiting in section 2.
(When the sky blue support line breaks, the stop loss price is the same)
From the sky blue support line break, the 6+12 section is where the mid-term pattern is restored,
and it is roughly the bottom section.
If the strategy is successful, I have left a simulation with a pink finger on the right,
so please check the switching and profit-taking section,
and operate safely in each position, long, short, and no position, based on whether the purple support line breaks from the current position.
From the green support line break, the low point of today's daily candle is broken,
so it would not be good for a long position, right?
Up to this point, please use my analysis article only for reference and use,
and operate safely with principle trading and stop loss price.
Thank you.