July 18 Bitcoin Bybit chart analysisHello
It's a Bitcoin Guide.
If you "follow"
You can receive real-time movement paths and comment notifications on major sections.
If my analysis was helpful,
Please click the booster button at the bottom.
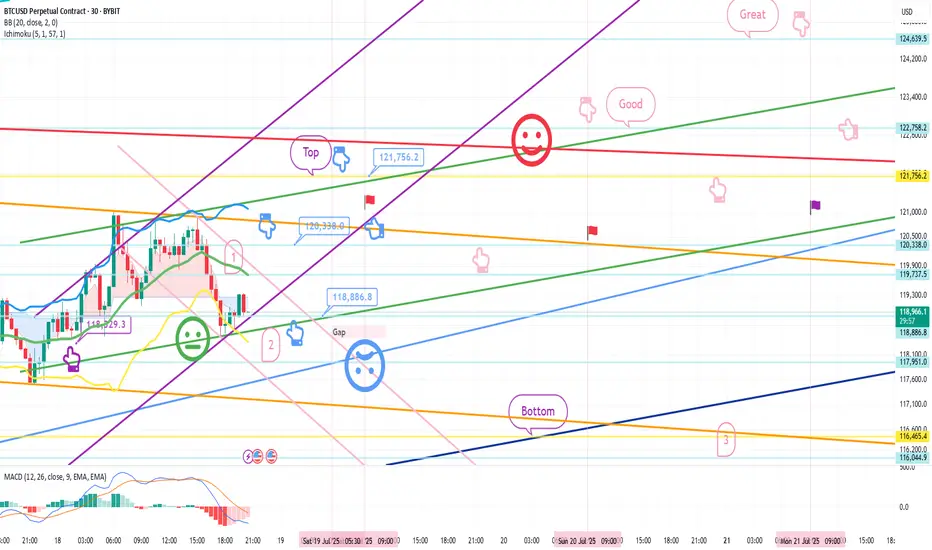
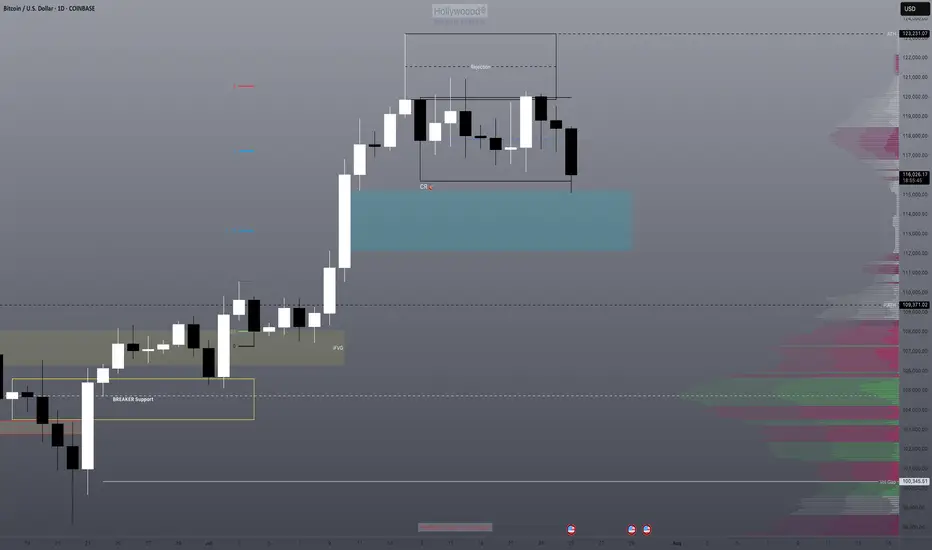
Bitcoin 30-minute chart.
There is no Nasdaq indicator announcement today.
The mid-term pattern was broken in the morning wave,
but I proceeded as safely as possible.
At the bottom left, I connected the final long position switching section in the analysis article on the 15th with a purple finger.
*When the blue finger moves,
Bidirectional neutral
Short->Long or long waiting strategy
1. Short position entry section of $120,338 / Stop loss price when orange resistance line is broken
2. Long position switching of $118,886.8 / Stop loss price when blue support line is broken
3. Long position 1st target of $121,756.2 -> Target price in the order of Good and Great
If it falls immediately from the current position or
touches the top once and falls, it is a vertical decline condition.
If it falls immediately, it is the final long waiting in section 2.
(When the sky blue support line breaks, the stop loss price is the same)
From the sky blue support line break, the 6+12 section is where the mid-term pattern is restored,
and it is roughly the bottom section.
If the strategy is successful, I have left a simulation with a pink finger on the right,
so please check the switching and profit-taking section,
and operate safely in each position, long, short, and no position, based on whether the purple support line breaks from the current position.
From the green support line break, the low point of today's daily candle is broken,
so it would not be good for a long position, right?
Up to this point, please use my analysis article only for reference and use,
and operate safely with principle trading and stop loss price.
Thank you.
BTCUSD.P trade ideas
$BTC NEXT WAVE PROGRAMMED!bitcoin will load the next wave after the accumulation process it is in after the parabolic run
Will cryptos lose their appeal, as more regulation comes in?In this new world, where governments and financial institutions are getting more and more interested in cryptos, will those start losing their appeal?
Let's take a look at CRYPTO:BTCUSD
MARKETSCOM:BITCOIN
CRYPTO:ETHUSD
MARKETSCOM:RIPPLE
Let us know what you think in the comments below.
Thank you.
75.2% of retail investor accounts lose money when trading CFDs with this provider. You should consider whether you understand how CFDs work and whether you can afford to take the high risk of losing your money. Past performance is not necessarily indicative of future results. The value of investments may fall as well as rise and the investor may not get back the amount initially invested. This content is not intended for nor applicable to residents of the UK. Cryptocurrency CFDs and spread bets are restricted in the UK for all retail clients.

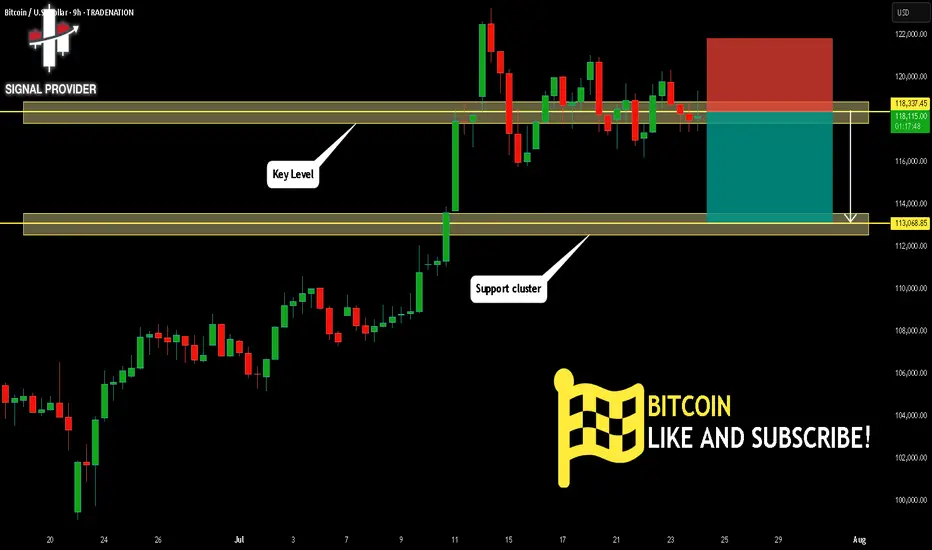
BITCOIN Will Fall! Short!
Take a look at our analysis for BITCOIN.
Time Frame: 9h
Current Trend: Bearish
Sentiment: Overbought (based on 7-period RSI)
Forecast: Bearish
The market is approaching a key horizontal level 118,337.45.
Considering the today's price action, probabilities will be high to see a movement to 113,068.85.
P.S
We determine oversold/overbought condition with RSI indicator.
When it drops below 30 - the market is considered to be oversold.
When it bounces above 70 - the market is considered to be overbought.
Disclosure: I am part of Trade Nation's Influencer program and receive a monthly fee for using their TradingView charts in my analysis.
Like and subscribe and comment my ideas if you enjoy them!
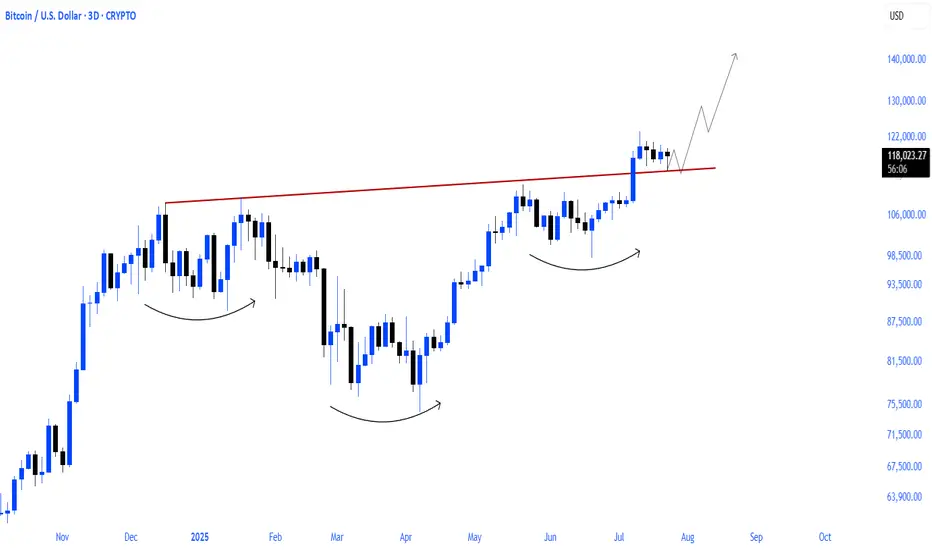
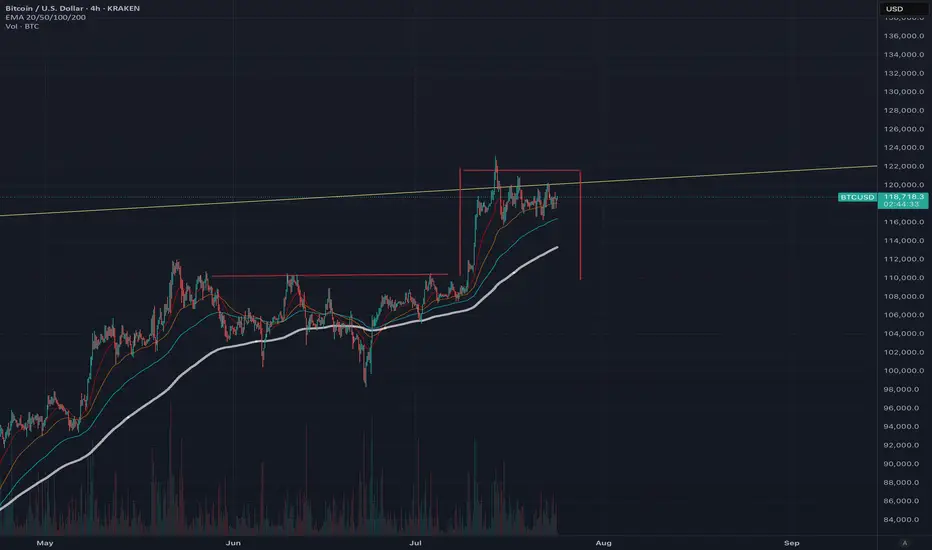
Bart Simpson Pattern Forming? We are in Greed? A possible Bart Simpson pattern is forming, which typically indicates a market top and reversal, with a retest of <$109,000 very likely. This pattern could also create a bearish head and shoulders formation, strongly suggesting a near-term top.
Trading volume continues to decrease, and ETF inflows are now negative, with an increasing volume of BTC on exchanges indicating that sell pressure is mounting. In this situation, a flash crash is also quite likely, so be cautious about where you place your limit sell orders and stop losses..
Both short and long positions are currently low, suggesting there is a lack of direction in the market, whether up or down. This situation often occurs at the end of a bull run. While a push upward is a possibility, based on my analysis, I anticipate that this pattern will break down with an 80:20 probability. However, Bitcoin often challenges expectations and is famously unpredictable. However due to all the media hype and the rolling of capital into Alt coins and the dominance dropping I do believe we are very near the end of the bull run. This is not financial advice (NFA).
BTCUSD BUBBLE ABOUT TO BURST LOL ??? SELL SELL SELLLong term BTCUSD looks like BIG PLAYERS ARE TAKING PROFIT (about to dump this to retailers lol)
I see 15m signal sell with very good risk reward
BTCUSD its ready for correction i dont beleave we will see any NEW HIGHS from here
Let see how will pay out, only time will tell
Thanks

BTC: moment of TRUTHSeveral MA's are converging on the 4 hour chart.
Bitcoin is nearing the hour of Truth:
Are we going up from here?
or will we drop below these MA's and visit 114 to 113K ?
What do you think?

BTCUSD +$500 in the next few candles/sessionsBitcoin (BTCUSD) is showing strong bullish momentum, and current price action indicates a potential move upward by the next $500 in the short term.
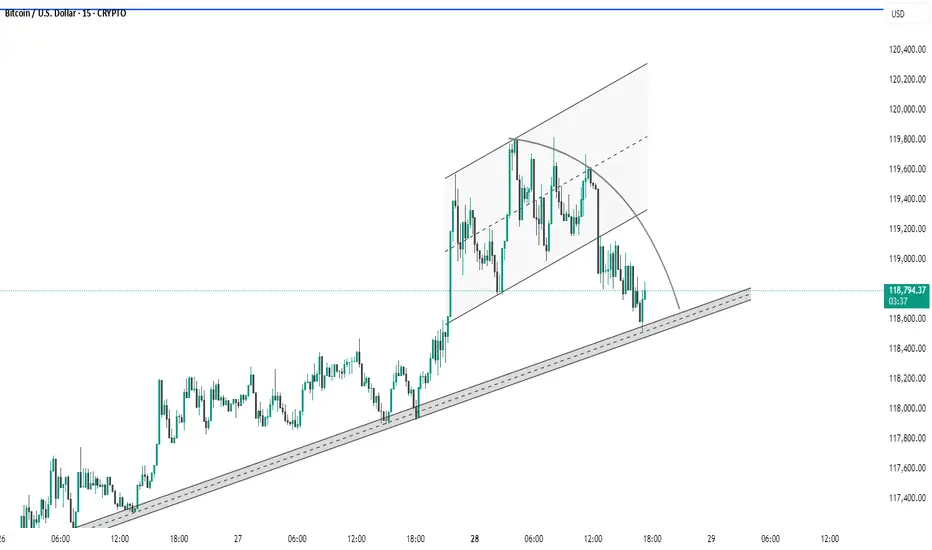
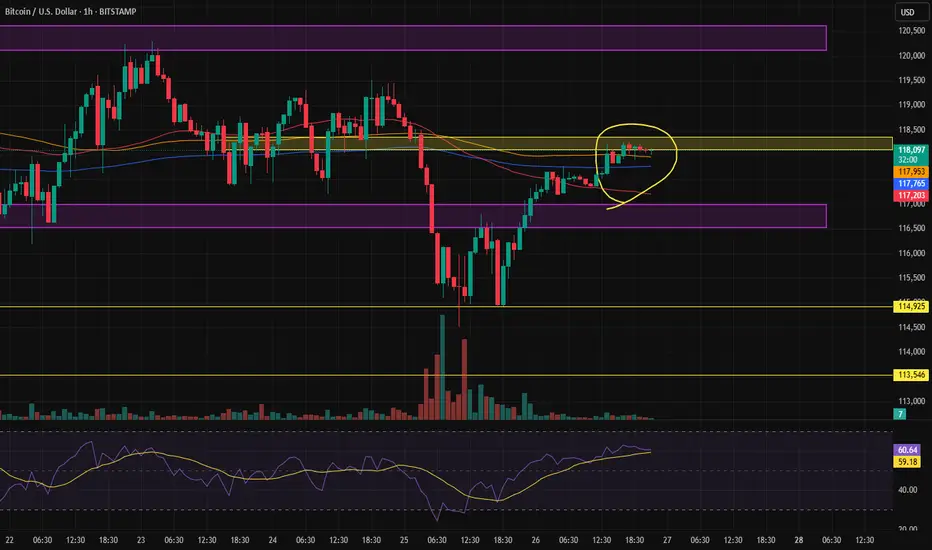
BTC #This 15-minute BTC/USD chart This 15-minute BTC/USD chart shows a rising channel formation that has recently been broken to the downside, indicating potential bearish momentum. The price is currently testing a long-term ascending trendline, acting as a critical support zone around $118,600–$118,800. A breakdown below this trendline could lead to further downside, while a bounce could suggest bullish continuation. The curved arc drawn also hints at a rounding top pattern, reinforcing possible short-term weakness.
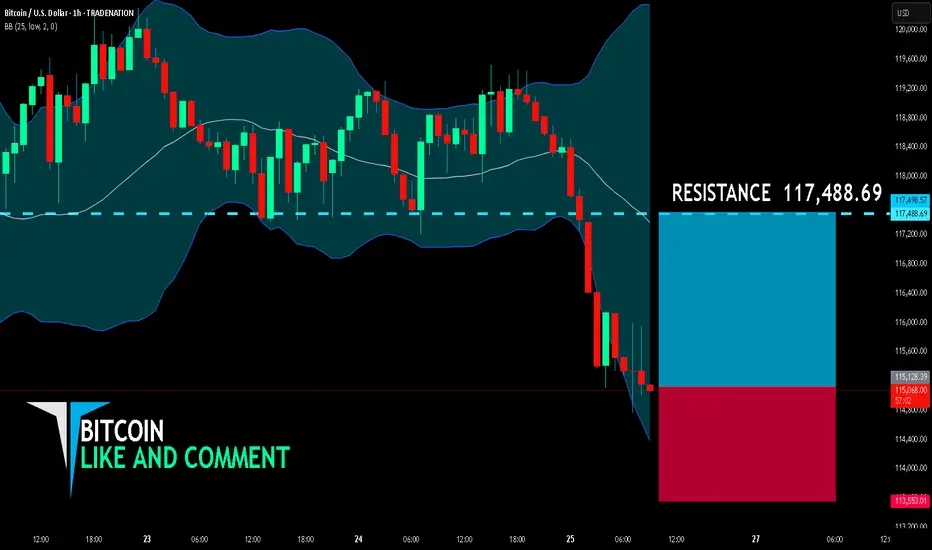
BITCOIN BULLS ARE GAINING STRENGTH|LONG
BITCOIN SIGNAL
Trade Direction: long
Entry Level: 115,128.39
Target Level: 117,488.69
Stop Loss: 113,553.01
RISK PROFILE
Risk level: medium
Suggested risk: 1%
Timeframe: 1h
Disclosure: I am part of Trade Nation's Influencer program and receive a monthly fee for using their TradingView charts in my analysis.
✅LIKE AND COMMENT MY IDEAS✅
BTC on 4H
"Hello, focusing on BTC on the 4-hour chart, the price is currently in a bullish momentum on higher time frames. However, it is showing signals indicating a potential completion of its pullback to the $110,000 zone. In my opinion, the $122,000 zone could be a good area to consider a sell position, with confirmation on the 15-minute chart. I plan to wait for this zone and then decide on initiating a sell position. If you have any updates or alternative perspectives on this analysis, please feel free to share."
If you need further clarification or have more details to discuss, please let me know!


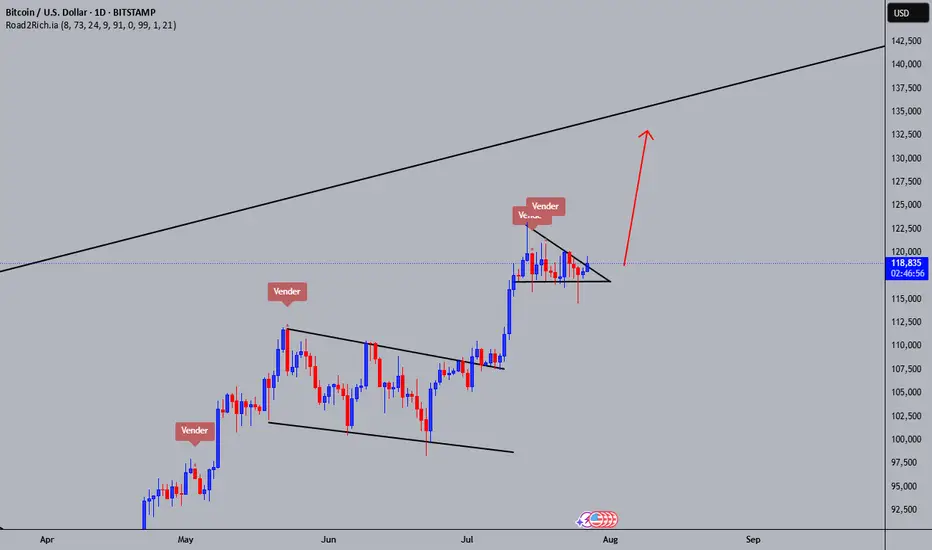
BITCOIN UP!!Look really good if someone of you guys know about chart pattern.
Take a look in this chart.
Looking for some goods position this year. Chart Pattern ( Descending triangle ) looking for breakout. Im my opinion, you dont need a breakout here.
BTCUSD BUYING can expect a bullish move from bitcoin as it has dropped a fair amount and can extract a reversal to the up side due to being oversold
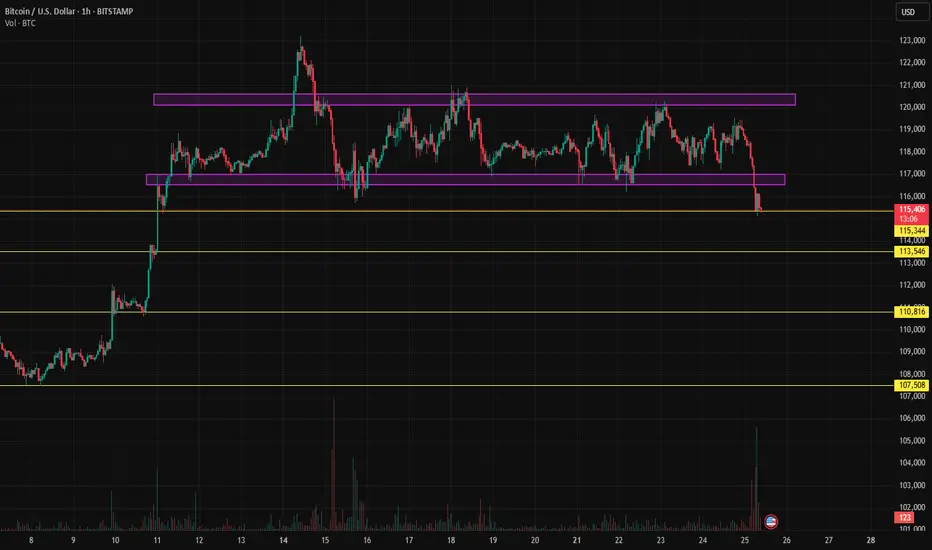
How far will Bitcoin drop? 115? 113? 110? Or even lower?Bitcoin has finally managed to break out of the range after nearly two weeks. Now we need to see whether this breakout gets confirmed or not, and if it does, what volume of selling it will face.
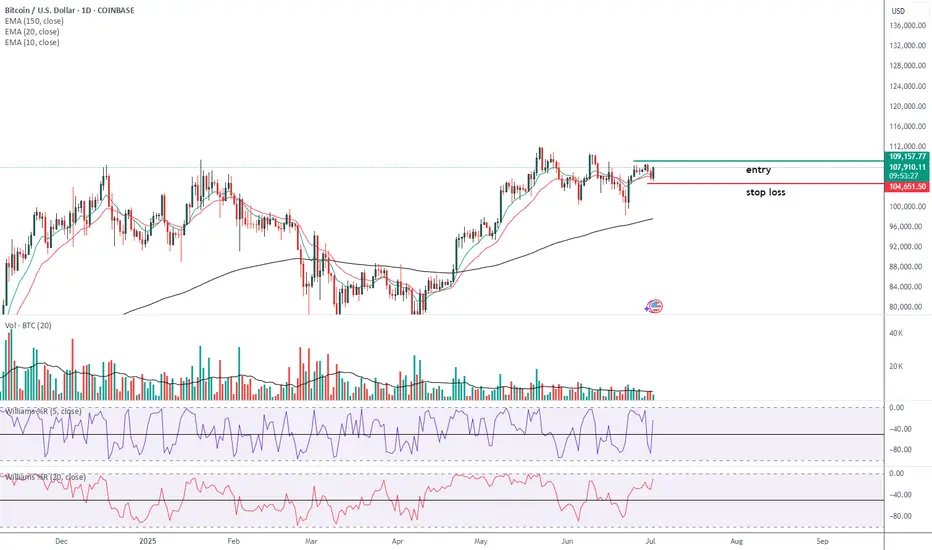
Will the low of this BTC zone be used as a buy point?We have an imbalance high being tested. We know that this also represents the consolidation range low where both TPs and long entries will be triggered.
Will this be enough to send us back bullish or will be need further correction of the imbalance? I think there's a high probability of this with DXY also running into it's daily bearish imbalance range.
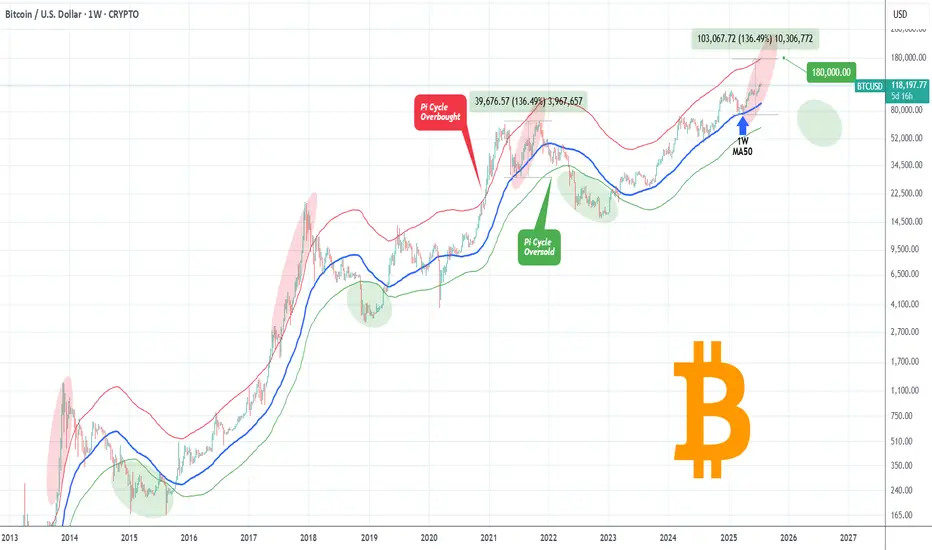
BITCOIN Isn't even overbought yet!Bitcoin (BTCUSD) has been rising strongly within a structured Channel Up pattern but even this consistent and steady uptrend since the April 07 2025 rebound on the 1W MA50 (blue trend-line) hasn't been enough to touch the Pi Cycle's overbought trend-line (red).
Throughout BTC's historic Cycles, all Tops have been priced after the overbought level was breached, which currently sits around $180000 (and rising). Given that the 4-year Cycle Theory won't change, even a repeat of the 'weaker' +136.49% last rally of the previous Cycle (Jun-Nov 2021), would take us to $180k exactly but still will be below the overbought trend-line. This just shows the immense upside potential of the market even at the current stages.
So do you think we will get that kind of rally? Feel free to let us know in the comments section below!
-------------------------------------------------------------------------------
** Please LIKE 👍, FOLLOW ✅, SHARE 🙌 and COMMENT ✍ if you enjoy this idea! Also share your ideas and charts in the comments section below! This is best way to keep it relevant, support us, keep the content here free and allow the idea to reach as many people as possible. **
-------------------------------------------------------------------------------
💸💸💸💸💸💸
👇 👇 👇 👇 👇 👇
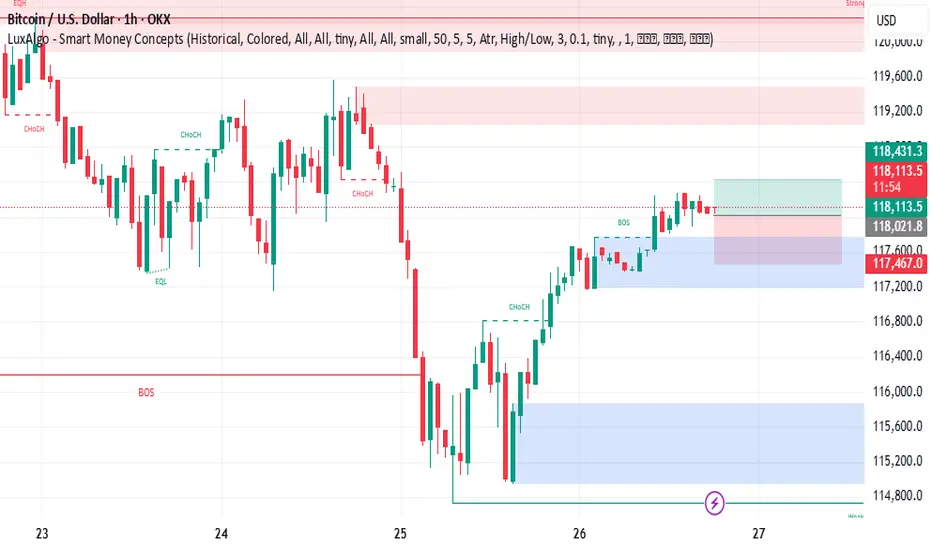
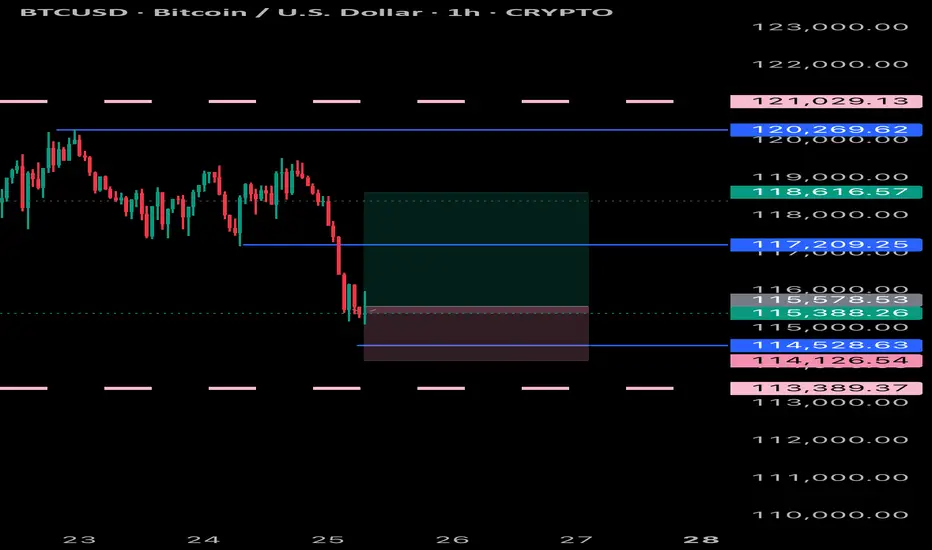
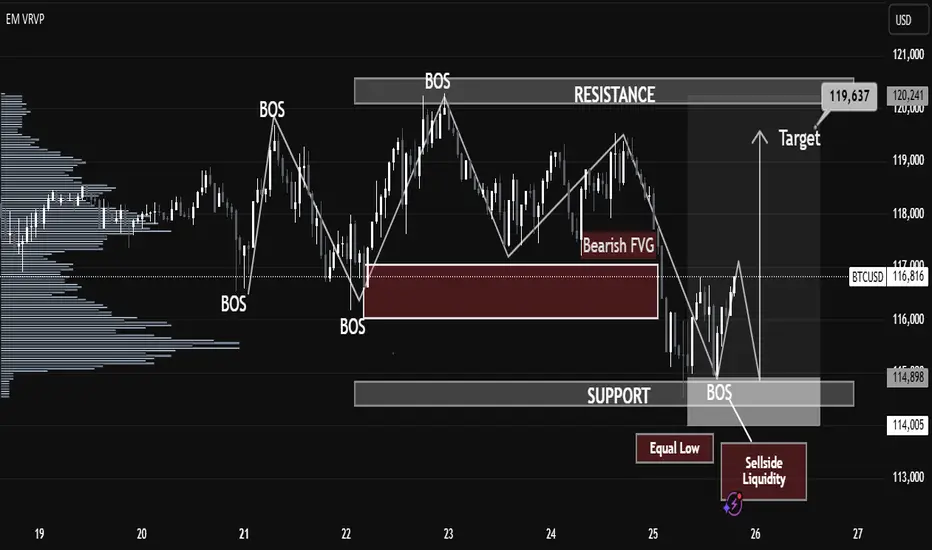
BTC Breaks Structure After Liquidity Grab! Massive Move Loading…BTC/USD Technical Analysis – July 25, 2025
Structure Overview:
The current BTC/USD price action showcases a classic market structure shift, with multiple Breaks of Structure (BOS), liquidity grabs, and a clear intent to revisit premium pricing zones. The chart follows a Smart Money Concepts (SMC) methodology, identifying key supply and demand areas.
Key Highlights:
🔹 Break of Structure (BOS):
Several BOS events indicate momentum shifts and short-term trend reversals. The most recent BOS near the support zone suggests a potential bullish move after liquidity sweep.
🔹 Sell-Side Liquidity & Equal Lows:
BTC swept the Equal Low level near $114,000, triggering Sell-side Liquidity. This liquidity grab is often a manipulative move by institutional players to collect orders before driving price higher.
🔹 Support Zone:
The support zone near $114,900–$114,000 is holding strong. Price wicked into this area, collected liquidity, and reacted with bullish intent.
🔹 Bearish Fair Value Gap (FVG):
A Bearish FVG exists around $117,500–$118,000, which may act as short-term resistance. Price could partially fill this gap before resuming direction.
🔹 Target Zone:
Projected target lies at $119,637, aligning with the prior resistance zone and offering a high-probability area for price delivery based on the current bullish market structure.
🔹 Volume Profile Support:
The volume profile suggests high volume accumulation in the current range, further supporting the possibility of a bullish expansion phase.
Forecast Summary:
Bias: Bullish (Short-term)
Entry Zone: Confirmed after BOS and liquidity sweep near support
Target: $119,637 (resistance zone)
Invalidation Level: Sustained break below $114,000
⚠️ Risk Note:
A rejection from the Bearish FVG or failure to break above $117,800 may cause a deeper pullback. Monitor reactions around key levels before continuation.
Market shows signs of indecisionThe market is in a state of indecision, and no indicator or oscillator can help determine the next move — none of them are useful right now.
The market is waiting to make a decision, and so are we.
We need to stay patient and see which direction it chooses.
BTC at Multi-Factor Resistance: Wave Count Hints at Downside BTC is looking increasingly bearish as the price has risen to a resistance zone formed by multiple factors: trendlines, the POC (Point of Control), and moving averages.
The wave count also supports this bearish outlook / the bearish case.

Bitcoin Long: Completion of Sub-wave 4, riding wave 5I updated the Elliott Wave counts for Bitcoin and we should have completed sub-wave 4 and is currently onto sub-wave 5. Based on my counts, sub-wave 3 has extended and is slightly more than 1.618x of wave 1, thus I expect sub-wave 5 to NOT extend. Based on Fibonacci extensions, the price target is around $124,600.
The stop loss for this idea is around $114,600.
Towards to end of the video, I zoomed out for Bitcoin and observed that Cycle level wave 1 and 3 are HUGE (red font) and the current Cycle Wave 5 looks too small. Thus, the entire 5-wave structure of what we are going through now may be just a Sub-Wave 1 of Cycle Wave 5. And that means that longer-term, Bitcoin may really go to $200,000 and beyond. But for traders, keep our foot on the ground and trade what is in front of us.
Good luck!

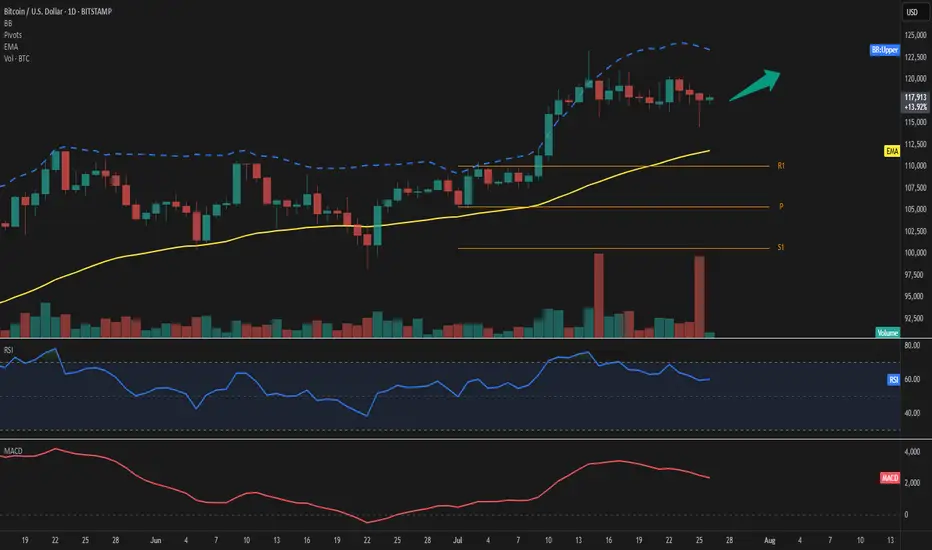
BTC – Bulls still in controlBTC is trading around 117,800 USD, well above both the EMA 50 (111,800) and the pivot level (105,300), confirming bullish dominance. Price remains below the upper Bollinger Band (123,400), leaving potential room for continuation.
Momentum stays constructive, with RSI at 60 and MACD in a strong positive zone, reflecting sustained upward pressure. As long as price holds above EMA 50 and pivot, the next upside targets lie at 123,400 and R1 at 110,000 has already been surpassed.
Volume has dropped significantly (-31%), suggesting the latest move could lack conviction or represent a pause rather than a breakout.
As long as BTC holds above 111,800, the bullish scenario remains intact.
Watch for any rejection near 123,400 or a close back below the EMA as potential invalidation signals.