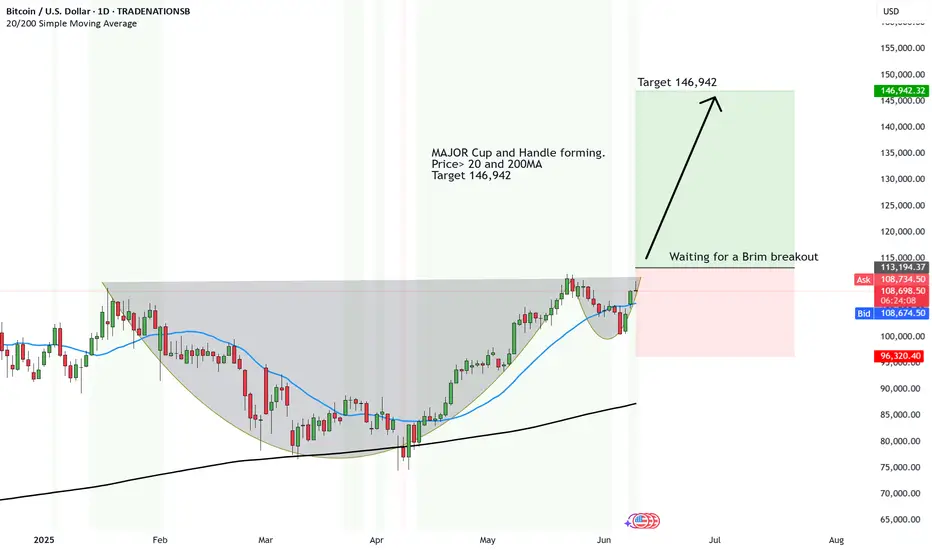
Bitcoin priming itself for a cup of upside to 146,942!MAJOR Cup and Handle is forming on the one and only Bitcoin.
TOp institutions are paying 100s of millions of dollars into the crypto with the idea that it's going to rocket to $200,000.
But baby steps, because the chart is definitely showing upside to come. First it will have to break through the brim level first before we even get a STRONG buy.
Price> 20 and 200MA
Target 146,942
Disclosure: I am part of Trade Nation's Influencer program and receive a monthly fee for using their TradingView charts in my analysis.
BTCUSD.P trade ideas
BTC Cup n Handle PatternBe careful for those who sell there is potential for btc to continue to rise with the formation of a cup n handle pattern.
I am here taking a buy stop position at the price of
105500
sl: 104750
TP: 106750

Can You belive That . QuicK update to my new strategy Bitcoinit will reach the zone , he is going bearich , until the next key level

BTCUSD: Buy AlertCurren halving cycle top will be reached in August/September. Expecting crazy buying till then and maybe another bubble price of 280000-300000 till we fall back till 60000 next year. Leverage on MSTR or Metaplanet

BTC/USD BUY SIGNAL ALERT Entry Point: 104,900BTC/USD BUY SIGNAL ALERT
Entry Point: 104,900
📈 Direction: BUY
🎯 Target 1: 106,000
🎯 Target 2: 108,000
🎯 Final Target: 112,000
🛑 Stop Loss: Use SL wisely – protect your capital
📊 Risk Management: Always manage your risk!
🕒 Trade Type: Short- to mid-term
💡 Ideal for breakout buyers
🔍 Watch price action around 105K zone
⚠️ High volatility expected – trade with caution
💰 Bulls gaining strength on key support
📈 Trend reversal signs are emerging
📌 Patience and discipline = key to success
📉 Avoid FOMO – follow your plan
🗓️ Stay updated on crypto news & events
📢 Let us know if you’re in this trade
✅ Like & share if this helped
🔥 More signals coming – stay connected
📍 BTC/USD Market Update – Watch Closed

BTC/USD: Today's Strategic AnalysisBTC has continued the analyzed upward trend. After testing the resistance area above 110,000, it began to decline. A small-scale decline is expected during the day, and short-term traders can try shorting.
BTC/USD
Sell@110000-111000
tp:108000-107000
I am committed to sharing trading signals every day. Among them, real-time signals will be flexibly pushed according to market dynamics. All the signals sent out last week accurately matched the market trends, helping numerous traders achieve substantial profits. Regardless of your previous investment performance, I believe that with the support of my professional strategies and timely signals, I will surely be able to assist you in breaking through investment bottlenecks and achieving new breakthroughs in the trading field.

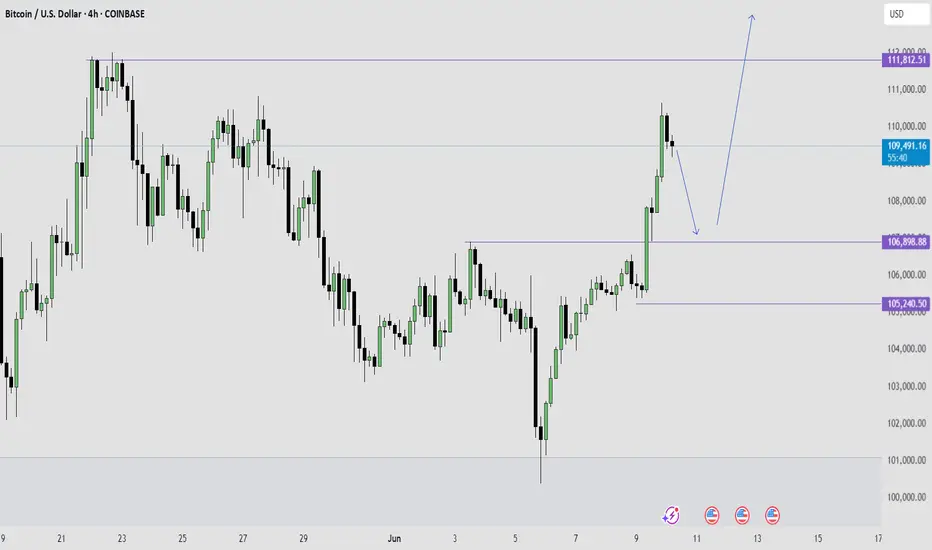
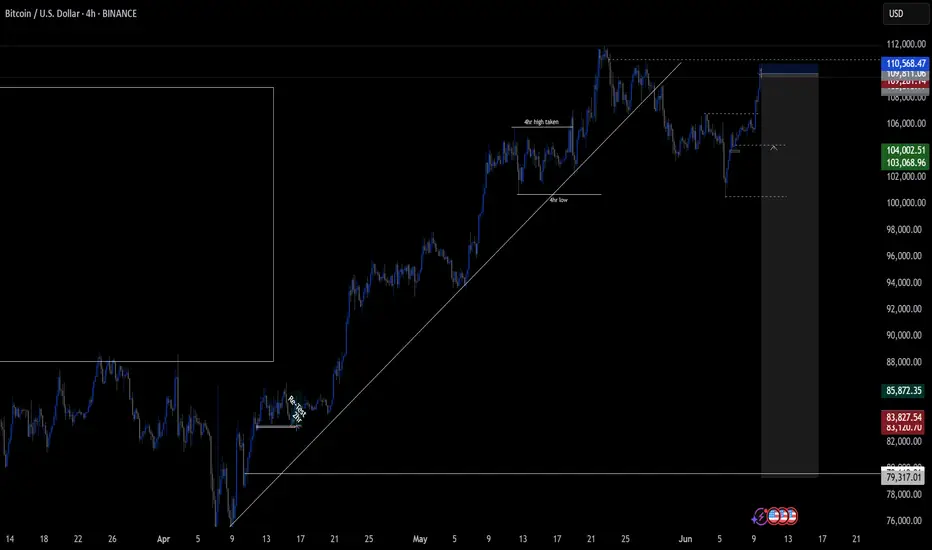
Bitcoin is Super Bullish Right Now - Here is my BTC trade planSince Bitcoin is super bullish on monthly and weekly time frame, my focus is to trade trend continuation pull backs on the 4HR time frame.
For this particular trade, I want to see a pull back to a key level of either imbalance or the old high serving as new support for price.
I will be taking a bullish trend continuation setup on that 4HR pull back.
Target:
I expect to see Bitcoin break that all time high of 111k level and go as high as 150k per one.
Bullish rise?The Bitcoin (BTC/USD) has bounced off the pivot and could rise to the 1st resistance.
Pivot: 101,052.23
1st Support: 94,702.53
1st Resistance: 110,959.87
Risk Warning:
Trading Forex and CFDs carries a high level of risk to your capital and you should only trade with money you can afford to lose. Trading Forex and CFDs may not be suitable for all investors, so please ensure that you fully understand the risks involved and seek independent advice if necessary.
Disclaimer:
The above opinions given constitute general market commentary, and do not constitute the opinion or advice of IC Markets or any form of personal or investment advice.
Any opinions, news, research, analyses, prices, other information, or links to third-party sites contained on this website are provided on an "as-is" basis, are intended only to be informative, is not an advice nor a recommendation, nor research, or a record of our trading prices, or an offer of, or solicitation for a transaction in any financial instrument and thus should not be treated as such. The information provided does not involve any specific investment objectives, financial situation and needs of any specific person who may receive it. Please be aware, that past performance is not a reliable indicator of future performance and/or results. Past Performance or Forward-looking scenarios based upon the reasonable beliefs of the third-party provider are not a guarantee of future performance. Actual results may differ materially from those anticipated in forward-looking or past performance statements. IC Markets makes no representation or warranty and assumes no liability as to the accuracy or completeness of the information provided, nor any loss arising from any investment based on a recommendation, forecast or any information supplied by any third-party.
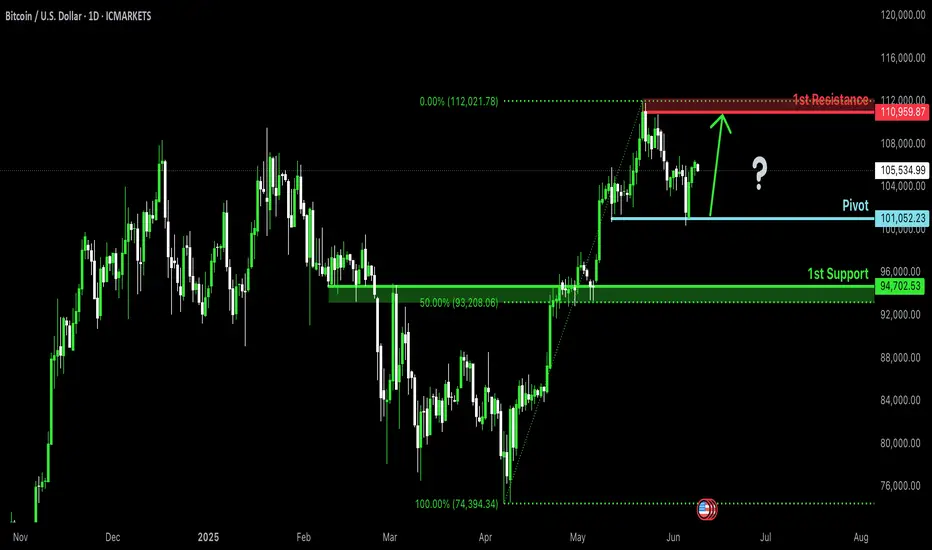
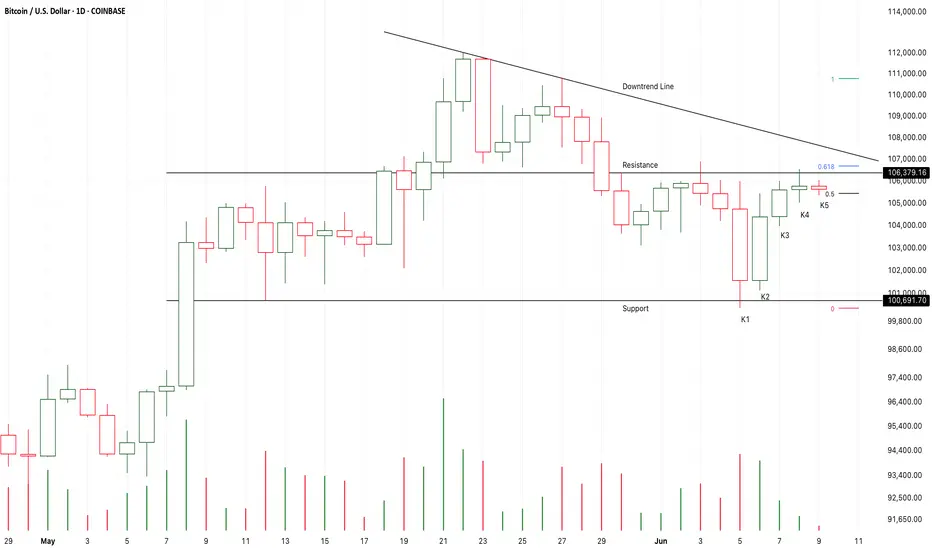
Chart Pattern Analysis Of Bitcoin.
K1 and K2 verified a potential strong support,
If the following candles K5 or K6 close upon the downtrend line like K2,
Another bull run will keep climbing up.
It will be a good place to buy it around the downtrend line.
If the following candles consolidate around the resistance to verify the bullish momentum,
It will also a good place to buy it around the resistance.
On the other hand,
If K5 or K6 close below K4 to verify the resistance,
The market will fall to test the support for more times,
I will try to buy it at about 100K area.
Long-101618/Stop-100618/Target-120K
Long-103188/Stop-102188/Target-120K
BTC, where we can setup our sell positions.Hello, dear traders! It's Nika again.
I want to share this beautiful pattern and tell you some about its meaning...
---
So, as we see here, we have this "triangular-shaped uprising pattern".
We got this pattern with its own few supporting and formatting levels.
Almost all of them are marked on our chart!
---
The "usage" of this may be something like this...
First, we may see the price testing an important price level of pattern 96,000,00 very soon...
---
After, if the price continues checking support levels below, we may also see the 91 & 89 K price levels.
You will profit from this price movement only if the price goes this way. :)
---
Wishing you a happy trading day and much more success in your trades!
---
If you have any questions, please comment or send a message.
Thank you!

BTCUSD Sell Setup Entry Point: 105,500BTCUSD Sell Setup
Entry Point: 105,500
🎯 Target Levels:
1️⃣ First Target – 104,000
2️⃣ Second Target – 103,000
3️⃣ Third Target – 102,000
4️⃣ Final Target – 100,000
🛡️ Risk Management is Key
🔒 Always set your stop-loss
⚠️ Trade only what you can afford to lose
💰 Risk-to-reward ratio must align
🔍 Stick to your trading plan
🧠 Stay disciplined
📊 Monitor the price action
🔁 Adjust targets as needed
📉 Trend is your friend
⏳ Patience pays
📅 Short-term trade idea
📌 Not financial advice – do your own research
📈 Good luck and stay safe!

BITCOIN here we go today it went passed my POI but took out previous high, so now selling from top to bottom, again over all price was in accumulation them price broke to bottom side then turned around and went sky rocketing up. nw retesting and now dropping
$BTC Extremely Bullish Daily Close - Parabola Underway?Hawt diggity dayumm 🥵
CRYPTOCAP:BTC really going for it following my original idea behind the parabola formation 🤯
Reclaiming ATH high at $112k will confirm the move 🤞
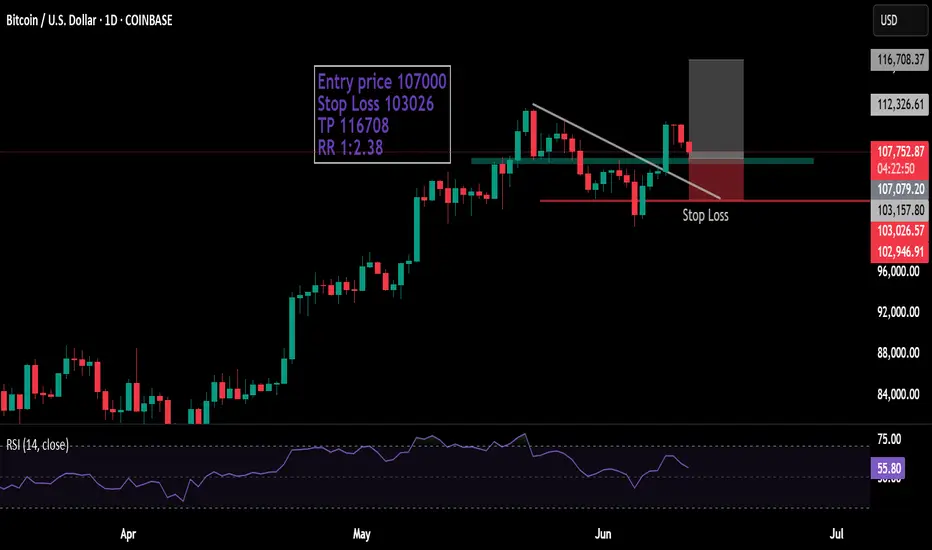
BTCUSDtrend is super Bulish
break trendline and retest
Entry price 107000
Stop Loss 103026
TP 116708
RR 1:2.38
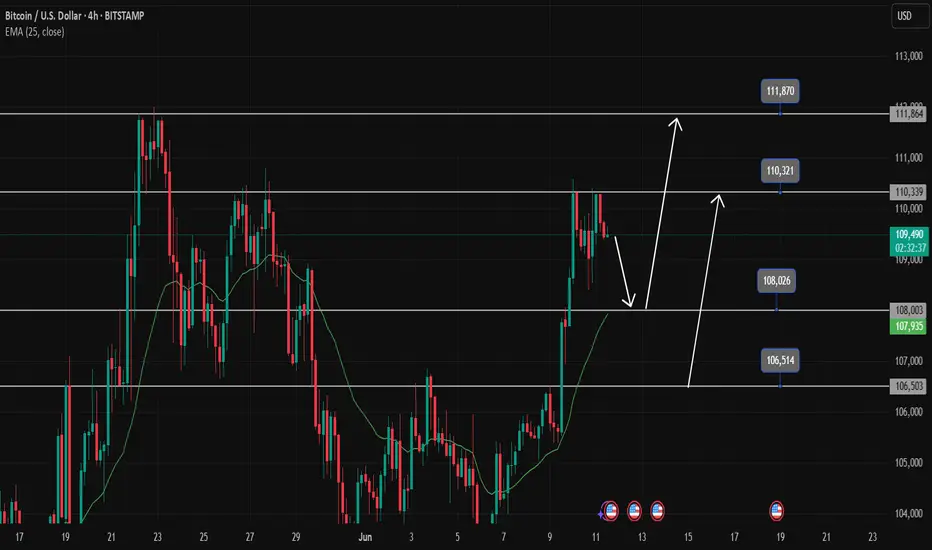
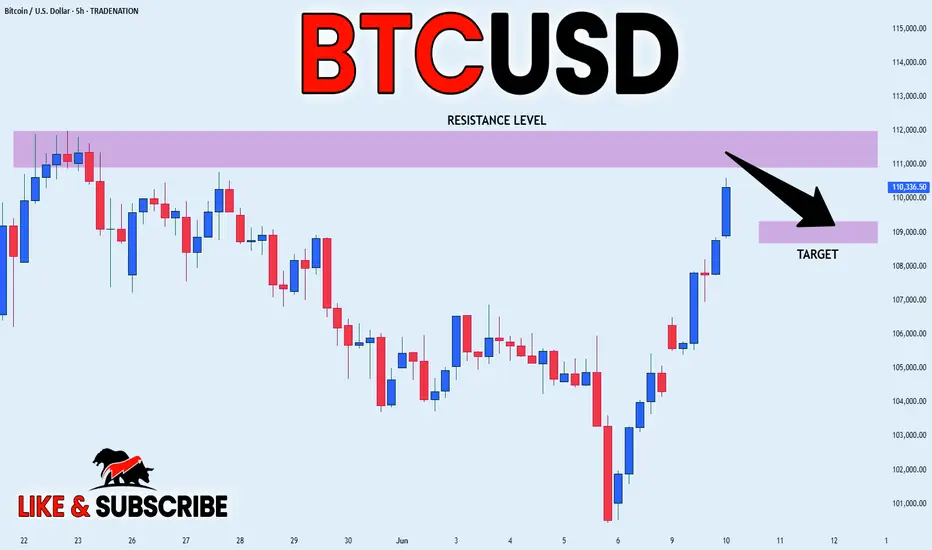
BITCOIN LOCALLY OVERBOUGHT|SHORT|
✅BITCOIN will soon retest a
Key resistance level of 112,000$
Which is an all-time-high
And the coin is locally overbought
So I think that the price will make a pullback
And go down to retest the demand level below at 109,000$
SHORT🔥
✅Like and subscribe to never miss a new idea!✅
Disclosure: I am part of Trade Nation's Influencer program and receive a monthly fee for using their TradingView charts in my analysis.
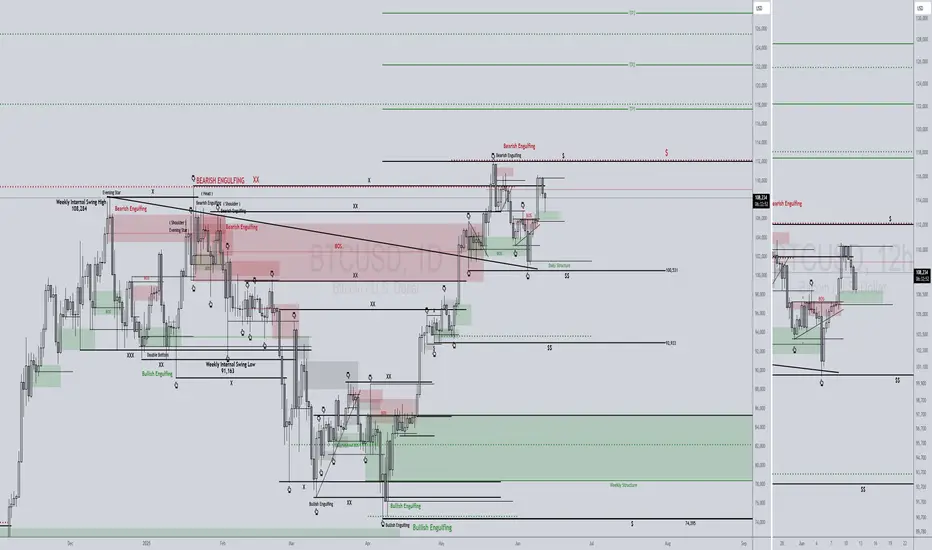
BTCUSD 6/12/2025UP UP & AWAY!!!! Get ready for this beautiful continuation!!!!
_SnipeGoat_
_TheeCandleReadingGURU_
#PriceAction #MarketStructure #TechnicalAnalysis #Bearish #Bullish #Bitcoin #Crypto #BTCUSD #Forex #NakedChartReader #ZEROindicators #PreciseLevels #ProperTiming #PerfectDirection #ScalpingTrader #IntradayTrader #DayTrader #SwingTrader #PositionalTrader #HighLevelTrader #MambaMentality #GodMode #UltraInstinct #TheeBibleStrategy
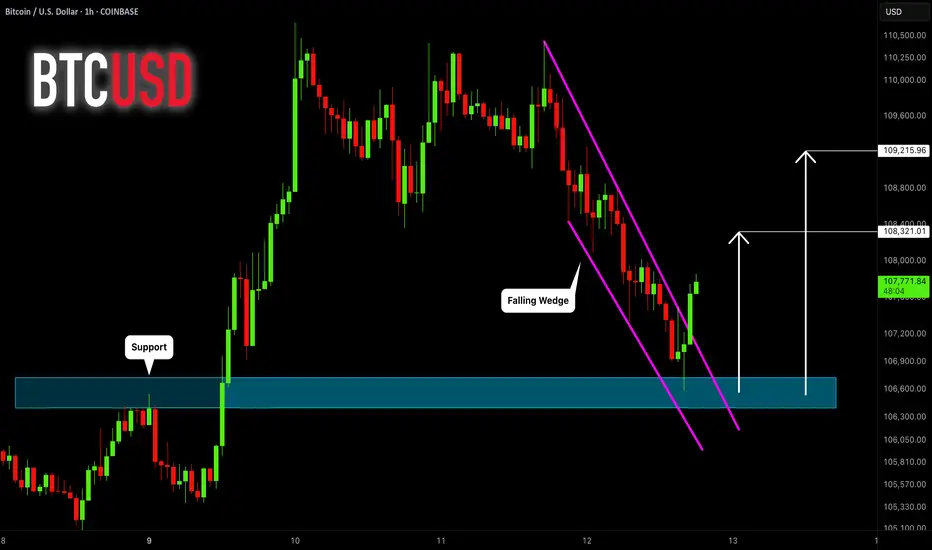
BITCOIN (BTCUSD): Pullback From Support
Bitcoin nicely respected a key horizontal support.
A breakout of a resistance line of a falling wedge pattern
provides a strong bullish confirmation.
I think that the price will go up and reach at least 108.320 level.
❤️Please, support my work with like, thank you!❤️
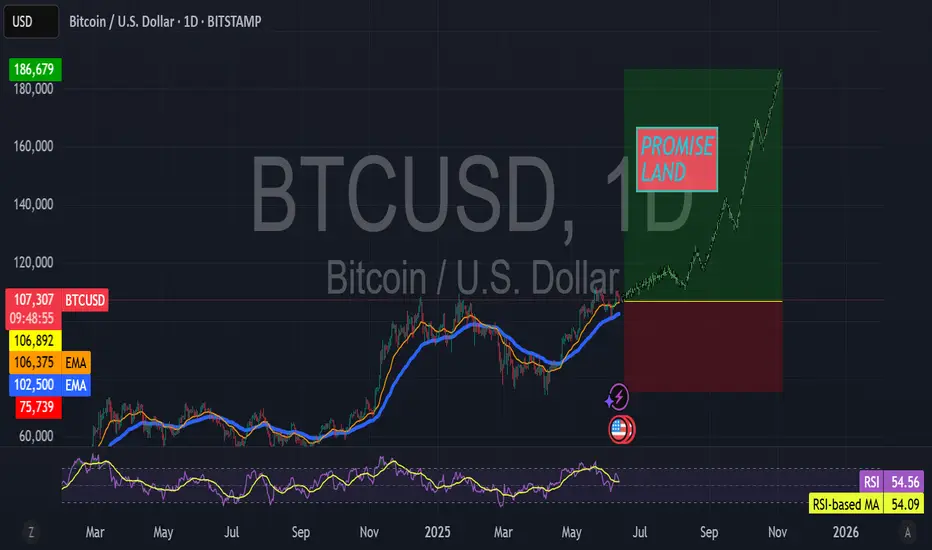
BTCUSDOKAY DEGENS
BTC is on a growth cycle not an innovation cycle which means slower growth, extended top, hypercycle on the backside and no double top BS like last time. The market will act like it did in 2017 going parabolic in LATE OCT/EARLY NOV. My low end target is 140k but it works on a time fractal for a November exit, so if we ain't at 140k by AUG that will probably be the top in NOV. So readjust, but I am a degen so I will shoot for 180k unlike the tards going for 240k thinking this is 2017 expect 1000% gains, we are at the top of the stock to flow model... This means adoption is slower and at the price action we are at now it is more difficult to "make number go up." Muhammad can't through a 60$ 100x trade anymore on swaps to push the price. Imagine that 240k for fake internet money, WILD, anyway don't make your greed translate into stupidity. Trust me I know, alright then... going to hang out with my second ex-wife's boyfriend Tyrone, see ya fellas.
I would be happy to share my thoughts on growth models vs innovation models in the BTC market.
"Where are my kids?"
-KewlKat
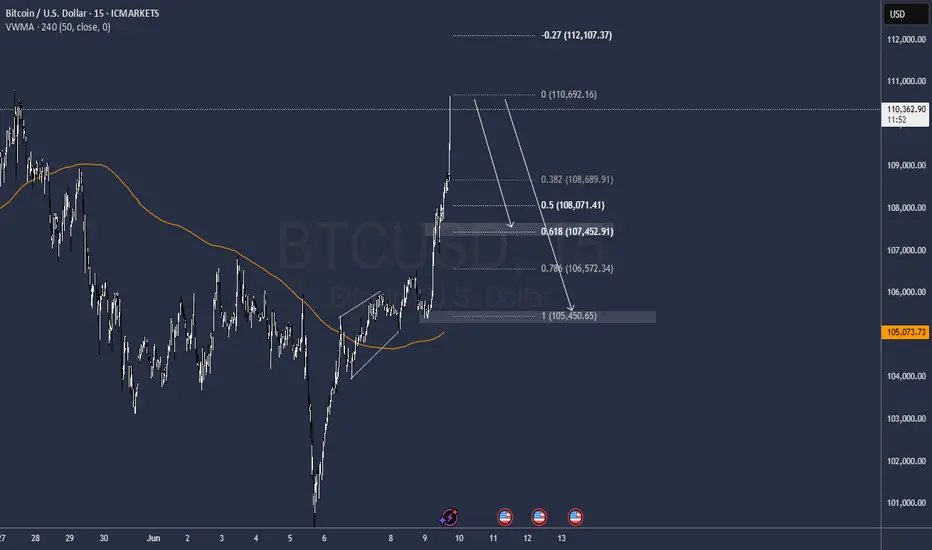
BTCUSD: Short-Term Range Trading as Bulls and Bears StalemateOn the weekly timeframe, prices retreated under pressure after hitting a high of 112,000, forming consecutive bearish candles. Despite this, prices remain at elevated levels, intensifying overall market volatility. Prior to Friday, the daily chart showed a sideways-downward trend, but yesterday’s data-driven rally appeared to disrupt this pattern, creating conflicting signals. Technical indicators on the 4-hour and hourly charts are shifting rapidly, with no clear signals for medium-to-long-term trends.
The current trend is likely to remain range-bound, with resistance at 107,000 and support at 101,000.
BTC/USD
sell@106000-107000
tp:102000-101000
I am committed to sharing trading signals every day. Among them, real-time signals will be flexibly pushed according to market dynamics. All the signals sent out last week accurately matched the market trends, helping numerous traders achieve substantial profits. Regardless of your previous investment performance, I believe that with the support of my professional strategies and timely signals, I will surely be able to assist you in breaking through investment bottlenecks and achieving new breakthroughs in the trading field.

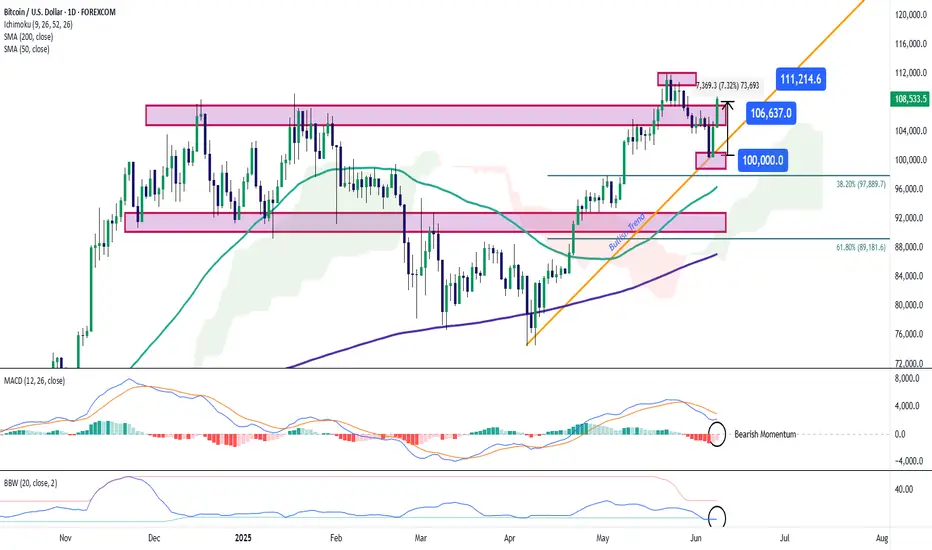
Bitcoin Approaches the $110,000 Zone Once AgainBitcoin has seen a strong bullish surge in recent trading sessions, climbing more than 7% and now trading back above $108,000 per BTC. The buying bias has been consistently fueled by the announcement from Metaplanet, which plans to raise over $5 billion to acquire Bitcoin — a move that has temporarily restored short-term confidence in the market. As euphoria continues to build in the short term, buying pressure may become increasingly relevant in the upcoming trading sessions.
New Uptrend Line Forming
Following recent upward movements, a new bullish rebound has formed on the chart, initiating a consistent uptrend as price action nears historical highs once again. If buying pressure remains stable, this emerging trendline could gain greater relevance in the short term.
MACD
The MACD histogram continues to oscillate below the neutral 0 line, which suggests that the primary market momentum still lies in bearish territory. If the histogram keeps showing lower values, the previously dormant selling pressure could begin to regain strength.
Bollinger Bands Width
The line measuring the width of the Bollinger Bands remains at low levels, indicating a steady decline in long-term average volatility. If this behavior persists, it could signal the beginning of a consolidation phase in Bitcoin’s price during the next few sessions.
Key Levels to Watch:
$111,000 per BTC: Previous all-time high zone. A breakout above this level could strongly reactivate the bullish bias and open the door to a more aggressive uptrend in the short term.
$106,000 per BTC: Nearby support that may serve as a buffer against potential selling corrections in the sessions ahead.
$100,000 per BTC: A key psychological support level, aligned with recent local lows. Price action falling below this level could put the current bullish formation at risk.
Written by Julian Pineda, CFA – Market Analyst
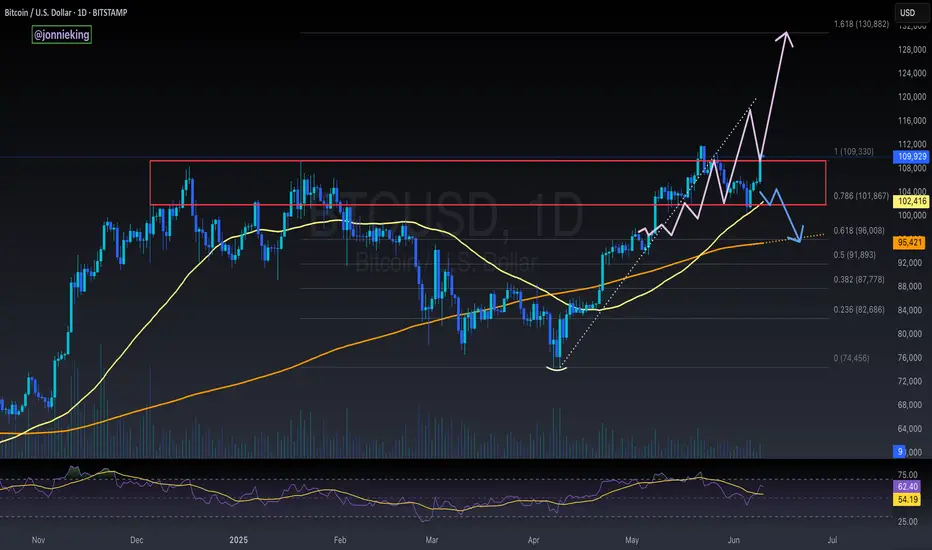
BTC CONSOLIDATESBitcoin may be forming a *lower high* on the daily chart, with the most recent rally stalling at \$110,000 – just below the previous high near \$112,000. That failure to reclaim the prior high is an early sign of weakening momentum and suggests the strong uptrend that’s been in place since April might be losing steam.
The critical level now is \$100,000. That’s the most recent swing low, and it serves as the key structural support in this current move. A daily close below that level would confirm a *lower high–lower low* sequence, shifting the short-term trend from bullish to neutral or even bearish. If that happens, downside targets open up around \$97,000 – the next clear support – followed by \$95,500, where the rising 200-day moving average now sits.
Momentum indicators support this caution. RSI is trending down and making lower highs, showing a loss of bullish strength. Volume has also declined during recent rallies, hinting at buyer exhaustion rather than healthy consolidation.
For the bulls to retain control, the 50-day moving average near \$103,000 needs to hold. If that level fails, a test of \$100,000 is likely. On the flip side, a strong move back above \$110,000 would invalidate the lower high setup and put the breakout narrative back in play.
Right now, the market is at a decision point. The trend hasn’t broken yet, but structure is starting to crack. A confirmed lower high at \$110,000 – followed by a break below \$100,000 – would mark the first significant trend shift on the daily chart in months.

BTC is reviving for a new bull runBTCUSD is correcting to 108000 as it hits the sell zone at 101200. At 108000 it is quite clear to set up BUY signals. Another area to watch for BUY is 106500. BUY SL points are not above 700 price for BTC. Currently the uptrend is still going to continue so any pullback to support is considered a buying opportunity.