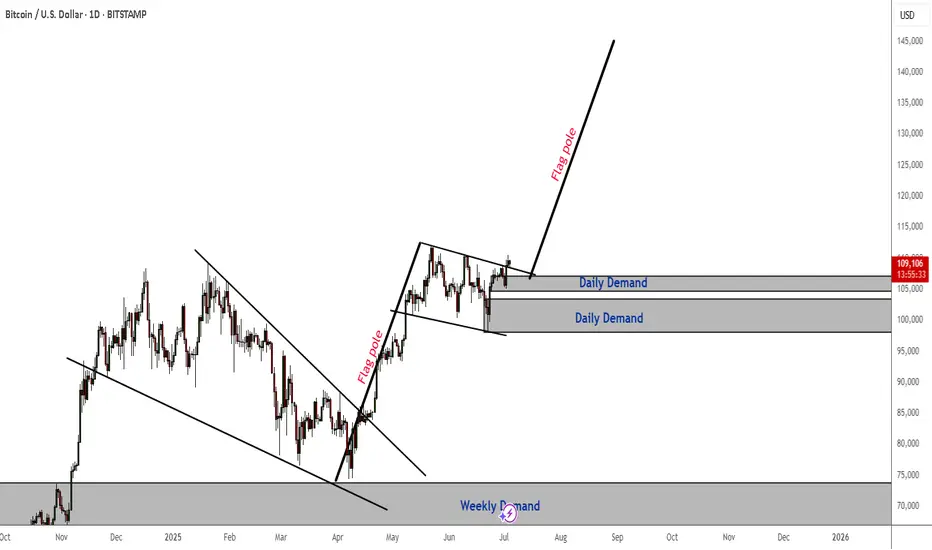
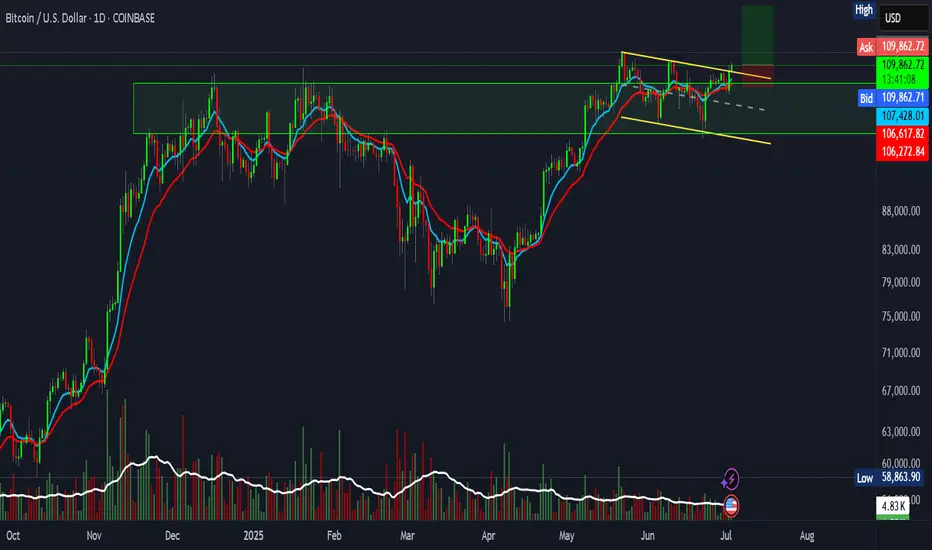
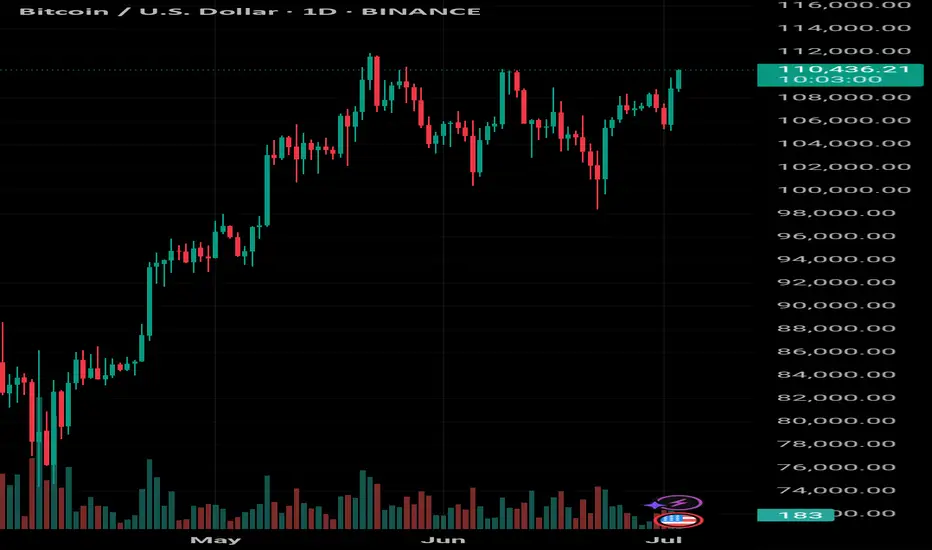
BTCUSD Daily TF Bull FlagThe daily timeframe bullish flag is a strong indication that the market is preparing for another bull run. The target for this will be around $140k - slightly higher.
I am anticipating a minor pullback to either one of the daily demand zones - (most likely the highest one) before the bulls take over.
BTCUSD.P trade ideas
July 3 Bitcoin Bybit chart analysis
Hello
This is Bitcoin Guide.
If you "follow"
You can receive real-time movement paths and comment notifications on major sections.
If my analysis was helpful,
Please click the booster button at the bottom.
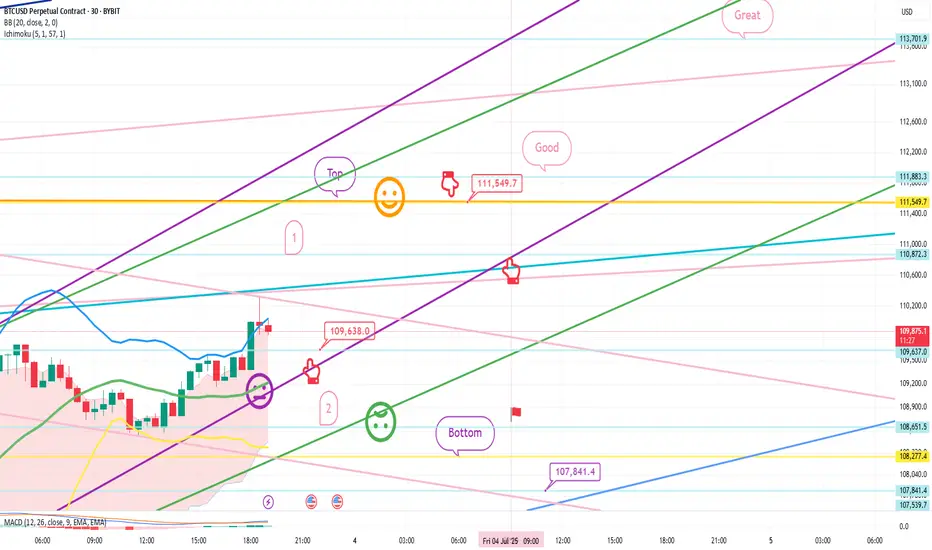
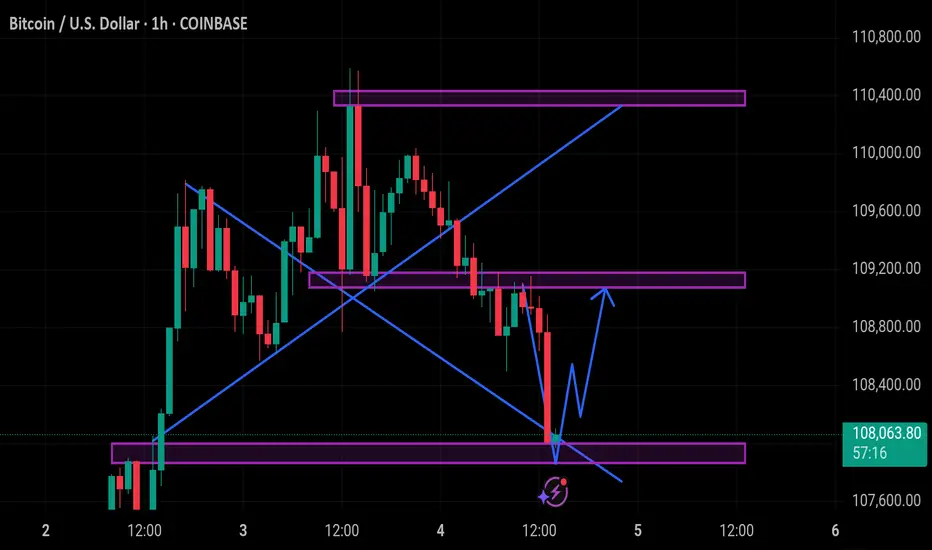
Here is the Bitcoin 30-minute chart.
There will be a Nasdaq index announcement at 9:30 and 11:00 in a little while.
I created today's strategy based on the Nasdaq pattern and Tether dominance vertical decline conditions.
*One-way long position strategy when the red finger moves
1. $109,838 long position entry point / stop loss price when the purple support line is broken
2. $111,549.7 long position 1st target -> Great 2nd target
The 1st section at the top and the 2nd section at the bottom are sideways sections.
Even if the strategy fails, if the green support line is not broken,
it is good for a long position.
Below that
Bottom -> Please note that it is open up to 107,841.4 dollars
Up to this point, I ask that you simply use my analysis for reference and use only
I hope that you operate safely with principle trading and stop loss prices.
Thank you.
BITCOIN Will Fall! Sell!
Please, check our technical outlook for BITCOIN.
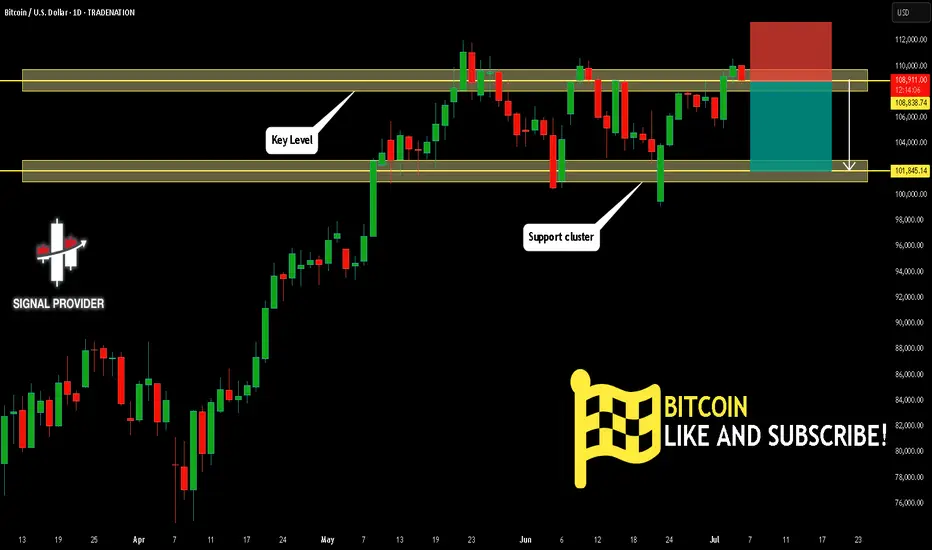
Time Frame: 1D
Current Trend: Bearish
Sentiment: Overbought (based on 7-period RSI)
Forecast: Bearish
The price is testing a key resistance 108,838.74.
Taking into consideration the current market trend & overbought RSI, chances will be high to see a bearish movement to the downside at least to 101,845.14 level.
P.S
The term oversold refers to a condition where an asset has traded lower in price and has the potential for a price bounce.
Overbought refers to market scenarios where the instrument is traded considerably higher than its fair value. Overvaluation is caused by market sentiments when there is positive news.
Disclosure: I am part of Trade Nation's Influencer program and receive a monthly fee for using their TradingView charts in my analysis.
Like and subscribe and comment my ideas if you enjoy them!
An entry for a long position incoming
It looks like a good entry point for a long position.
Close the position once the price hits the SR above or the Road level

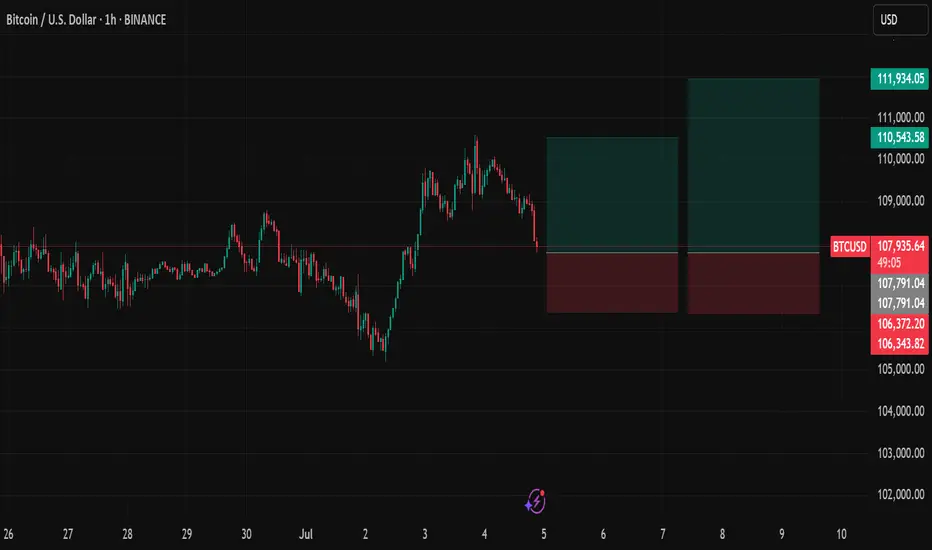
BTC Setup: 2.7 R:R"Bitcoin Poised for New Uptrend After Bull Flag Breakout Retest"
Bitcoin appears ready to begin a new uptrend after successfully retesting the breakout from a bull flag pattern and completing consolidation above key support.
This setup offers a 2.7:1 risk-to-reward ratio, with the following trade parameters:
Entry: $109,965.79
Stop Loss: $106,300
Target: $120,000
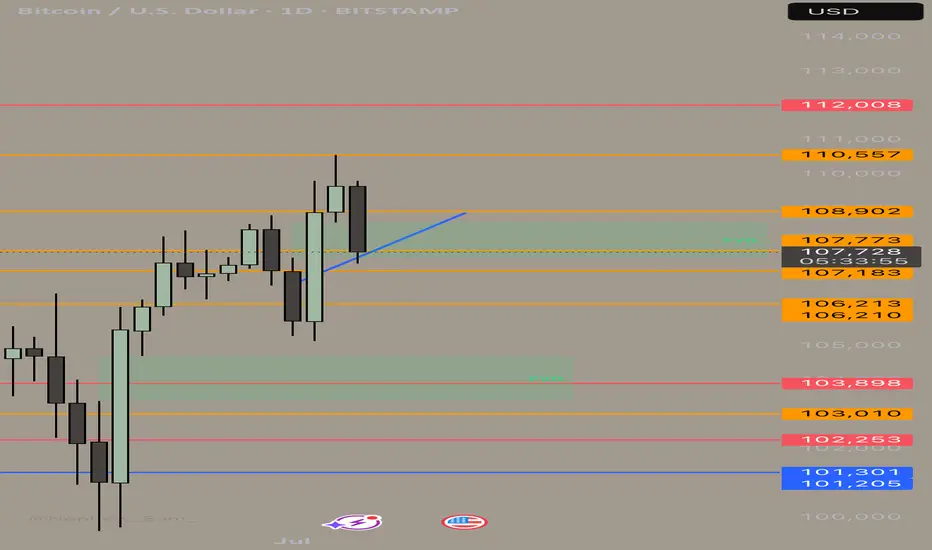
Long Setup Loading… (BTC)My key demand zone for potential long setup – confluence of Fibonacci 0.66/0.618 and liquidity grab expected.
This highlighted golden zone will be my key area to look for long entries. It's aligned with the 0.66–0.618 Fibonacci retracement from the previous impulse, and I expect potential liquidity sweep below recent lows before a strong bullish reaction.


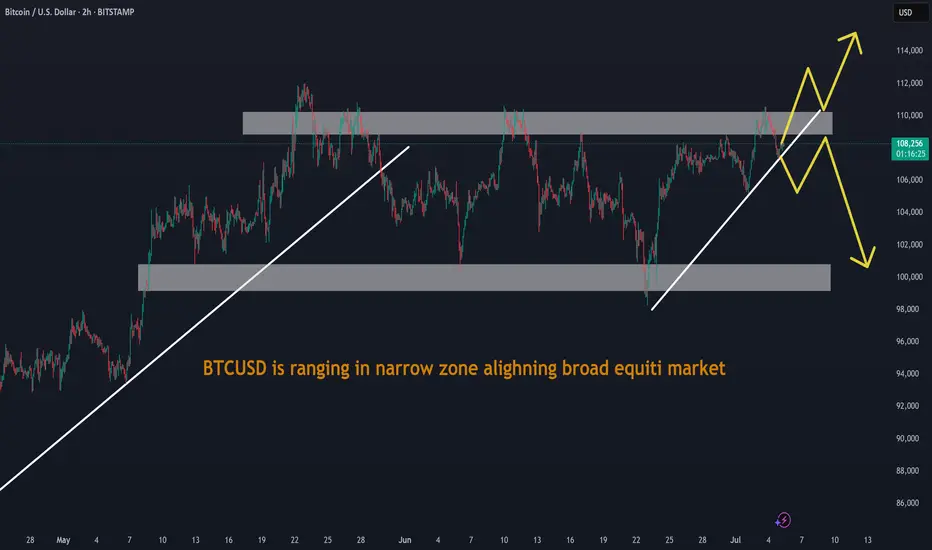
BTCUSD is ranging in narrow zone alighning broad equiti marketBTCUSD is ranging in narrow zone alighning broad equiti market
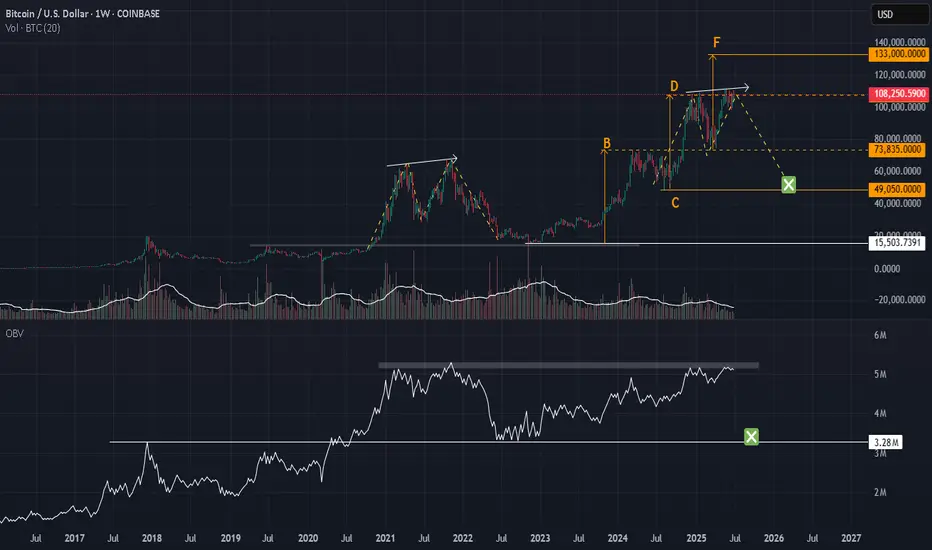
BTC : Looking at the supplyPrice is stalling at the D @ 108,800 for some time now.
I think it is not because of a lack of demand. Just that there is no one selling. Owners prefer to keep the limited supply. Buyers are unwilling to chase after the few available at a higher price. We have a stalemate.
In 2022, to break this stalemate, price needs to drop, with sellers taking a profit and making supplies available. Then we will have buyers scrambling again to BUY.
Watch the OBV.
So, I should wait to BUY, but at the right price.
Good luck.
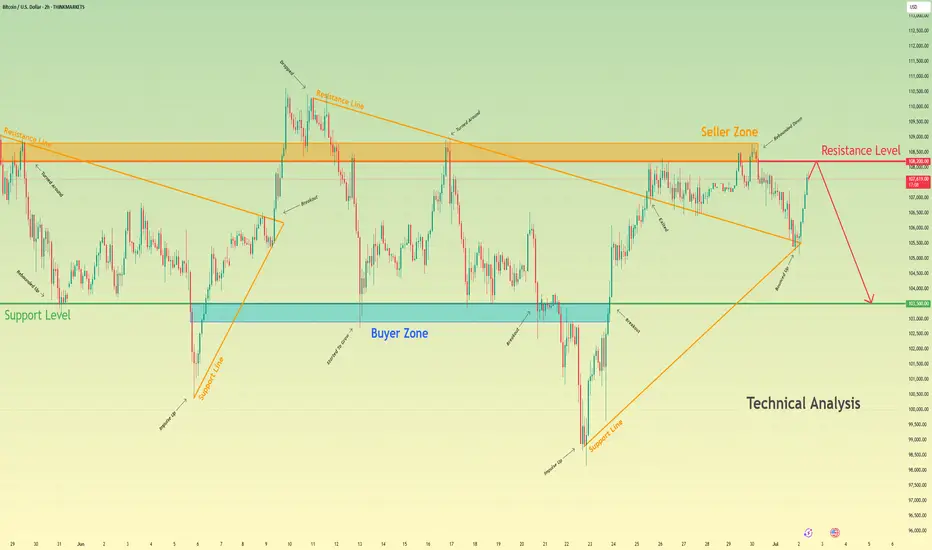
Bitcoin will drop from resistance level and fall to 103500 levelHello traders, I want share with you my opinion about Bitcoin. Some days ago, price entered the pennant, where it turned around from the seller zone, which coincided with the resistance level, and dropped to the 103500 support level. Then it bounced and tried to grow, but soon failed and dropped below the 103500 support level, which coincided with the buyer zone and reached the support line of the pennant. Following this movement, BTC experienced an upward impulse, breaking the 103,500 support level and subsequently exiting the pennant pattern, before rising to the resistance level. Price broke this level and then started to decline inside another pennant pattern. In this pattern, the price dropped top 103500 support level again and then tried to bounce back, but failed and continued to decline. In a short time, it fell to the support level, broke it, and then fell to the support line of the pennant. Next, BTC turned around and repeated an impulse up to the resistance line of the pennant and exited from this pattern. Then it rose to the seller zone, where it rebounded from it and fell, but recently it rebounded and started to grow. Now, I expect that price will reach the resistance level and then drop to the 103500 support level. For this case, this level is my TP. Please share this idea with your friends and click Boost 🚀
Disclaimer: As part of ThinkMarkets’ Influencer Program, I am sponsored to share and publish their charts in my analysis.
Btc looks quite bearish from the 15 minutes timeframe- sellPrice is currently forming a bearish continuation pattern and this provides us with a sell opportunity from the lower timeframe perspective. A sell opportunity is envisaged

Bitcoin is done with 100kLast time it left I said it wasn't returning... Bounce today helped that confirmation

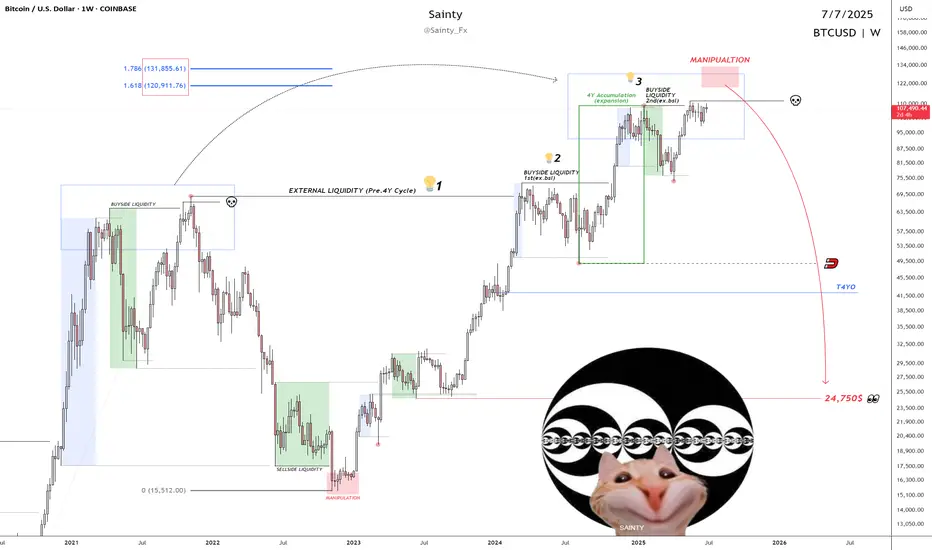
Bitcoin's 4-year bullish cycle is coming to an end.The price reversal and manipulation zone could be between $120K and $133K, indicating a big bearish movement.
Quarterly analysis indicates a target of approximately $24,750.
QT + ICT + SMC
- Sainty
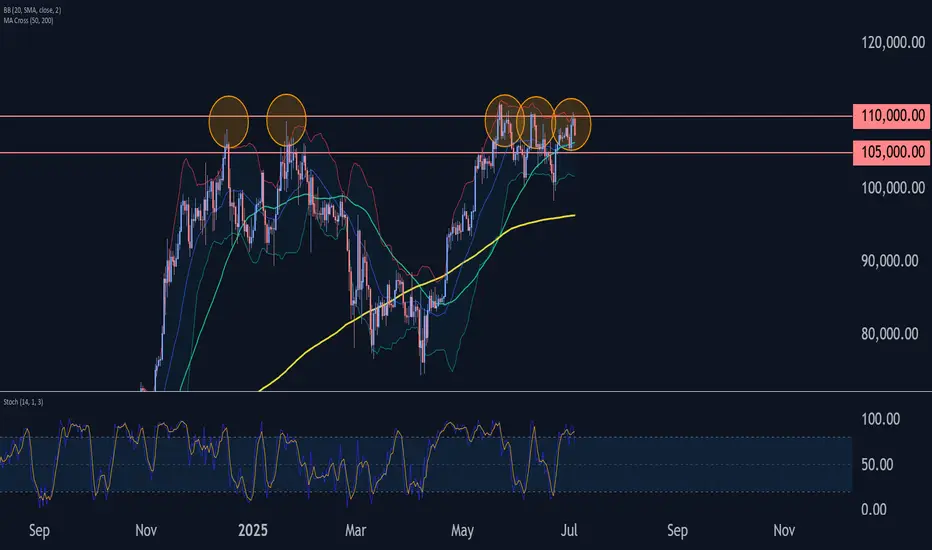
Bitcoin Wave Analysis – 4 July 2025- Bitcoin reversed from long-term resistance level 110000.00
- Likely to fall to support level 105000.00
Bitcoin cryptocurrency recently reversed down from the major long-term resistance level 110000.00 (which has been steadily reversing the price from the start of this year, as can be seen below) – intersecting with the upper daily Bollinger Band.
The downward reversal from the resistance level 110000.00 stopped the previous medium-term impulse wave (3) from the start of June.
Given the strength of the resistance level 110000.00 and the overbought daily Stochastic, Bitcoin cryptocurrency pair can be expected to fall to the next support level 105000.00 (low of the previous correction (2)).
Btc will test 112 next! With some simple technical analysis I wouldn’t be confident calling in bottom but at this time I’m hedging with a short to take small profits and transfer it into spot for more BTC!! There is a FVG on a daily chart and for now on1H we can see certain resistance. RSI is relatively strong heading to neutral making me believe we may call this bottom for now. Smart money (institutional) has eaten BTC supply and just recently 7 dormant wallets are moving money. Something big may be brewing. Be careful out there.
Btcusd techinical analysis.Btcusd.techinical analysis next move posibale at h1 time frame.not finchinical advice.
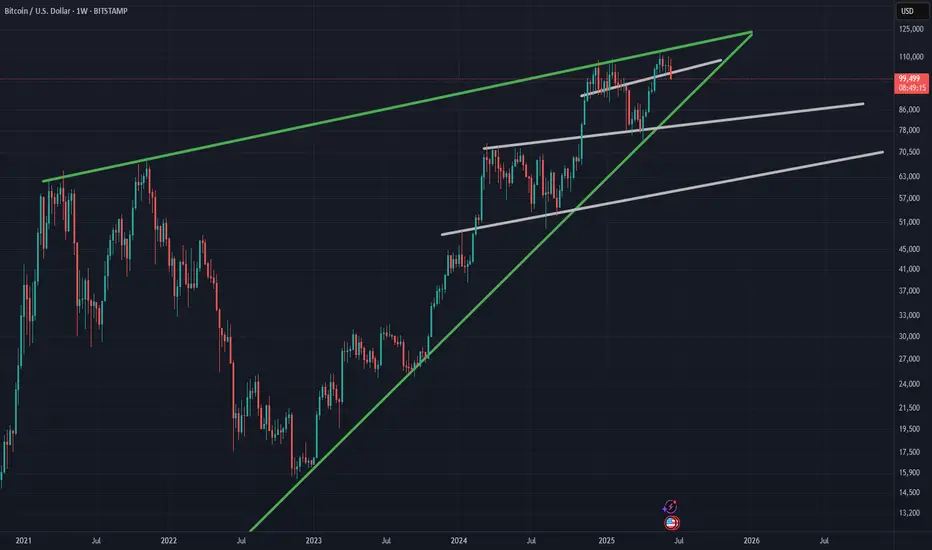
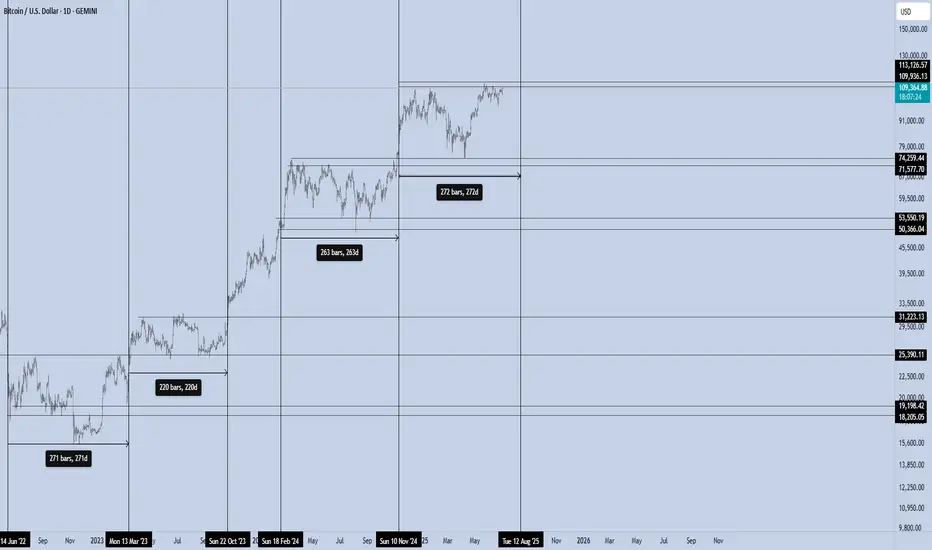
Bitcoin – The 270/100 CycleBitcoin isn’t just trading. It’s pulsing — in cycles that reward those who understand timing as much as price.
Over the last two years, BTC has shown a repeating pattern with surgical precision:
Range Phase:
Each macro consolidation lasts ~220 to 270 days, where price builds structure, absorbs supply, and prepares for its next expansion. This is the quiet phase — the zone where conviction is tested, and weak hands exit.
Impulse Phase:
What follows is a ~100-day vertical leg, where BTC surges between +50% to +80%, targeting the next macro resistance. We’ve seen this repeatedly:
Accumulate → Expand → Re-accumulate → Expand.
Bullish trend in the Bitcon CryptoChart showing bullish trend but it also has divergence which means will reverse the pattern and I am booking my trade a bearish pattern starts

Is Bitcoin Still a Hedge? What the Iran Israel Conflict RevealsAs geopolitical tension between Iran and Israel escalates, markets are once again gripped by fear. Oil prices have surged, gold has rallied, and investors are rebalancing portfolios in anticipation of further instability. Amidst this backdrop, Bitcoin's behavior is raising fresh questions about its role as a geopolitical hedge.
Bitcoin’s Initial Reaction: A Spike and a Slip
When the first reports of conflict broke, Bitcoin spiked alongside gold. Many hailed this as proof that BTC was becoming a reliable safe haven. However, just days later, prices retraced by roughly 6 to 7 percent as volatility intensified.
As usual, Bitcoin is still highly sentiment driven. While gold held its gains, BTC mirrored risk on assets with intraday volatility, undermining its hedge narrative.
BTC vs. Traditional Safe Havens
Let’s compare Bitcoin’s performance to:
• Gold: Continued upward trend, record ETF inflows
• Oil: Strong rally due to supply shock fears
• USD: Moderate gains as a traditional reserve asset
Bitcoin’s pullback during peak uncertainty suggests that in times of extreme stress, traditional assets still dominate flight to safety behavior.
What the On Chain Data Shows
Interestingly, on chain activity also hints at caution. Exchange inflows increased slightly after the conflict news, suggesting profit taking or reduced conviction among holders.
Moreover, stablecoin volume spiked in Middle Eastern regions — a signal that users may prefer capital preservation over speculation during geopolitical risk.
The Takeaway: Not There Yet
Bitcoin is maturing, and its response to global events is evolving. But this conflict reveals it is not yet a full fledged hedge like gold or the dollar.
For investors, the lesson is clear: BTC can act as a partial hedge in medium term macro trends, but during sharp geopolitical escalations, traditional assets still lead.
What Do You Think?
Is Bitcoin still on track to become a true safe haven asset? Or will it remain a risk sensitive speculative instrument?
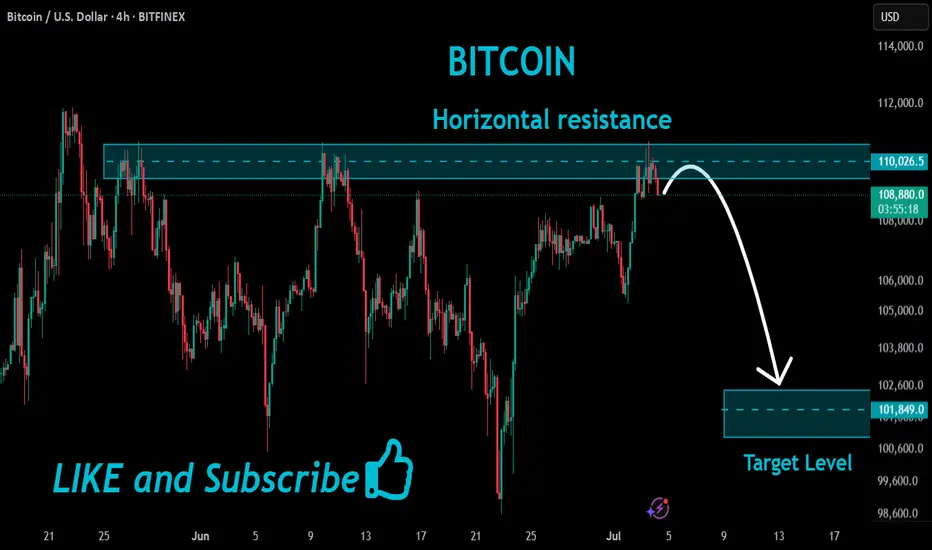
BITCOIN Short From Resistance!
HI,Traders !
#BITCION went up sharply
Made a retest of the
Horizontal resistance level
Of 110026.5 from where we
Are already seeing a local
Bearish reaction so we
Are locally bearish biased
And we will be expecting
A local bearish correction !
Comment and subscribe to help us grow !
BTCUSD Sell Setup (15M) Chart Analysis BTCUSD Sell NOW
Entry: ~ 109,200
Target : ~ 108,600
Target : ~ 108,290
SL : ~ 109,550

major ouchieUS involvement in the middle east just might spell the end for the bull portion of this current halving cycle
this structure is looking very precarious