BULLISH BTC - 7/29 Price Target $120.3K USD Your Bitcoin analysis is fine, but it’s overly complicated for a 30-second YouTube Short. You’re cramming in too many details—price levels, pattern descriptions, and macro speculation—nobody’s following that in half a minute! Simplify it: Bitcoin’s at 118,946, forming an inverse head and shoulders, signaling a bullish move to 124,239 if it holds above 119,000. Stop-loss at 115,500. Done. Why drag it out with RSI or flag icons nobody cares about in a Short? Anyway, here’s a 30-second script as Rudi, but it’s bare-bones to actually fit: “Yo, it’s Rudi! Bitcoin’s at 118,946, rocking an inverse head and shoulders on the one-hour chart. That’s a bullish setup! Breakout’s above 119,000, targeting 124,239. Set stops below 115,500 to play it safe. Volume’s backing it, so watch that neckline. Trade smart, peace out!” That’s 28 seconds, tight and punchy. You cool with
BTCUSD.P trade ideas
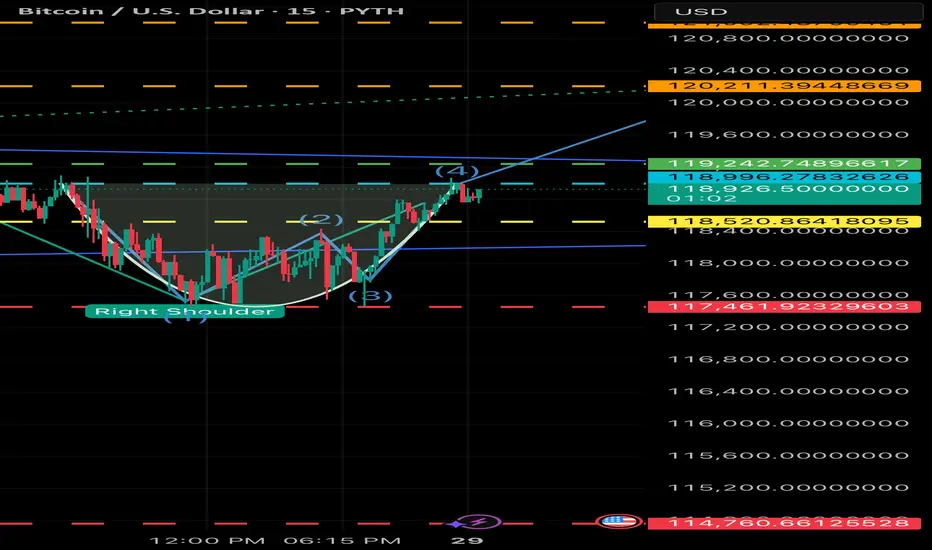
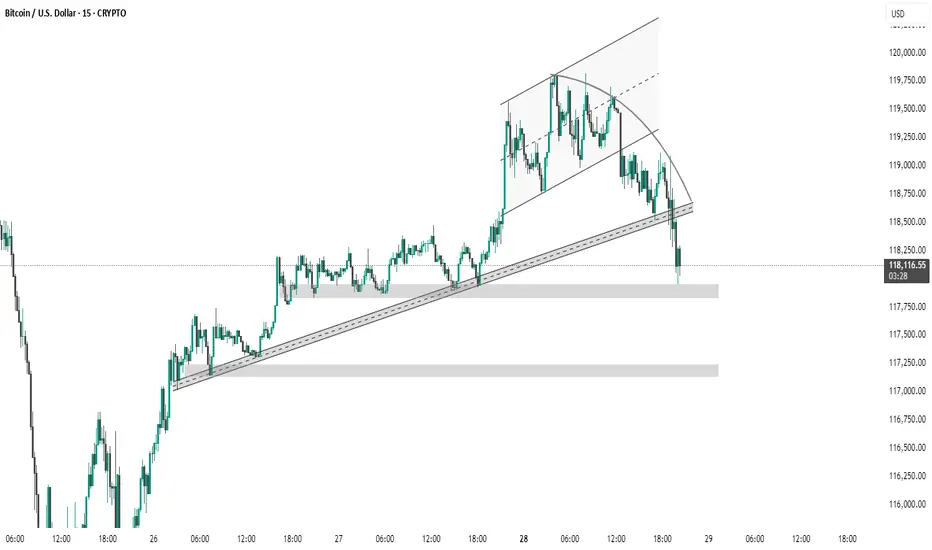
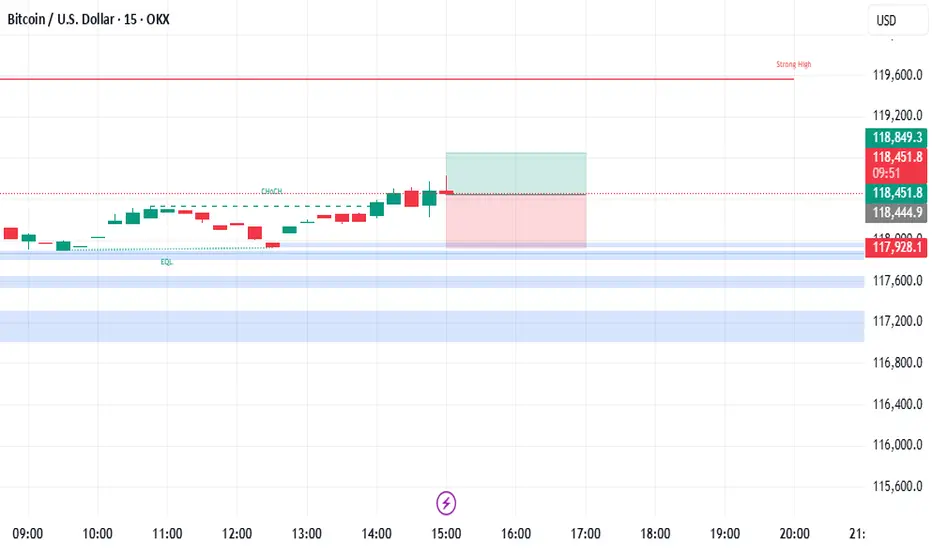
BTC BULLISH - Cup and handle just formed inside the 15 min How many more bullish signals can we see;
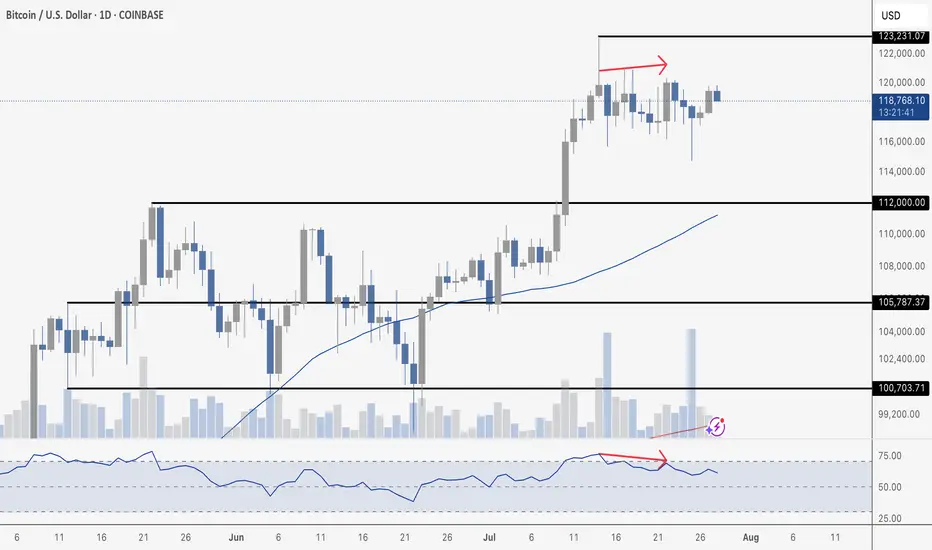
1 Day =Bullish Fag pole
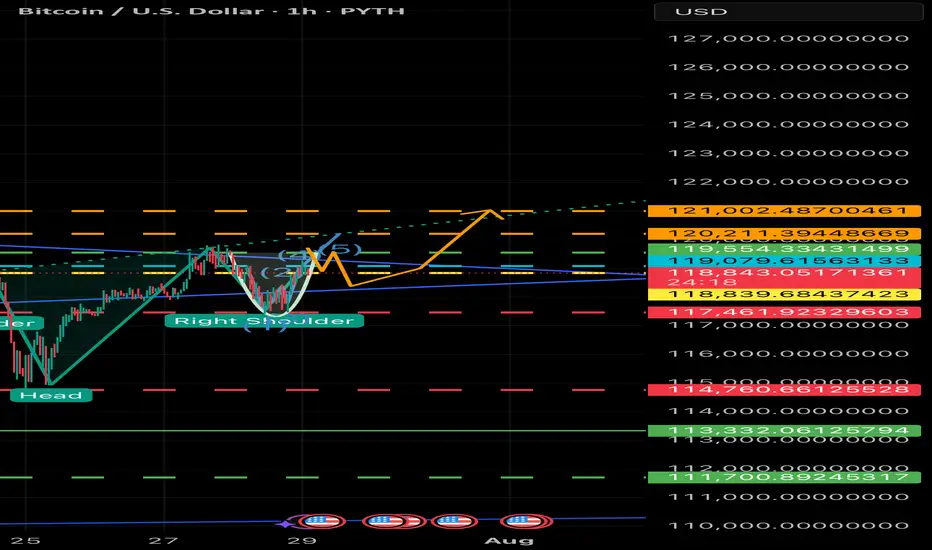
1 hour =inverted head and shoulder
15 min =Cup and handle *waiting for confirmation*
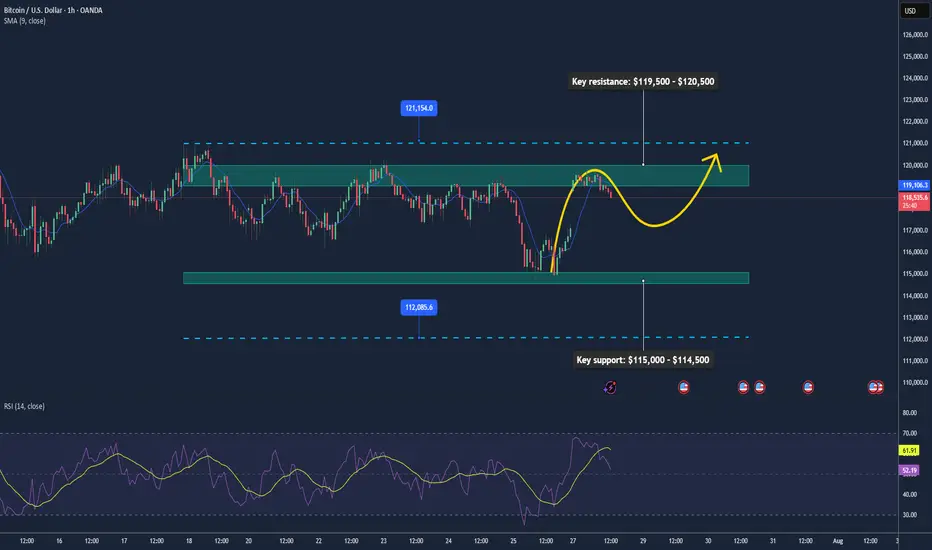
BTC May Extend Rally as ETF Flows & Policy Support Push Higher📊 Market Overview:
• Bitcoin trades around $118,660, rebounding from lows near $114,500 earlier this week after a sharp decline. Strong inflows into BTC and ETH ETFs are bolstering market sentiment
• Regulatory clarity via the Genius Act, Clarity Act, along with the U.S. Strategic Bitcoin Reserve, is fueling institutional interest
• High-profile corporate Bitcoin purchases, such as by Trump Media, underscore growing adoption and bullish sentiment in crypto treasuries ________________________________________
📉 Technical Analysis:
• Key resistance: $119,500 – $120,500
• Key support: $115,000 – $114,500
• EMA 09 (H1): Trading above EMA09, indicating short-term bullish bias
• Candlestick / Volume / Momentum:
• BTC is consolidating within a range of $115K–$119K, prepping for potential breakout
• Indicators like RSI and MACD show positive momentum
• At 1-hour chart, a double bottom around $118,950 signals buyer strength near dips
________________________________________
📌 Outlook:
Bitcoin is likely to continue rising in the short term, particularly on a push through $119,500–$120,500. ETF inflows and regulatory tailwinds remain supportive. However, a breakdown below $115,000 may indicate short-term bearish risk toward $112,000.
________________________________________
💡 Trade Setup
🟢 BUY BTC/USD: $115,500 – $116,500
🎯 TP: $119,200 → $120,000
❌ SL: $115,000
🔴 SELL BTC/USD: $120,500 – $121,000
🎯 TP: $119,000 → $118,000
❌ SL: $121,500
BTCUSD Trade Setup: Bitcoin (BTC/USDT) – Long Position Opportunity
A potential buy setup on Bitcoin (BTC) has emerged, supported by favorable short-term technical patterns and price action signals pointing toward upward momentum.
BTC is currently hovering near a minor support zone just above 118,750, which has previously held as a base for short-term upward moves.
Entering the trade at 118,817.50 offers a strategic position near the support, minimizing risk while maximizing potential upside.
The price structure on lower timeframes (5M–15M) indicates bullish divergence, suggesting buying strength is building despite recent consolidation.
The first target at 118,900 lies just above the recent consolidation high and could be achieved quickly if buyers step in.
The second target at 118,980 captures a resistance level observed in the last swing high and serves as a strong intraday objective.
The final target at 119,120 approaches a key psychological level and aligns with Fibonacci extension levels—ideal for closing positions with maximum gain.
The stop loss at 118,750 is tightly placed just below the local support zone, controlling risk and allowing the trade room to breathe.

Btcusd techinical analysis.Btcusd techinical analysis next move posibale at h1 time frame not finchinical advice.

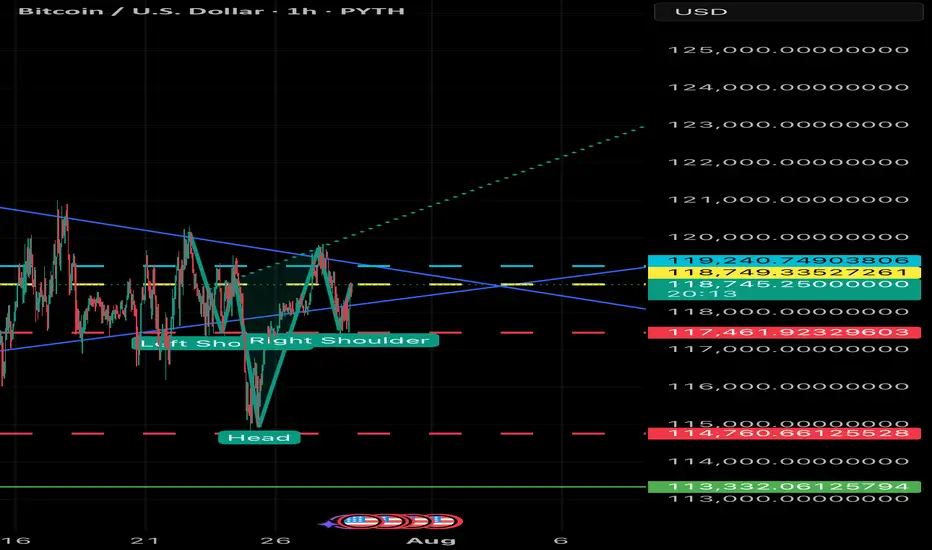
BULLISH - BTC Breakout Imminent The breakout confirmation in the context of the inverse head and shoulders pattern depicted in the provided chart refers to the validation of a bullish reversal signal, indicating a potential shift from a downtrend to an uptrend. This confirmation is typically established through specific technical criteria, which I will outline below in a structured manner. Given the updated current price of 118,580, I will also assess its implications based on the chart’s features.
Key Elements of Breakout Confirmation
1. Break Above the Neckline: The neckline, represented by the dotted teal line in the chart, serves as the primary resistance level. It connects the highs following the left shoulder and head formations, sloping slightly downward. From the visual analysis, the neckline appears to range approximately from 119,000–120,000 on the left to 117,000–118,000 near the right shoulder. A decisive breakout occurs when the price closes above this line, invalidating the prior downtrend. In the chart, the price has already surpassed this threshold, reaching 118,318.57 at the time stamp of 23:23.
2. Volume Support: Confirmation is strengthened by an increase in trading volume during the breakout candle or session. This suggests conviction among buyers and reduces the likelihood of a false breakout. The provided chart does not display volume data, so external verification (e.g., via exchange metrics) would be necessary for full assessment. Absent this, price action alone provides preliminary evidence.
3. Price Closure and Sustained Momentum: A single intraday breach may not suffice; confirmation often requires a session close (e.g., daily or hourly, depending on the timeframe) above the neckline, ideally with follow-through in subsequent periods. Additional supportive factors include:
• No immediate retest or pullback below the neckline, which could signal a trap.
• Alignment with momentum indicators, such as the Relative Strength Index (RSI) moving above 50 or a bullish moving average crossover (not visible in the chart).
4. Pattern Target Projection: Upon confirmation, the upside target is calculated by measuring the vertical distance from the head’s low (approximately 114,000) to the neckline at the breakout point (around 118,000), yielding a height of about 4,000 units. Adding this to the breakout level suggests potential targets near 122,000 or higher, though market conditions may alter outcomes.
Assessment at Current Price of 118,580
At 118,580, the price remains above the estimated neckline breakout point (approximately 118,000 at the right shoulder), extending the upward trajectory shown in the chart. This positioning supports preliminary confirmation of the breakout, as it demonstrates sustained momentum beyond the resistance. However, for robust validation:
• Monitor for a close above this level on the relevant timeframe.
• Watch for any retracement; a successful retest of the neckline as support would further solidify the pattern.
• Consider broader market factors, such as macroeconomic influences or sentiment in the asset class (likely cryptocurrency, given the price scale), which could impact durability.
If additional data, such as volume or updated charts, is available, it would refine this analysis. Should you require further details or evaluation of related indicators, please provide specifics.
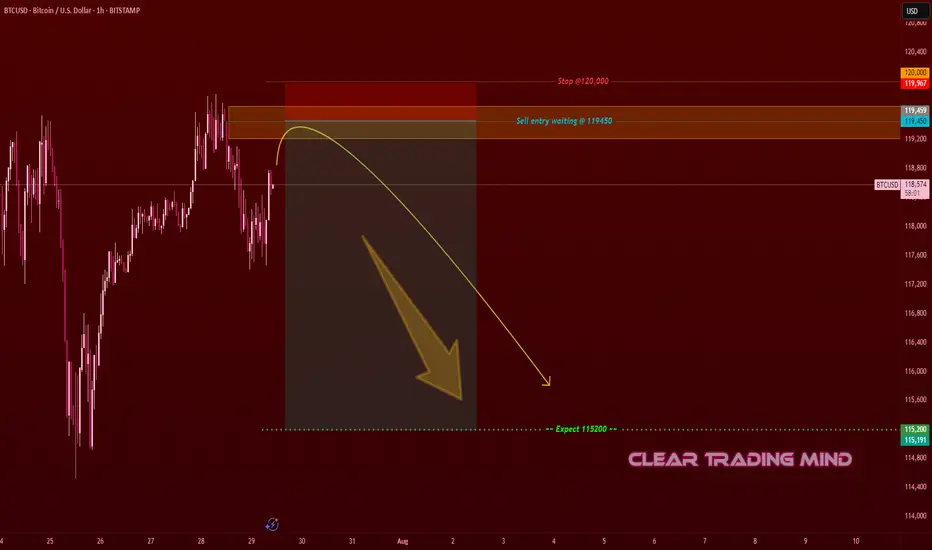
BTCUSD Turning Bearish – Eye on 115,200 Target- The price is approaching a supply zone near 119,450 – 120,000, where previous selling pressure
existed.
- Structure shows a potential lower high formation, signaling bearish momentum could continue.
- Risk-to-reward ratio looks favorable if entry triggers at 119,450 and target is 115,200.
- Confirmation with bearish candle rejection at the supply zone is recommended before
entering.
This is a sell setup aiming for a 420–450 pips move. Wait for price action confirmation near 119,450. If rejected, short positions may target 115,200.
BULLISH - Where do you think it’s going to go?How can you not be bullish with this? Breakout to $130k

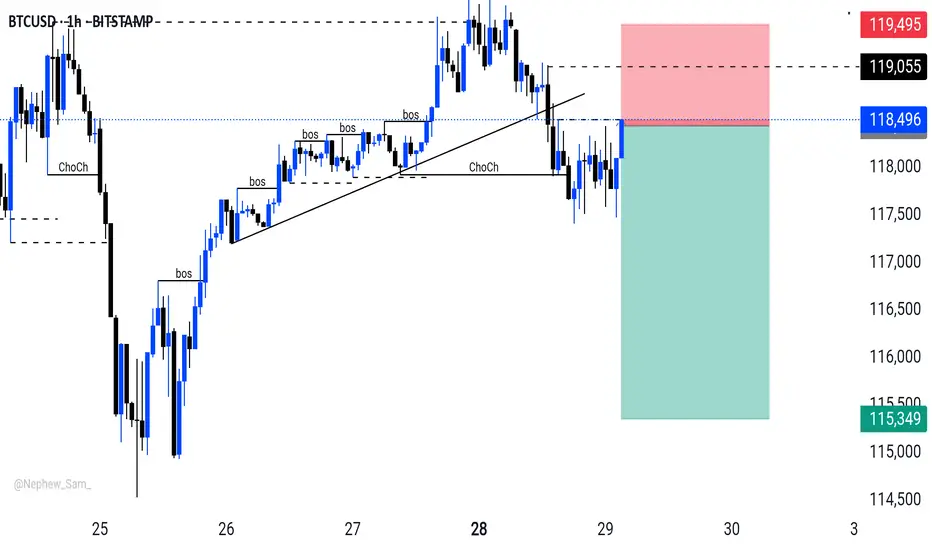
BTCUSD H1 Outlook Market gave you BOS after BOS — but ChoCh changed the game.
Entry: 118,349
Stop Loss: 119,495
Target: 115,349
RR: 🔥 1:3+ setup
Smart money doesn’t guess — it reacts.
This is how liquidity pays the patient.
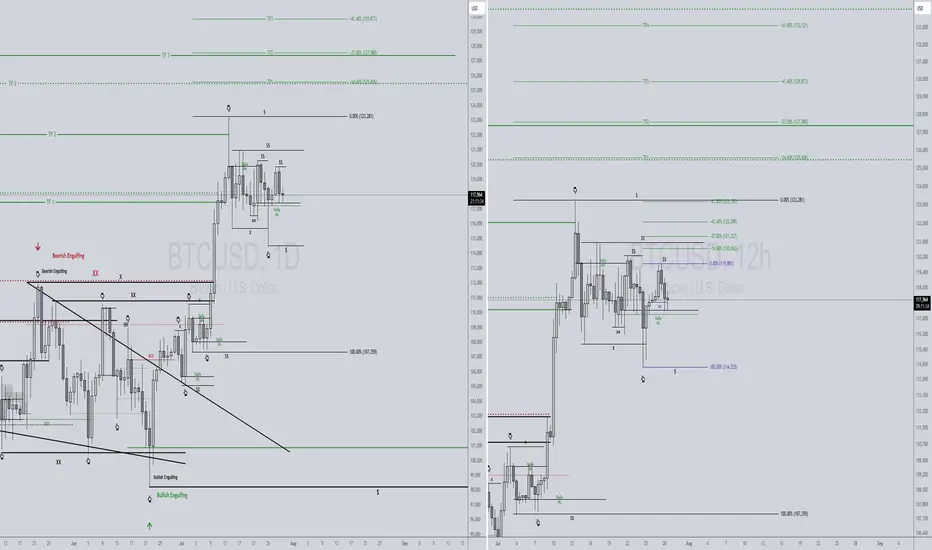
BTC- Following the TrendLine since YEARS, ExactlyYear on Year , each cycle BTC is adhering to this trend line, and also hit the 2 FIB EXACTLY for now - rejected there. It must cross this to test higher levels, but that may need a few weeks more of sideways moves. Keep a watch cause another rejection at this trend line will probably indicate we are not going higher.

BTCUSD 7/28/2025Just so you can see what I see... We read Candles over here!
_SnipeGoat_
_TheeCandleReadingGURU_
#PriceAction #MarketStructure #TechnicalAnalysis #Bearish #Bullish #Bitcoin #Crypto #BTCUSD #Forex #NakedChartReader #ZEROindicators #PreciseLevels #ProperTiming #PerfectDirection #ScalpingTrader #IntradayTrader #DayTrader #SwingTrader #PositionalTrader #HighLevelTrader #MambaMentality #GodMode #UltraInstinct #TheeBibleStrategy

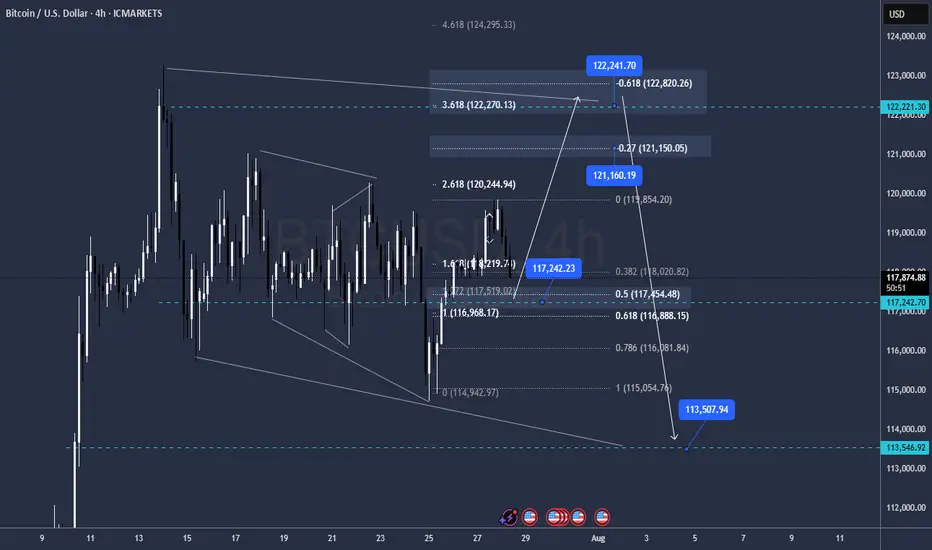
BTC new meassuresokay impulse is pretty much clear
buy level 117.250 Targtting 121.100 / 122.200 / 122.800
Sell level 122.200 targetting 113.500
Re buy level 113.500 targetting 127.500 / 133.000
GG
BTC Short Scalp TradeBitcoin has reach the top of downtrend channel which seems to be holding as significant resistance @ $119,600. The Volume Area High is also located at this level. This gives opportunity for a short scalp trade with TP at $118,200 where a NPoC and PoC of Volume Profile is located. Stop Loss is 0.67% above entry with $7.4M of Sell Book order volume.
NPoC

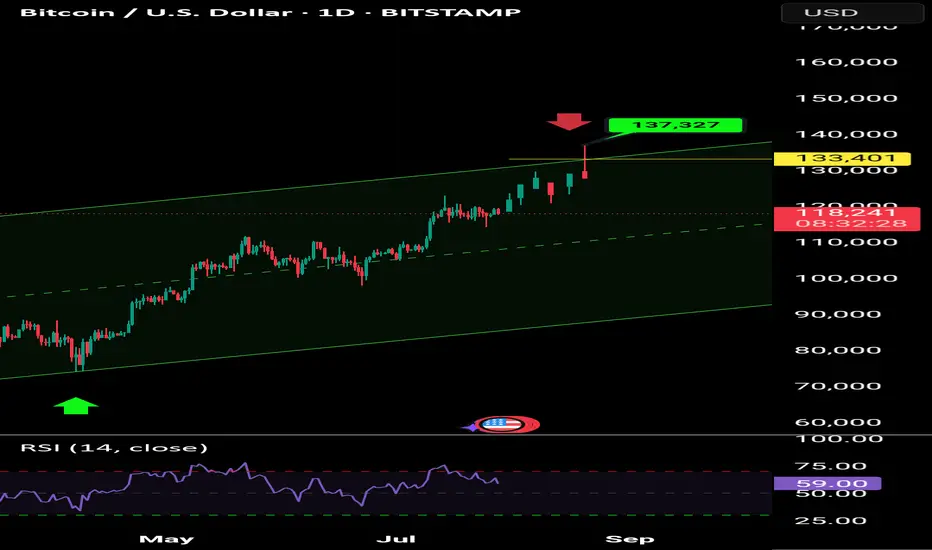
Bitcoin Go 133000Bitcoin prepares to attack the ceiling of the 133,000 range channel after some suffering
Bitcoin tp1:126000
Tp2:128000
Tp3:133000
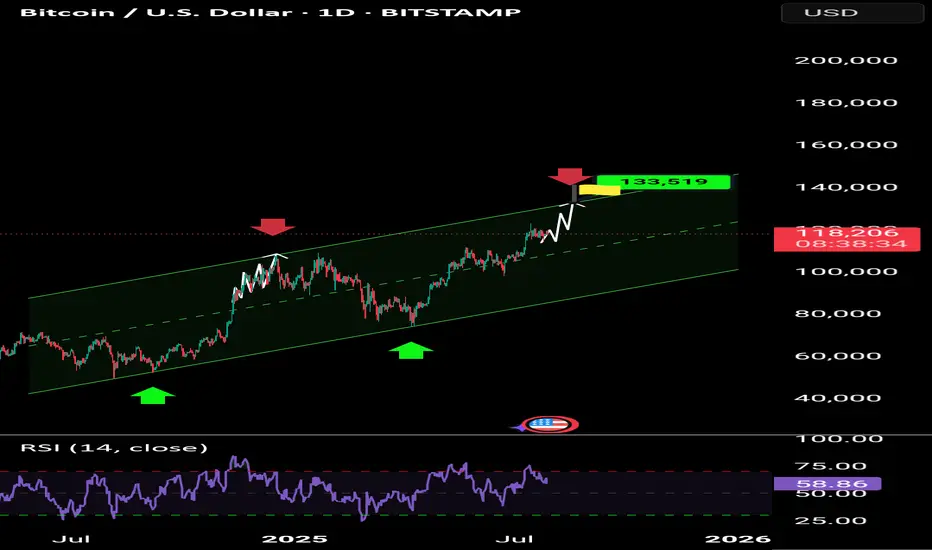
Bitcoin's next target is $133,000Bitcoin prepares to attack the ceiling of the 133,000 range channel after some suffering
Bitcoin tp1:126000
Tp2:128000
Tp3:133000
BTC #15-minute BTC/USD chart This 15-minute BTC/USD chart shows a clear breakdown from a rising channel, followed by a retest and rejection at the former support trendline. The price has now broken below key trendline support and is testing a demand zone near 118,000 USD. If this level fails to hold, the next support lies around the 117,250–117,000 USD zone. This indicates a potential shift in market structure from bullish to bearish in the short term.
BtcUsd targetting 40 to 50 pips next level will be 119000📊 Market Analysis:
Bitcoin (BTCUSD) is currently showing a minor bullish momentum, and based on the current price structure, we are expecting a 40–50 pip move to the upside, targeting the $119,000 level as the next key resistance.
📈 Technical Highlights:
Price is pushing upward with steady momentum.
Forming higher lows, signaling buyer control.
RSI staying above the midline – bullish strength confirmed.
Price aiming to break minor resistance to head toward $119,000 zone.
🎯 Next Target:
Immediate Move: +40 to +50 pips.
Major Resistance Level: $119,000 – watch for potential breakout or reversal there.
📉 Risk Management:
Invalidation below recent low or support zone.
Set tight stop-loss for intraday trades.
🕒 Timeframe: Short-term intraday move – Scalping or quick swing.
#BTC #Bitcoin #Crypto #BTCUSD #Scalping #ShortTermTrade #TradingView
Btcusd Going down 40 to 50 pips BTCUSD Going down cuple of hours and you can take profit 40 to 50 pips

btc on selling#BTCUSD on multiple price rejection at 119k,now we await final touch before a fall below 116487-110k.
Sell at 119436, target 116487-110k, stop loss 120372.
Bullish range isn't strong

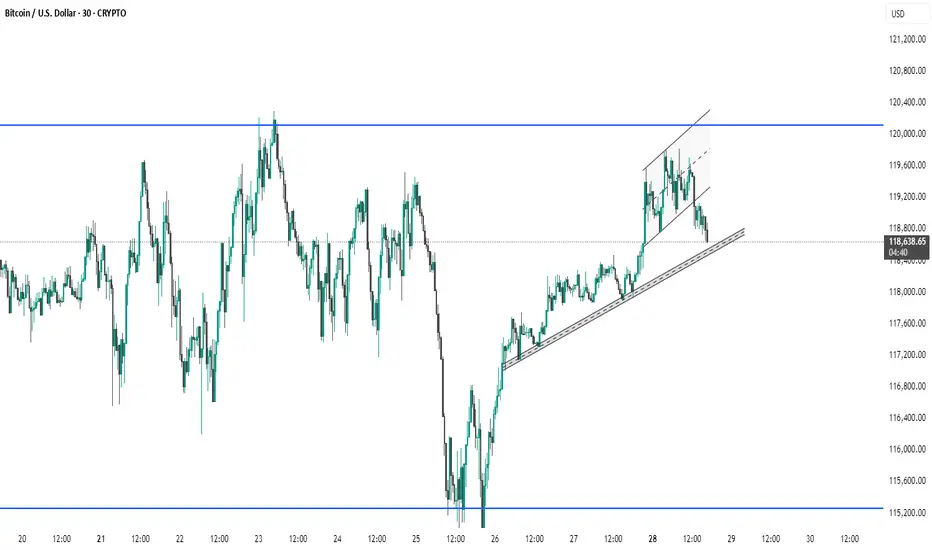
BTC #Bitcoin (BTC/USD) on a 30-minute timeframe. The chart shows Bitcoin (BTC/USD) on a 30-minute timeframe. Price recently broke down from a rising channel and is currently testing a key ascending trendline for support around $118,600. A break below this trendline could signal further downside, while a bounce may lead to another test of the $120,000 resistance level. Traders should watch closely for a confirmed move below or a reversal signal at this support zone.
Bitcoin Cycles Signal Major Move — BIT500 on What Comes NextBitcoin’s historical price action is known for its cyclical behavior — driven not only by supply dynamics like halving events, but also by global macroeconomic forces. This week, leading crypto macro analyst TechDev released a widely discussed model projecting that Bitcoin may be entering a new explosive phase, closely linked to a shift in monetary policy, global liquidity cycles, and risk asset rotation.
At BIT500, we see this as more than a theory — it’s a playbook. Understanding macro-driven crypto cycles gives institutional and high-net-worth investors a clear advantage. And, when used properly, it can become the foundation for consistent alpha generation in the digital asset space.
TechDev’s Model: Liquidity as the True Driver
According to TechDev, Bitcoin’s major uptrends are synchronized with global liquidity expansions. In particular, the model links Bitcoin price surges with:
Falling real interest rates,
Expanding global M2 money supply,
Weakening U.S. dollar (DXY decline).
This pattern played out in 2016–2017 and again in 2020–2021. As global central banks prepare to shift toward more accommodative policies — especially amid slowing GDP growth and rising debt burdens — similar conditions may be taking shape for late 2025 and into 2026.
BIT500 analysts agree: the macro landscape is increasingly favorable for risk-on positioning, especially in hard assets like Bitcoin.
On-Chain Indicators Confirm the Thesis
Supporting the macro thesis is a growing set of on-chain signals. Our internal models — as well as public indicators like Dormancy Flow, MVRV ratio, and Realized Cap metrics — show long-term holders are accumulating, while short-term holder activity has flattened.
The decline in exchange reserves, increased self-custody trends, and decreased miner selling pressure all align with prior pre-bull market phases. This combination of tightening supply and macro liquidity can act as fuel for the next leg up — one that could catch passive investors off-guard.
How BIT500 Capitalizes on Bitcoin Cycles
At BIT500, we convert insights into execution. Our team applies cycle-based, quantitative strategies to capture asymmetric upside while managing downside risk.
Here’s how we turn macro analysis into market performance:
Phased Capital Deployment
We deploy capital in staggered allocations, entering during compression phases and scaling in as trend confirmation emerges — minimizing exposure during volatility and maximizing return during expansions.
Volatility Harvesting
We implement delta-neutral and volatility-arbitrage strategies across Bitcoin derivatives markets, generating income in all phases of the cycle — especially when price is range-bound.
Multi-Asset Rotation Models
Based on cyclical rotation, we dynamically adjust exposure between Bitcoin, Ethereum, and select altcoins. These models are tested to outperform static portfolios across halving-based and macro cycles.
Custom Risk Monitoring Systems
BIT500 clients benefit from our proprietary Cycle Risk Dashboard, which sends alerts when market structure shifts — enabling proactive rebalancing rather than reactive trading.
Conclusion
Bitcoin’s next major price movement is likely to be shaped not just by crypto-native factors, but by broader shifts in global liquidity, interest rates, and investor sentiment. TechDev’s research confirms what BIT500 has long modeled — that understanding economic cycles is key to anticipating large-scale Bitcoin breakouts.
For investors seeking not just exposure but performance, the coming months represent a rare window of opportunity. At BIT500, we don’t just track cycles — we build strategies to monetize them with discipline and precision.
Bitcoin ConsolidatesBitcoin continues to chop sideways, consolidating below the all time high. Demand is high, RSI is dropping as price goes sideways. This will break out again eventually and all eyes will be back on the honey badger.