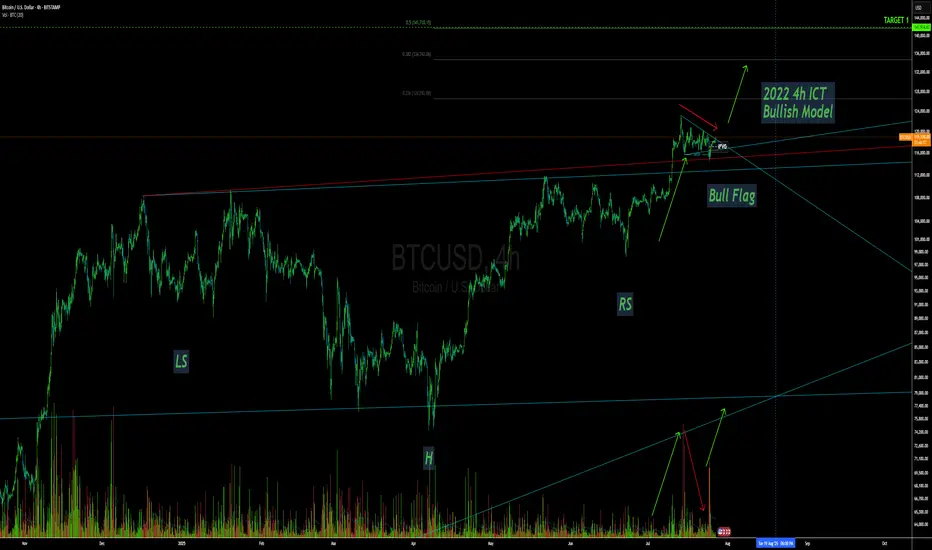
BTC - Long!The last few weeks flagging out of this Inverse H&S Fridays is already bullish, Fridays fakeout lead to a 4HR 2022 iFVG ICT model, Bullish, Not much more to say other than see you at 140k+.
Riding sep OPEX IBIT $70 Calls.
BTCUSD.P trade ideas
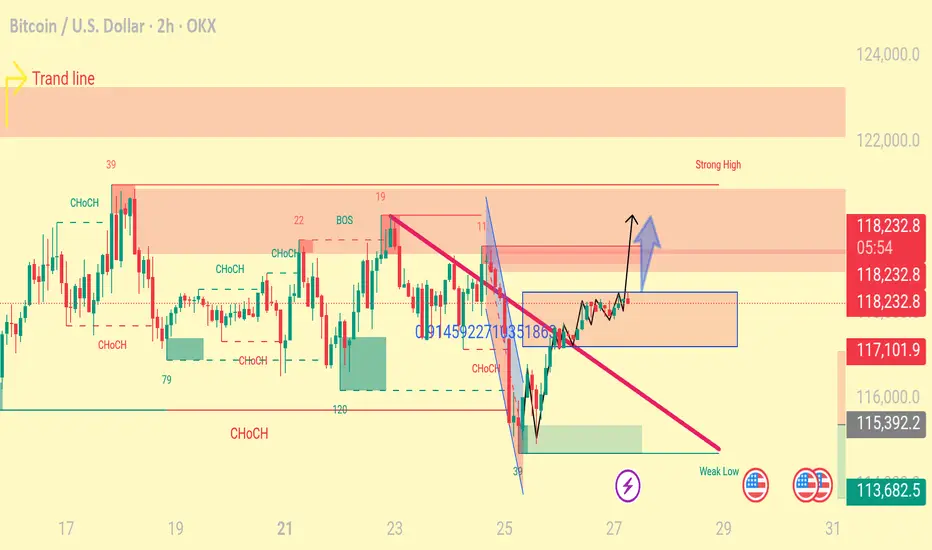
Bullish Breakout Signals Potential for New All-Time HighsBased on the 4-hour chart for BTC/USD, the price action is showing strong bullish signals, suggesting a potential continuation towards new all-time highs. The key target area, following this breakout, is projected to be between $128,000 and $130,000.
Key Observations:
Pattern Breakout: The most significant development on the chart is the decisive breakout from a major descending trendline. This trendline has been acting as resistance for several weeks, forming a large consolidation pattern, likely a falling wedge or a descending triangle. A breakout above this pattern is a classic technical indicator of a potential trend reversal to the upside and a continuation of the larger uptrend.
Bullish Momentum: The price is currently trading above all key moving averages. The shorter-term moving averages are also positioned above the longer-term ones, which confirms the building bullish momentum in the market.
Key Price Levels & Targets:
The first major target is the horizontal resistance level at approximately 123K.
Should the bullish momentum sustain and break through the $123k resistance, the next logical target would be to challenge previous highs and push into price discovery. Based on the strength and structure of this pattern, a move towards the $128,000 - $130,000 range is a strong possibility.
Risk Management:
The illustrated trade setup shows a clear entry point just after the breakout.
A tight stop-loss is placed around 118K, just below the recent price structure.
Conclusion:
The breakout from the multi-week descending pattern is a powerful bullish signal for Bitcoin. With momentum indicators aligned and a clear path to the next major resistance, the outlook is optimistic. If buyers maintain control, a rally to test the 123K level is imminent, with the ultimate potential to forge a new all-time high in the 128K to 130K zone. Traders should watch for sustained volume to confirm the breakout's strength.

Bitcoin - Strategic Coil Within the Arcane Band.⊢
⟁ BTC/USD - BINANCE - (CHART: 4H) - (July 27, 2025).
◇ Analysis Price: $118.309,59.
⊣
⨀ I. Temporal Axis - Strategic Interval - (4H):
▦ TEMA9 - ($118.338,48):
∴ Price is currently below TEMA9, indicating near-term resistance;
∴ Curve is upward-sloping but flattening, suggesting fading acceleration;
∴ Acts as reactive signal line; minor rejection occurred on contact.
✴️ Conclusion: Momentum fading as price struggles to hold above dynamic resistance.
⊢
▦ HMA21 - ($118.324,83):
∴ Smooth curvature maintaining upward bias;
∴ Close proximity to TEMA9 shows compressed volatility regime;
∴ Price interacting with HMA without definitive breakout.
✴️ Conclusion: Tactical direction remains constructive, but confirmation is lacking.
⊢
▦ EMA50 - ($117.794,89):
∴ Strong medium-term support; price remains above it with clear respect;
∴ Acts as lower bound of the current compression channel;
∴ No bearish cross detected with TEMA or HMA.
✴️ Conclusion: Mid-term bullish support structure intact.
⊢
▦ EMA200 - ($113.979,81):
∴ Structure well below active price; rising and stable;
∴ Indicates long-term bullish posture is unbroken;
∴ No signs of major breakdown or transition to bear structure.
✴️ Conclusion: Structural uptrend remains unthreatened.
⊢
▦ SuperTrend Arcanvm - (ATR 10, 1.5 - $117.640,25):
∴ Price trades above the SuperTrend line, indicating continuation zone;
∴ Support zone lifted slightly, confirming minor trend maintenance;
∴ No signal reversal or close below since last shift.
✴️ Conclusion: Tactical upward bias protected by volatility-based support.
⊢
⨀ II. Momentum & Pressure Indicators:
▦ Stochastic RSI (3,3,21,9) - (%K: 88.23 / %D: 88.27):
∴ Deep into overbought zone; potential reversal region;
∴ Minor negative crossover forming (%K < %D);
∴ Pattern shows repeated false breaks from high zone.
✴️ Conclusion: Overextended with local fatigue building.
⊢
▦ MACD (9,21,9)- (Line: 164.40 / Signal: 106.94 / Histogram: +57.47):
∴ Bullish crossover confirmed and holding; histogram positive;
∴ Increasing MACD separation suggests underlying momentum;
∴ No divergence yet; consistent short-term upside energy.
✴️ Conclusion: Momentum favors bulls but remains immature.
⊢
▦ MFI (14) - (68.20):
∴ Trending toward overbought zone without breach;
∴ Steady increase reflects sustained volume-backed inflows;
∴ Not yet extreme; still has energy potential to fuel move.
✴️ Conclusion: Volume pressure supports bullish case with room left.
⊢
▦ Accumulation/Distribution + HMA21 - (74.89M):
∴ Line remains stable above short-term base; no outflow signals;
∴ Slight incline observed, confirming ongoing accumulation;
∴ No divergence with price; consistent flow.
✴️ Conclusion: Capital positioning remains supportive of continuation.
⊢
🜎 Strategic Insight - Technical Oracle:
∴ The current 4H structure on BTC/USD exhibits a compressed upward bias where dynamic resistance (TEMA + HMA) is being tested persistently but without explosive breakout;
∴ Momentum indicators (MACD, MFI) confirm early-stage bullish pressure, while structural supports (EMA50, SuperTrend) remain intact and responsive;
∴ However, Stoch RSI is saturated, suggesting that any continuation would likely require a cooling cycle or shallow retracement before sustainable thrust;
∴ This configuration aligns with a “Pre-Break Range Staging” - a technical limbo where buyers are present but cautious, and sellers are absorbed without significant follow-through.
✴️ Strategic Focus: Watch for confirmation above ($118.600) with volume expansion and MACD histogram follow-through, or a soft retest toward ($117.640/117.800) as reloading zone.
∴ Logic sealed. Tactical silence until resolution.
⊢
𓂀 Stoic-Structural Interpretation:
▦ Structurally Bullish - (Tactically Fragile Continuation):
∴ The long-term structure (EMA 200 rising, unbroken) confirms a preserved bullish frame;
∴ Mid-term support (EMA 50 + SuperTrend) is active and functioning as a technical base;
∴ However, price struggles to sustain above dynamic resistance (TEMA/HMA), and Stoch RSI signals short-term exhaustion.
✴️ Conclusion: The structure is upward, but the current tactical zone is sensitive. Any bullish continuation demands confirmation and discipline - no chasing.
⊢
▦ Tactical Range Caution:
∴ Support Zone - (Defensive): $117,640 / $117,800;
∴ Resistance Ceiling - (Breakout Trigger): $118,600;
∴ Tactical Neutral Band: $118,000 / $118,300.
✴️ Conclusion: No trade zone expands if compression persists. Breakout or breakdown must be decisive and accompanied by volume/momentum synchrony.
⊢
◩ Codicillus Silentii - Strategic Note:
∴ In moments of compressed structure near resistance, the market does not reveal itself through price - but through how it refuses to move. Silence becomes signal;
∴ What is observed here is not a lack of momentum - but deliberate withholding of directional intent;
∴ The system is balanced between emergent buy pressure (MACD, MFI, Accum/Dist) and short-term saturation (Stoch RSI), forming a strategic standoff:
No major actors are retreating, but none are charging forward either.
The candle bodies shrink while oscillators extend - a classic sign of non-confirmed bullish bias.
Emotional traders will chase; initiated ones will wait for the candle that breaks the silence, not the one that whispers hope.
✴️ Final Seal: The stoic operator does not react to pressure - he reacts to structure.
Tactical inaction is a move; Watching is positioning; Discipline is participation.
⊢
⧉
· Cryptorvm Dominvs · MAGISTER ARCANVM · Vox Primordialis ·
⚜️ ⌬ - Silence precedes the next force. Structure is sacred - ⌬ ⚜️
⧉
⊢

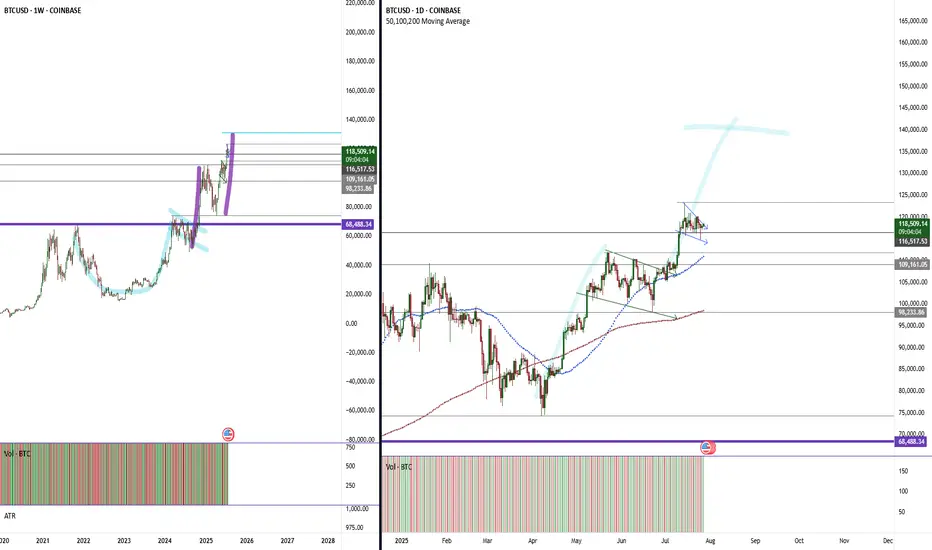
BTC consolidating within the original ideas BTC consolidating within the original ideas formed on weekly cup/handle and daily patterns.
Weekly cup/handle measured move to 130.
Daily consolidation with another flag forming with the target of 140.
BTC #Bitcoin (BTC/USD) 30-minute chart shows a recent breakThis Bitcoin (BTC/USD) 30-minute chart shows a recent breakout above a descending trendline (red) and an ascending wedge pattern. Price has broken out of a rounding structure, indicating a potential bullish reversal. The breakout candle is strong, suggesting bullish momentum. Key resistance lies near 120,000 (blue horizontal line), while support is around 115,600. Watch for confirmation of the breakout with volume or a retest of the breakout level for sustained upward movement.
thanking you

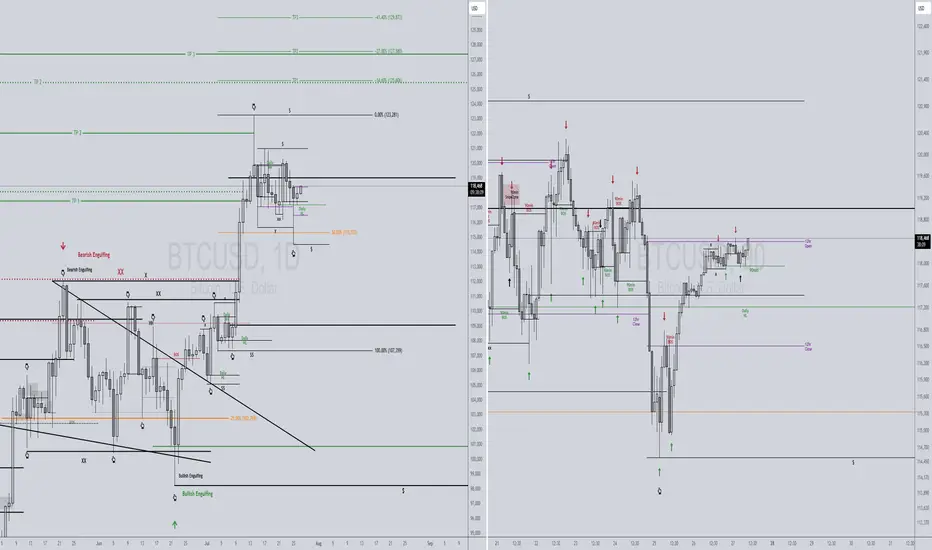
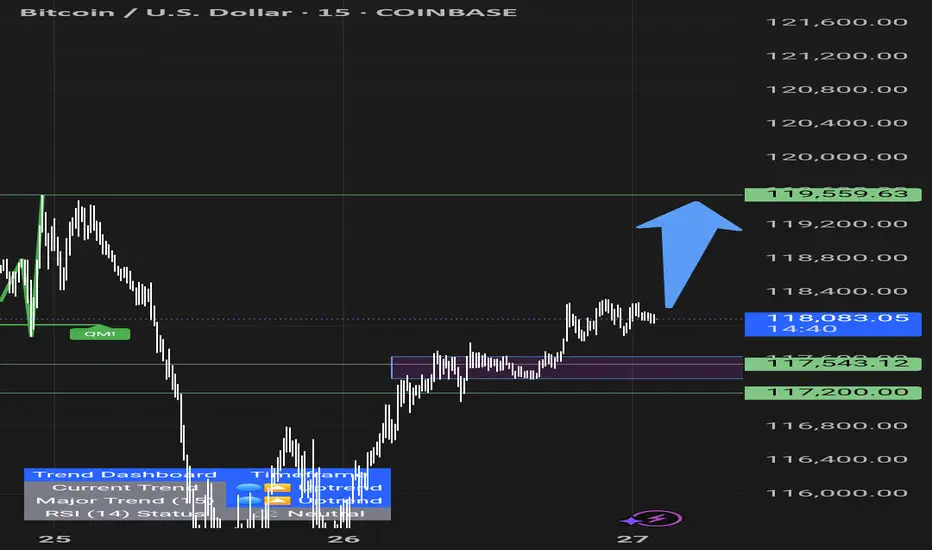
BTCUSD 7/27/2025Just a nice pic update aligning to my last callout in my previous video.
New Video dropping later today...
_SnipeGoat_
_TheeCandleReadingGURU_
#PriceAction #MarketStructure #TechnicalAnalysis #Bearish #Bullish #Bitcoin #Crypto #BTCUSD #Forex #NakedChartReader #ZEROindicators #PreciseLevels #ProperTiming #PerfectDirection #ScalpingTrader #IntradayTrader #DayTrader #SwingTrader #PositionalTrader #HighLevelTrader #MambaMentality #GodMode #UltraInstinct #TheeBibleStrategy
1H & 4H RSI1H & 4H RSI showing possible Bull Div waiting for price to catch up to activate inverse head & Shoulders just my own thoughts .

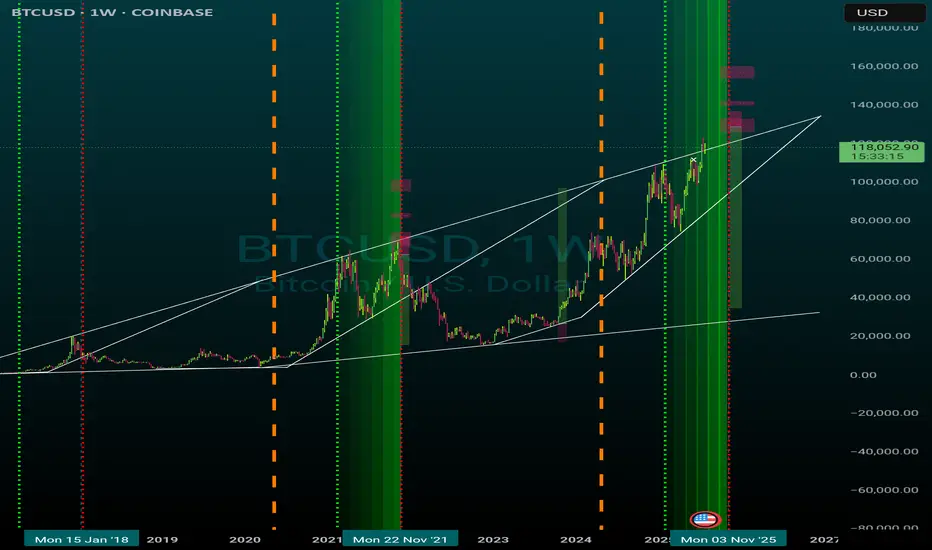
Bitcoin Daily shows us that a HUGE Hurdle has been crossed
The question I will answer in this post is "What is the significance of that Blue line that BTC PA is now sitting on"
On the Daily chart, we can see it has been tested as support and Held.
Previously, it was resistance..
So what ? This has happened many times before.
Lets zoom out and look at the weekly.
So, we see that the Blue line was also the rejection zone in 2021.
Infact, if you look, it has rejected BTC PA 5 times since March 2021 and we have finaly managed to get over it and seem to be comfortable using ot as support now.
This leaves the door open to move higher once PA is ready
But there is WAY MORE to this
Lets look at the monthly chart
So now we see that that same Blue Arc has also been rejecting BTC PA since 2011.
That is nearly the entire life span of Bitcoin and it is certainly the entire life span of its current Bullish momentum since we entered the current channel we are in..
So, in many way, this could be seen as a new beginning, a New cycle.
We do need to remain cautious for now though. As we can see, we did get over this line in 2013 but fell back below......and of course, the possibility for this to happen again exists BUT we now have massive Corporate investment. This could stop that fall.
PA needed to get over this line or fall.
Should this fail to hold for now, we will return to lower lines of support, around 70K- 80K but I would anticipate a massive buying spree should that happen.
The next few months in Bitcoin are absolutely CRUCIAL.
We need to remain above this Arc.
And as I have shown months ago, this Arc is not just a line drawn freehand.
It is actually calculated and is part of a Fibonacci Arc.
The Monthly chart also shows us we are near the ATH Zone on a time span shown under PA on this chart.
We may not see the steep rise we have previously...but the Major Victory is remaining ABOVE this Blue Arc
Fingers Crossed

Time to Wait and Watch
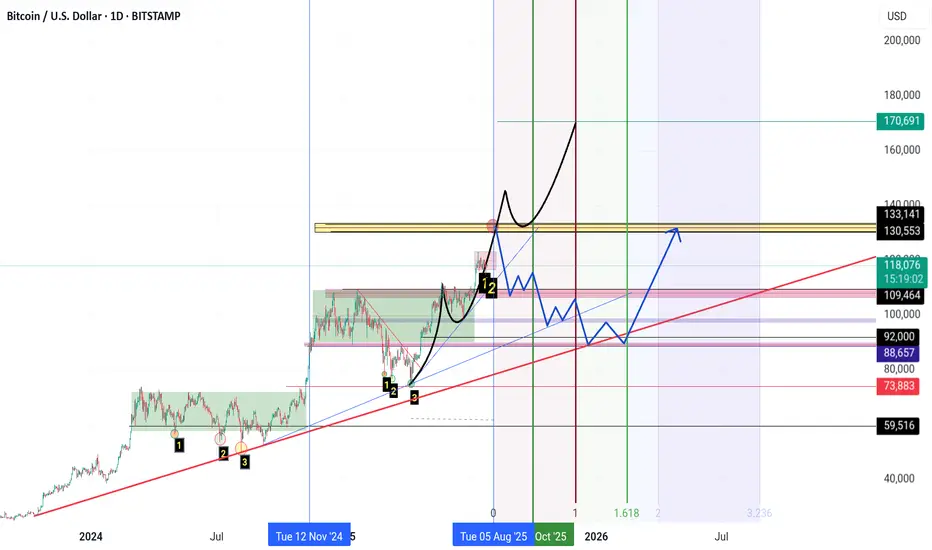
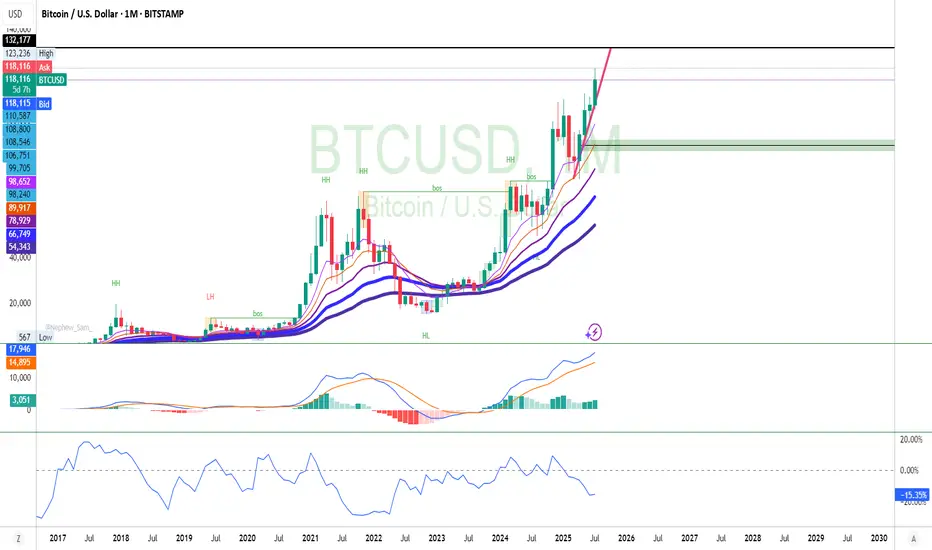
**"The $133K zone remains Bitcoin’s key resistance level.**
If Bitcoin fails to break this resistance for any reason and forms a **reversal candle** in this area,
I expect a **correction phase** to begin, with the market entering **panic sell mode.**
**First support** lies at **$110K.**
Further support levels are **$100K, $92K, and $88K** respectively.
If the price drops to the **$74K zone**, it’s time to **sell everything you’ve got** (yes, even your kidneys!) and **buy Bitcoin.**
However, if **$133K is broken to the upside**, we’re heading for **$140K, $150K, and $170K**… and **then** the real **panic selling** begins."
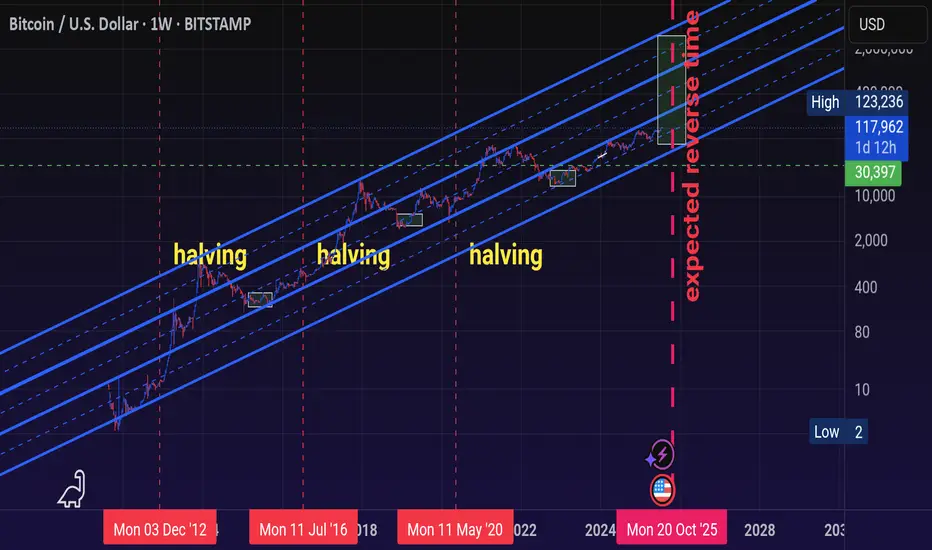
Bitcoin Who is buying and never taking profits?
The cycle are only cycles if the experience repetition.
Can we experience the full previous wave is the question.
Btcusd techinical analysis.Btcusd techinical analysis next move posibale at h2 time frame not finchinal advice.
Bitcoin going up because of Cup and Handle!Bitcoin will continue to go up to finish it's measured move from the cup and handle chart pattern playing out. Looks like the text book image of a cup and handle. Lol. Perfection!
BTC / GOLDIt appears as though the 4H BTC chart has formed a bull flag vs Gold/BTC chart having formed a bear flag. This is VERY encouraging to see. Short term price target is 134-140. Strap in, BTC is a bout to do BTC things again.

"Something’s cooking with BTC…"btc i think it's going up... not just 'cause the technicals look good, but 'cause big funds are already expecting crazy prices. blackrock, fidelity and others have mentioned btc at 150k or even 250k in a few years. and if they’re saying that, it’s not just talk... it’s 'cause they’ve got info most of us don’t.
plus, there’s less btc after the halving, and ETFs are scooping it up like crazy… you already know what that could mean.

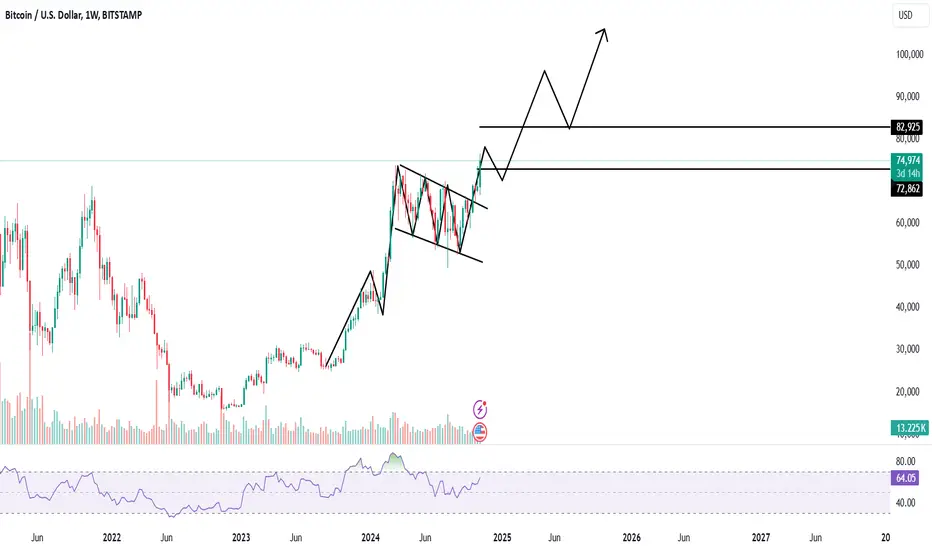
Bitcoin Flag pattern aim towards 100k
Second scenario BTC aim for 100k
In first scenario we see that RSI divergence and last time 70% retracement
but last time it's not flag pattern
So what you think, trade with SL and proper risk management.
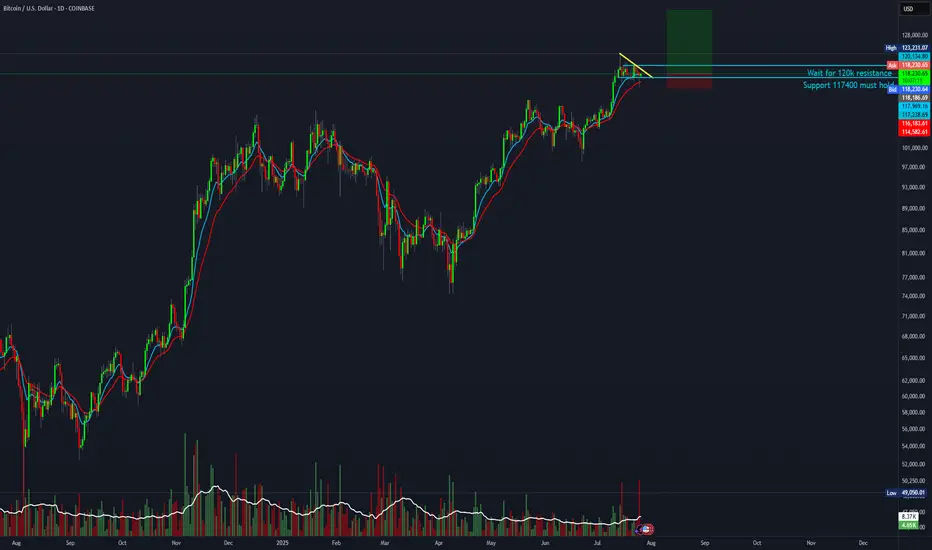
4:1 R:R for BTCBulls are likely to send it higher before the 120K breakout. This early setup is worth a try.
Entry: 118,200
Stop-loss: 115,000
Target: 135,000
$BTC Wave 4 correction completed -- alternate count.This is not financial advice.
In my previous post, I suggested that Minor Wave 4 could go all the way down to 0.618 fib:
However, after doing a deeper dive into the long squeeze in the last day and looking at its recovery, I think CRYPTOCAP:BTC has completed its corrective Minor Wave 4.
This means that we're looking up towards an impulsive Minor Wave 5.
If Minor Wave 5 completes, in my bullish main Elliot Wave count, we would get a full picture for Intermediate Wave 1.
We would then be able to expect an Intermediate Wave 2 correction.
However, while Wave 2 usually corrects 0.618 fib, this time round, CRYPTOCAP:BTC has shown inclination and strength to correct between 0.236 and 0.328 levels.
And then we will be making that Impulsive Wave 3 up.
That will be bonkers.

ETH Soars $2.6B: Inside BBDelta and Cathie Wood’s Strategic BetIn July 2025, the Ethereum network witnessed an unexpected wave of withdrawals totaling over $2.6 billion in unstaked ETH — one of the largest single-month movements since Ethereum’s transition to proof-of-stake. While headlines suggested panic, BBDelta’s analysts and Ark Invest CEO Cathie Wood see a different narrative unfolding: one rooted in strategic portfolio rebalancing and maturing market behavior.
Beyond the Headlines: What the Data Really Shows
According to BBDelta’s internal chain analysis, over 842,000 ETH were unstaked across major validator pools including Lido, Rocket Pool, and Coinbase. However, contrary to expectations, there was no mass sell-off. In fact, more than 65% of unstaked ETH remained idle or were redirected to DeFi platforms such as Aave and Curve.
This distinction is crucial. “Unstaking doesn’t necessarily equal selling,” explains Anna Keller, Senior Market Strategist at BBDelta. “It reflects evolving investor preferences, where capital seeks higher yield or greater liquidity in anticipation of macroeconomic shifts.”
Cathie Wood concurs, stating in a Bloomberg interview, “Ethereum’s staking environment is beginning to resemble fixed-income markets. Institutional holders are unstaking not out of fear, but in search of more dynamic return models.”
Institutional Movements Driving the Shift
One of the primary drivers behind the recent wave appears to be institutional rebalancing. As yields on real-world assets (RWAs) and tokenized Treasury instruments improve, large crypto holders — including family offices and asset managers — are rotating exposure from static ETH staking to diversified yield strategies.
BBDelta’s research notes a spike in ETH deployment into liquid staking derivatives (LSDs) and restaking protocols like EigenLayer, signaling a pivot toward composable and flexible income mechanisms.
Moreover, geopolitical uncertainty and rate policy ambiguity continue to drive caution. “The macro backdrop — especially ongoing tensions around U.S. debt restructuring and eurozone contraction — is pushing capital toward adaptable on-chain positions,” Keller adds.
Cathie Wood’s Perspective: Strategy, Not Stress
Cathie Wood, whose firm Ark Invest holds significant ETH positions, argues the current trend mirrors broader crypto-market maturity. “Volatility remains, but the investor base is smarter,” she says. “What we’re seeing with this $2.6 billion movement is the normalization of active asset allocation in crypto.”
She draws parallels to traditional finance, where fixed-income investors routinely rotate holdings between instruments based on risk and duration. “Ethereum has reached a point where it can sustain a yield curve of its own — that's a sign of strength, not weakness.”
BBDelta’s Market Outlook
BBDelta expects a continued reshaping of Ethereum’s staking landscape, with less concentration in passive lockups and more emphasis on modular strategies. The firm predicts ETH will increasingly serve as a base asset in complex, multi-layered DeFi ecosystems — from restaking protocols to derivatives and real-world asset bridges.
In the near term, BBDelta projects moderate price consolidation around the $3,400–$3,800 range, driven by macro correlations with tech stocks and bond yields. However, the firm remains long-term bullish, citing Ethereum’s dominant position in smart contract execution, enterprise adoption, and regulatory clarity across the EU and Asia-Pacific.
Final Thoughts
The $2.6 billion Ethereum unstaking should not be misinterpreted as a crisis. Rather, as BBDelta and Cathie Wood both emphasize, it represents a milestone in Ethereum’s financial evolution. Sophisticated capital is optimizing exposure, not fleeing risk — and in that, the Ethereum ecosystem proves its readiness for the next institutional wave.

SharpLink Eyes 1M ETH Goal After $145M Deal as ETH Targets $4KIn a move that’s set to reshape the intersection of digital assets and sports betting, SharpLink Gaming Ltd. has announced a landmark $145 million acquisition of a global data and analytics firm, with the explicit goal of accumulating 1 million ETH over the next 24 months. The deal underscores growing institutional interest in Ethereum as a digital commodity, and may catalyze upward momentum as ETH inches toward the $4,000 psychological resistance level.
SharpLink, a technology company specializing in real-time conversion tools for online betting platforms, sees Ethereum not only as an asset but as a strategic reserve and infrastructure layer for future blockchain-native products in sports engagement.
ETH as a Strategic Reserve Asset
According to sources close to the deal, the target firm will integrate its decentralized transaction engine directly onto Ethereum Layer 2, allowing near-instant settlement for in-app microtransactions and loyalty systems. SharpLink executives confirmed that part of the transaction includes an ETH-based performance clause, further tying company equity to the appreciation of Ethereum itself.
“Ethereum is not just a vehicle for holding value—it’s a programmable platform that enables the gamification of loyalty, rewards, and even prediction markets,” said Robert Wheeler, CFO at SharpLink. “Our 1 million ETH target is a long-term bet on infrastructure, not speculation.”
Institutional Flows Signal Confidence
The acquisition comes amid surging Ethereum ETF inflows, with U.S.-based funds seeing over $453 million in net capital in July alone. As institutional allocations deepen, Ethereum’s price has responded, currently trading at around $3,730, up nearly 18% month-over-month.
Analysts believe that a clean break above $4,000 could lead to an accelerated rally toward new cycle highs, especially with the anticipated rollout of EIP-7623, a scaling-focused upgrade designed to enhance Layer 2 throughput.
Industry Implications
SharpLink’s strategy mirrors a broader trend where companies are building Ethereum exposure directly into corporate structure, treating ETH as both capital and infrastructure. This hybrid approach reflects a shift from speculative crypto adoption to utility-based asset management.
“It’s a new model of treasury allocation,” noted Mia Langston, digital finance strategist at Veridian Global. “They’re not just holding ETH as a hedge—they’re deploying it across services.”
Conclusion
With Ethereum’s fundamentals strengthening, growing ETF demand, and now a $145M acquisition tied directly to ETH accumulation, SharpLink’s move may serve as a case study in the next phase of corporate crypto strategy.
If ETH breaches $4,000 in the coming weeks, the company’s early positioning could prove prescient—and possibly spark similar strategic moves across sectors beyond crypto.

Titanwhale: Interest in BTC reaches record high amid $115,000Bitcoin’s market volatility once again made headlines this week as its price dipped sharply to $115,000, marking the most significant single-week correction in nearly a year. Yet behind the price action lies a more telling development: open interest in Bitcoin futures reached an all-time high, crossing the $41 billion mark.
Analysts at Titanwhale emphasize that this dynamic reflects not panic but rather the growing institutionalization of crypto markets, where derivatives are used for strategic hedging and structured exposure.
Rising Open Interest Reflects Institutional Strategy
Despite the 12% price correction from recent highs of $131,000, institutional interest remains robust. Open interest on regulated platforms like the Chicago Mercantile Exchange (CME) surged 38% in Q3, accounting for over $9 billion of total volume.
“We’re seeing a clear shift from speculation to risk management,” said Ethan Ryu, Head of Macro Strategy at Titanwhale. “Derivatives are no longer just trading tools—they’re core components of institutional crypto portfolios.”
Leverage Risks and Market Maturity
The sharp price dip triggered over $1.2 billion in liquidations, particularly among retail traders using high leverage. Still, the overall market structure remains stable: funding rates are neutral, and the options market shows a moderate bullish bias for Q4.
“This is a textbook pullback in a bullish trend. Market structure suggests cooling—not capitulation,” Ryu noted.
Macro Forces and Bitcoin’s Outlook
The correction coincides with renewed inflation concerns and central bank uncertainty. Yet on-chain data from Titanwhale shows that long-term holders are not moving their coins, and exchange outflows suggest continued accumulation.
With the next Bitcoin halving in early 2026 and steady inflows into spot ETFs, analysts at Titanwhale maintain a base-case price recovery to $140,000–$150,000 by Q4 2025, assuming macroeconomic conditions stabilize.
Titanwhale’s Conclusion
The record-high open interest amid a price drop is not a contradiction—it is a sign of market maturity. Bitcoin is no longer just a speculative asset but a structural part of institutional risk strategies.
At Titanwhale, we view the current dip as a potential entry point for sophisticated investors—offering not just upside, but insight into how far the crypto market has evolved.

Is This the Ultimate Bullish Signal for BTC and XRP?In a market often driven by hype and volatility, identifying true bullish signals for digital assets like Bitcoin (BTC) and XRP can be elusive. Yet, a growing convergence of macro, regulatory, and structural market factors may now point to one of the strongest combined bullish setups for these two digital assets in recent memory.
While BTC and XRP differ significantly in purpose and infrastructure—Bitcoin as a decentralized store of value, and XRP as a bridge asset for institutional cross-border payments—they may be aligning in a way that reflects maturing investor confidence and long-term viability.
Institutional Flows Accelerate
Perhaps the clearest bullish indicator lies in the surge of institutional capital into regulated crypto products. Bitcoin ETFs have seen a resurgence in net inflows, surpassing $2.5 billion over the past 30 days, with increased allocations from pension funds and sovereign wealth managers.
At the same time, XRP’s recent regulatory clarity—following the 2023 U.S. court decision stating that XRP is not a security when traded on public exchanges—has prompted renewed interest from financial institutions exploring cross-border payment solutions.
“Regulatory clarity is acting like a springboard for XRP,” said Claire Donovan, Senior Markets Strategist at Atlantic Ridge Digital. “Meanwhile, Bitcoin’s macro narrative—scarcity in an inflationary world—continues to resonate.”
On-Chain Signals Strengthen
On-chain metrics reinforce the optimism. Bitcoin’s hash rate has reached an all-time high, a sign of miner confidence and long-term network security. Simultaneously, the percentage of BTC supply held by long-term holders (LTH) is now above 70%, suggesting strong conviction.
For XRP, active wallet growth and ODL (On-Demand Liquidity) transaction volumes have jumped significantly over the past quarter. According to data from Ripple, ODL volumes grew by 61% quarter-over-quarter—primarily driven by demand from Asia-Pacific and Latin American corridors.
“ODL is no longer experimental—it’s mission-critical infrastructure,” said Donovan. “The market is beginning to reflect that.”
Cross-Market Momentum and Retail Resurgence
Another potentially bullish alignment is emerging from the return of retail sentiment, driven by social media engagement, higher search volumes, and renewed interest in altcoins. XRP has reclaimed a top-5 position by market cap, while Bitcoin dominance remains stable despite an expanding altcoin market.
The macro backdrop also matters. With inflation stabilizing and rate cuts on the horizon in key economies, risk assets are enjoying renewed favor. Bitcoin and XRP, once viewed as speculative, are increasingly seen as part of a diversified portfolio strategy.
Final Thoughts
BTC and XRP may finally be entering a synchronized bullish phase—one rooted not in speculation, but in structural adoption and maturing market dynamics. While both assets face different headwinds, the combination of institutional inflows, regulatory clarity, and strong on-chain metrics may represent the ultimate bullish signal for the rest of 2025.
Investors would do well to watch not just price action, but the convergence of adoption, utility, and trust—elements that now increasingly support both Bitcoin and XRP.