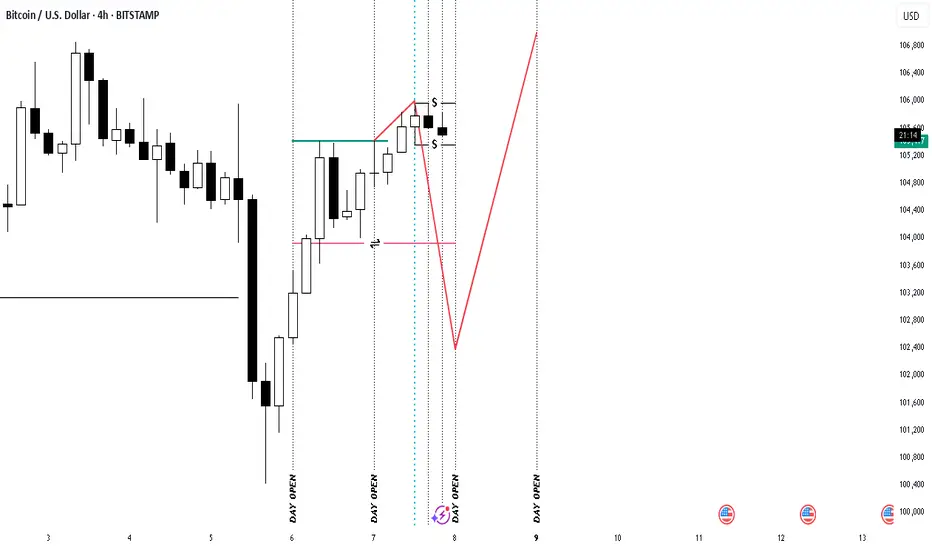
BTCUSD 8 june 2025Price Break Friday high : 105415
Indicate pullback to Friday equilibrium around : 103918
before continuing rally
BTCUSD.P trade ideas
BTC/USD – Retest Incoming? Market Prepping for the Next MoveBitcoin is showing signs of strength as price climbs back toward the mid-zone of $105K+ after a healthy pullback. Looking across the multi-timeframe setup (5M, 20H, 12M), there are several key observations that may suggest the next leg up is brewing.
🧠 Structure Breakdown:
🔹 20H Chart
We're seeing a potential retest forming after the recent bounce off the 0.786 Fib retracement (~$101,119), which aligns near the current local low at $100,377.01. Price is holding above this level, indicating buyer interest in this zone. A move toward the $108,388 to $109,048 zone is expected—this zone aligns with previous structure and Fibonacci projection.
🔹 5M Chart (Macro Outlook)
On the 5M macro view, price is still holding above the previous major breakout zone, and the current candle is showing a strong recovery structure. If momentum continues, BTC may attempt to retest the $112,000 previous high. A close above that could open the door for price discovery into the $115K+ range.
🔹 12M Chart (Yearly)
This is the big picture—BTC is still within a major macro range. After printing a long wick down to $74,420 earlier in the year, buyers stepped in aggressively. The yearly chart is now trading in the golden zone (0.618–0.786), with $95,976 and $101,119 acting as critical confluence levels. A successful retest of this area may lead to the completion of a bullish yearly continuation pattern, targeting the $112K breakout.
🚨 Key Levels to Watch:
Support: $101,119 (0.786 Fib), $95,976 (0.618 Fib)
Resistance: $108,388 → $112,000 (Previous High Zone)
Breakout Trigger: Clean daily close above $109,048
Bearish Invalidator: Breakdown below $100,377 + momentum loss
📊 Final Thoughts:
Bitcoin is showing signs of structure-based recovery, and the multi-timeframe analysis points toward a measured retest of key resistance. Watch for strong volume and bullish engulfing patterns at resistance zones. This isn’t a moment to guess — it’s a time to monitor, plan, and react to confirmation. 🔍

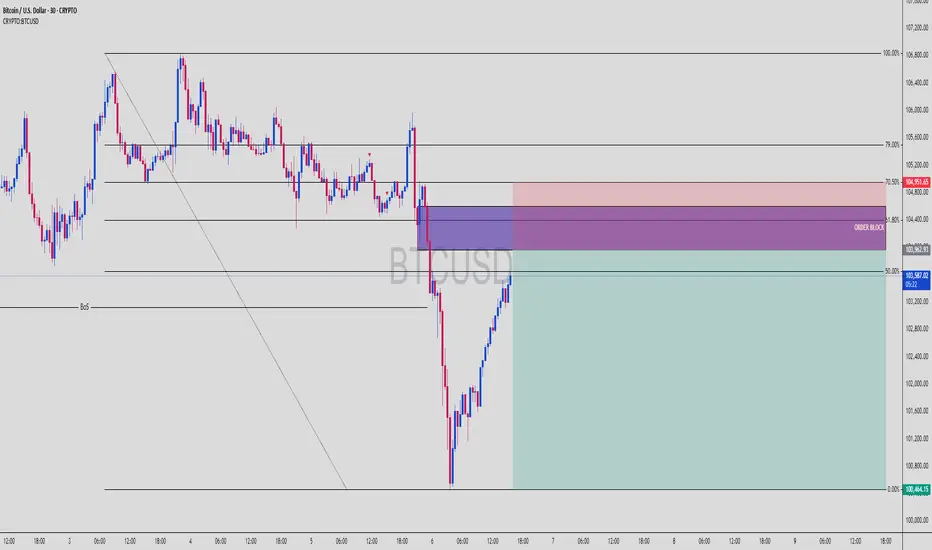
BTC Short Setup! Break of Structure + OB + 70.5% Premium TapBitcoin (BTCUSD) | 30-Min Chart – Clean Bearish SMC Setup
BTC just delivered a textbook Break of Structure (BoS) to the downside, and price is now retracing into a high-confluence premium zone packed with Smart Money signals: a bearish Order Block (OB), Fair Value Gap (FVG) alignment, and multiple Fibonacci retracement levels. This setup is precision-crafted for patient traders who wait for institutional footprints before striking.
🔍 Trade Breakdown:
🔺 Market Structure Shift:
Price broke decisively below the internal range, forming a clear BoS (Break of Structure). The lower low confirms bearish intent. Any retracement into premium is now a potential short opportunity.
📉 Bearish Order Block:
Marked just above the 61.8% Fib
Originated the strong bearish impulse that created the BoS
This is where Smart Money likely entered the move — we look to join them
🟣 Fair Value Gap (Imbalance Zone):
Gap within the OB
Price is likely to rebalance this inefficiency before continuing the bearish trend
📐 Fibonacci Levels (Swing High to Low):
50%: 103,617 (current price)
61.8%: 103,963
70.5%: 104,800
79%: 105,200
This premium zone (104,400–104,951) overlaps with the OB and FVG — massive confluence.
🧠 Smart Money Playbook:
🔹 Entry Zone:
From 103,963 to 104,951 — OB + FVG + 61.8–70.5% retrace = sniper entry window
🔻 Stop Loss:
Above 105,000 (protect against OB invalidation and final liquidity sweep)
📉 Take Profit:
100,464 — aligned with the low of the full fib swing and prior liquidity pocket
⚖ RRR:
Over 1:4 — clean sniper risk-reward with clear structure validation
📉 Bearish Continuation Expectation:
Price enters OB → taps imbalance → reacts at 70.5% level
Expected move: Sell-off toward the discount zone + full swing completion
Look left — no major support zones until the 100,400–100,600 level, making it a liquidity magnet and realistic TP zone.
💬 Ninja Wisdom:
Structure + Liquidity = Foundation
OB + FVG + Fib = Precision Tools
Trade where Smart Money enters — not where retail hopes. 🥷💸
📍 Save this chart – this setup could play out fast
🔁 Share your thoughts: will BTC respect the OB or break above?
👣 Follow @ChartNinjas88 for daily sniper-level BTC/ETH/Gold trades
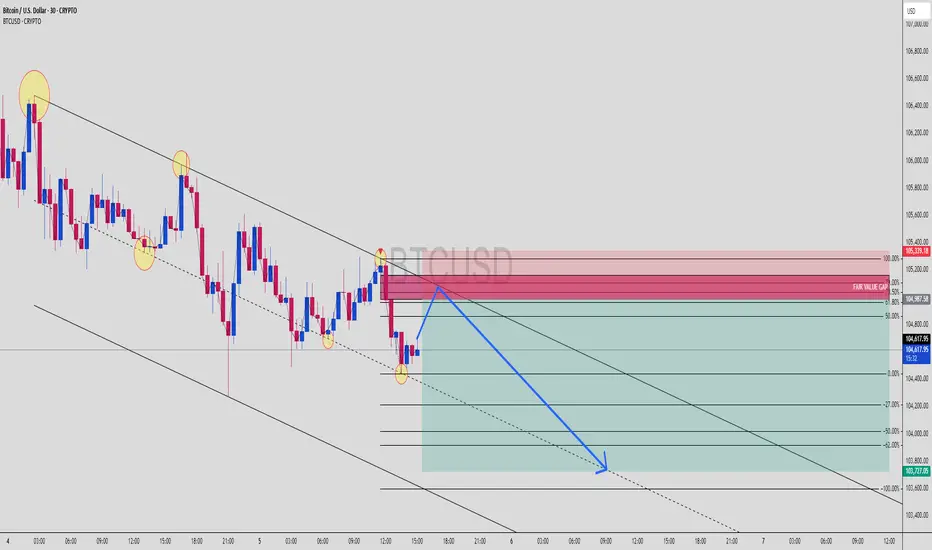
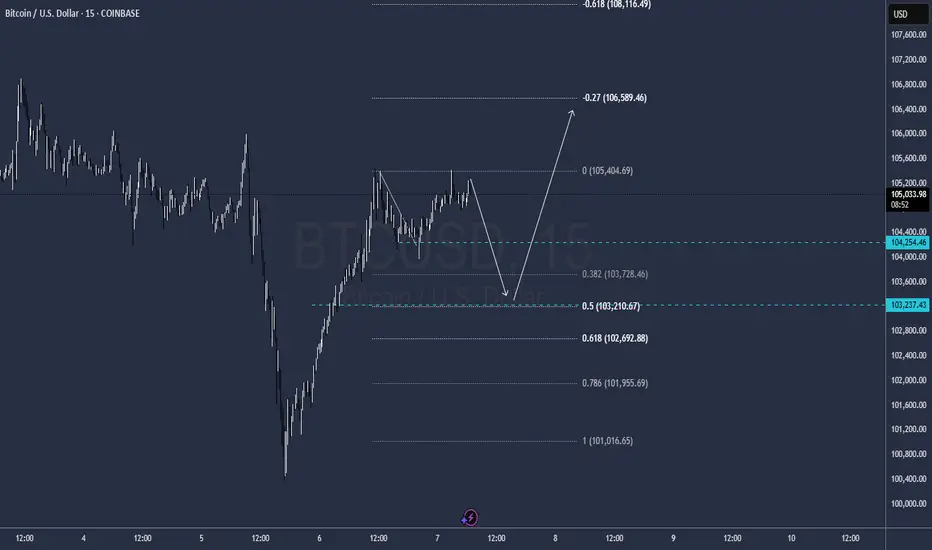
BTC Short Setup! OB + Fair Value Gap + Trend Channel ConfluenceBitcoin (BTCUSD) | 30-Min Chart – High Probability Sell Setup
Bitcoin continues to respect bearish structure inside a descending trend channel, creating prime opportunities for Smart Money traders to strike at optimal levels.
🔍 Trade Breakdown:
Bearish Market Structure
Price is forming lower highs and lower lows
Channel structure is being respected with multiple taps on both the upper and lower bounds
Liquidity Sweeps & Internal Range
Multiple yellow-highlighted zones show liquidity engineering — both buy-side and sell-side have been swept
Recent sweep + demand failure confirms bearish intent
Premium Entry Zone Setup:
🔴 Order Block Zone (OB): 105,200 – 105,400
🟣 Fair Value Gap (FVG): Overlapping with OB – perfect imbalance correction
📐 Fib Levels:
61.8% = 104,987
70.5% = 105,298
79% = 105,388
🔺 This is the kill zone — premium retracement + inefficiency fill = high confluence
Bearish Continuation Expectation:
BTC likely to react at OB zone and continue bearish leg
Projection into discount fib levels:
-27% = 104,000
-62% = 103,800
-100% = 103,727
Channel Respect = Structure Confidence:
Every key swing is aligning with channel resistance/support
Blue arrow shows expected path: liquidity sweep ➝ OB/FVG tap ➝ drop to channel low
🧠 Chart Ninja Entry Plan:
🔹 Entry Zone 105,280 – 105,388 (OB + FVG + 70.5–79% Fib)
🔻 SL Above 105,400 (above OB)
📉 Target 103,727 (channel + -100% Fib extension)
⚖️ RRR Over 1:4 — sniper-grade RR setup
💬 Ninja Wisdom:
You're not chasing moves — you're waiting where liquidity pools.
Fair Value Gaps + OB + Trend Channels = institutional signature.
Trade like Smart Money. Let retail chase candles. 🥷💸
📍 Save this setup before the market plays out
🔁 Share your thoughts below – entry, TP, SL?
👣 Follow @ChartNinjas88 for more sniper BTC setups daily
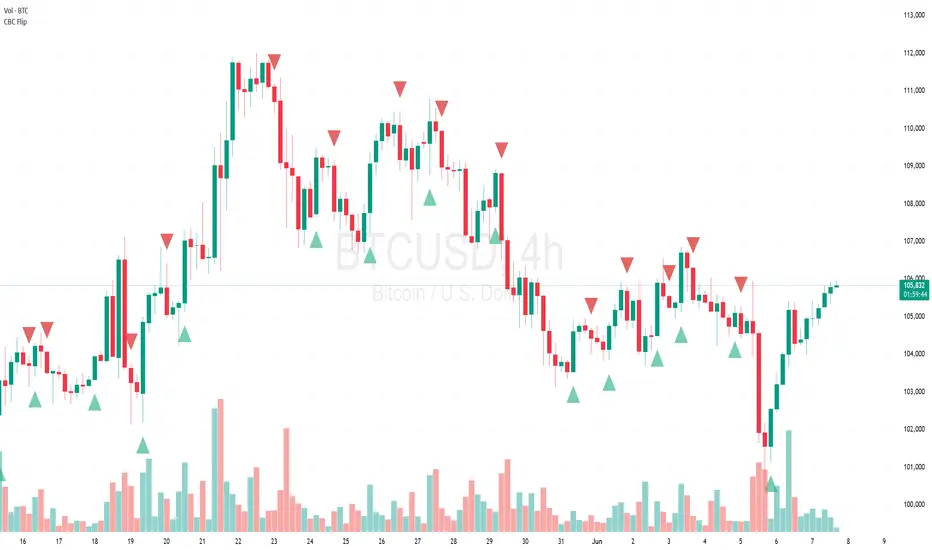
BTC/USD 4H Analysis: CBC Flip Strategy Long OpportunitiesThe following analysis is based on the BTC/USD 4-hour chart, utilizing the CBC Flip Strategy indicator . As of the latest data, the price has experienced significant volatility, with a current level around 105,946 USD, reflecting a 0.94% increase over the observed period. Key pivot points are noted at 103,888 (H4), 104,304 (L3), 107,127 (C3), and 107,307 (Vol 104.09), providing critical support and resistance levels.
The chart highlights multiple long entry opportunities, with notable setups including:
A long entry at approximately 104,000 USD with a TP/SL at 104,319 and a target of 104,546.
Another long setup near 105,000 USD with TP/SL at 105,127 and a target of 105,307.
Recent price action shows a recovery from a low of 103,000 USD, with green candlesticks indicating bullish momentum as of June 7, 2025, 17:52 UTC-4.
The CBC Flip Strategy, set with a 2% risk parameter, suggests disciplined trade management. Volume analysis at the bottom indicates increased activity during upward movements, supporting the validity of these long signals. Traders should monitor for a potential retest of the 104,304 support level, with a break above 107,127 potentially confirming a stronger bullish trend.
Disclaimer: This analysis is for educational purposes only and not financial advice. Trading involves substantial risk, and past performance is not indicative of future results. Conduct your own research and consult a financial advisor before making trading decisions.
BTC, ETH and SOL UPDATEWell....well.....well, look at that, damn bears trying to set a trap but I know their game very well and one of two things it will take place and fortunately at the end both scenarios will have the same outcome (UP).
We can see that price didn't drop last nigh when it should so next price move during the next 2 or 3 days(if not sooner) either will move sideways and then breakout or it will drop to grab liquidity bounce and then breakout to go for the $107k in either case scenario it will end up going for the $107k. Now if you are Long with high lev and your liquidation point is above $103500 you gonna get rekt. Know the rules of the game ...Play it safe. Take care everyone.

BTC Long Triggered from OB, Smart Money Played This Perfectly!BTCUSD | 30-Min Chart – Long Setup Execution
Bitcoin has just activated a clean long entry from a well-defined bullish Order Block at a key structural level. This move follows textbook Smart Money Concepts (SMC) — the kind of play institutional traders thrive on.
🔍 Setup Breakdown:
🔹 Order Block (OB):
Identified near 105,636 — aligned with previous support
Precise reaction zone after consolidation, showing institutional interest
OB respected after fakeout below short-term liquidity
🔸 Liquidity Sweep:
Quick wick below 105,250 acted as a stop hunt for early shorts
Price reclaimed the OB immediately after → classic Smart Money trap
🟩 Entry Zone (OB Zone):
105,636–105,250 range
Confluence with minor bullish imbalance and structure support
Price barely tapped the zone before launching higher
📈 Upside Target:
TP marked at 108,979 — prior liquidity pocket and untested highs
Large green zone shows ideal RR (approx. 1:6)
First obstacle: minor resistance at 106,750, but momentum looks strong
🟥 SL Placement:
Safely below OB at ~105,161
Below liquidity sweep zone = strong invalidation
🧠 Why This Setup Works:
✔ Price moved impulsively into the OB
✔ OB lines up with previous structure support
✔ Rejection + strong bullish candle = confirmation
✔ No significant resistance until higher liquidity zones (108K+)
This is classic SMC execution: trap, sweep, OB tap, and send. Let retail panic — we follow footprints.
💬 Ninja Wisdom:
"Smart Money doesn’t chase price — it traps and collects."
This was a clean confirmation of a bullish continuation after reclaiming control from liquidity grabs.
📍 Save this chart – this setup could explode into a full bullish swing
💬 Drop your thoughts: Are we headed to 109K or pausing at resistance?
👣 Follow @ChartNinjas88 for more sniper-level BTC/ETH/Gold plays

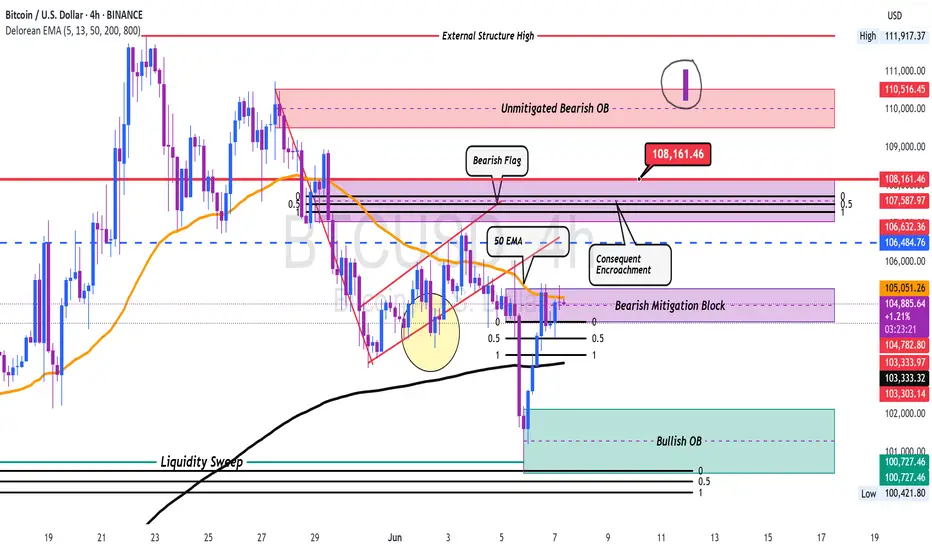
SELL BTCUSDBTCUSD price could start declining from this supply area. There seems to have been a bullish break however, it may be a fake out so wait for price to fall back inside
Bitcoin price prediction for the next 12 monthsMy simple analysis of Bitcoin, please don't hesitate to comment your feedback. Of course this is just drawings on a chart so don't take it too seriously. Hope everyone is having fun with Bitcoin it used to be harder to find assets like this but fintech has made it easier to build wealth.
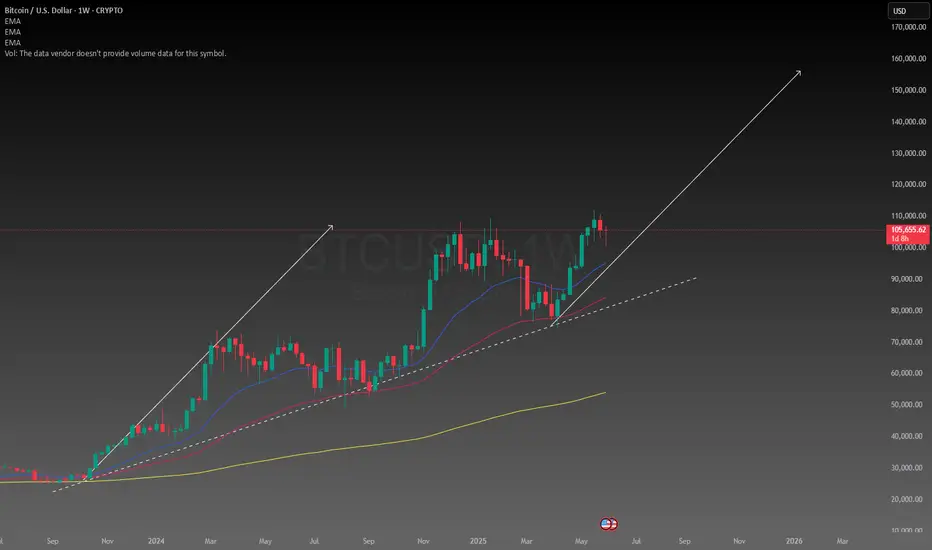
BITCOIN - THE EXACT SCENARIO this is how i predict the patterns of Bitcoin in the next few weeks, a Dip is necessary for a huge pu,p by the end of this year
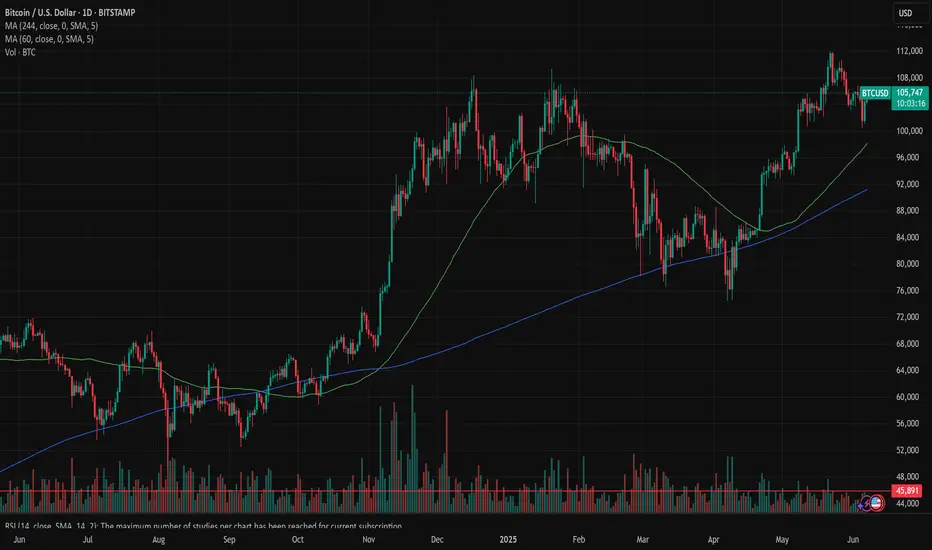
Bitcoin: will $105K prevail or not?After a spike in price on May 22-23rd, the price of BTC continued with a consolidation, moving the price toward the lower grounds. Fridays stronger than expected US jobs data returned the optimism among market participants, bringing back the price of BTC toward the levels around the $105K, where BTC is ending this week. The lowest weekly level reached was $100.754 on one occasion.
The RSI was pushed at levels below the 50 level, around 45, but is still ending the week at 52. This is an indication that market participants are slowly starting to eye the oversold market side. The MA 50 continues to strongly diverge from MA200, without an indication that the cross might come anytime soon.
Since the peak level was reached as of the end of May, the BTC was traded with lower highs and lower lows for the rest of the period. This is a clear indication that some short consolidation is ahead. In the technical analysis this formation is imposing the question, where this trend ends? One possibility is that BTC will again test the $100K, which was the lowest level reached during the previous week, on a short occasion. This level could also be treated as a psychological level for investors. The second option would be a break of the $105K level, which is currently tested, to the upside, where BTC will seek higher grounds, probably around $108K. Both scenarios currently have equal probabilities. Which one BTC will choose, it will be clearer at the start of the week ahead. Until then, the $105K is the level to watch closely, will it prevail or not?
Bitcoin to 168K Cup&HandleI'm seeing a cup and handle formation.
From 109K January 2025 to 111K May 2025.
The handle is healthy correcting to around 33% of the cup depth to 100K.
If this is correct I would expect Bitcoin to reach around 169K within the next 6 months.

BTC cycles and levels long term The highs and lows are shrinking in percentage terms. The cycles are still about the same. Here are the estimated cycles and levels of high and lows of those cycles. Not trading advise.

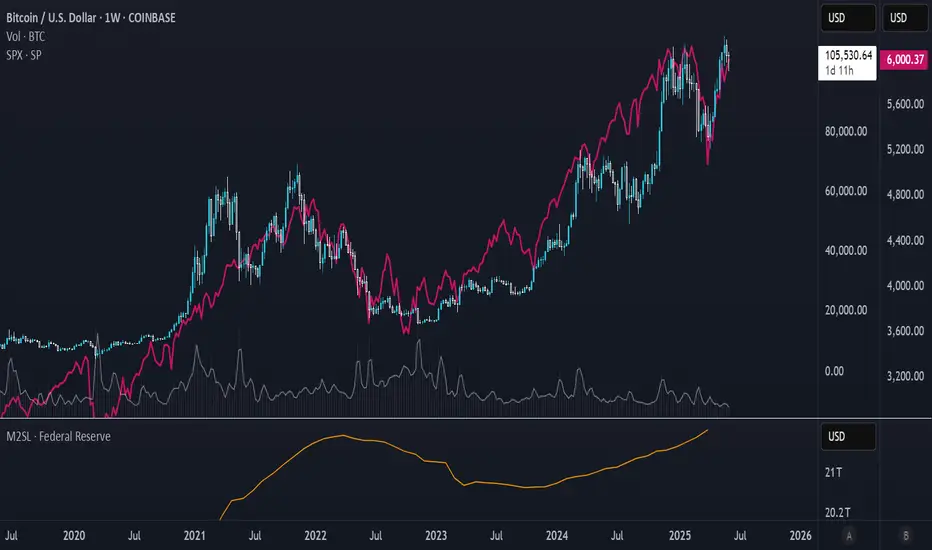
BTC is basically SPX with a higher multiplesince Wall Street got in we actually got significantly more correlated (obviously)
(it wasn't as much prior to 2021)
BTC has basically become SPX with a higher multiple.
Do with that what you will
The magic fractal wave of BTCWell it is very interesting pulsation of BTC. ATH > Crash > New ath > Biger crash > recovery > Old ath > crash
I have pretty accurately predicted this cycle. I think we will see 150K this year and then crash to 77K in 2026 and then climb up to 0.5 Mil.
Tell me what you see.

BITCOIN - HTF.HTF analysis on Bitcoin:
Anyone with eyes can read the Monthly structure and bias as being bullish, April swept the prev ATH at 108K, tapping the 111K levels, before selling off sharply (to be expected, price must come down, to go up, after all!). - Monthly context shows we need to do just that, and this week, we did!
I had the target as the Weekly Bullish FVG residing at 100K, and expected the reaction we have seen, however, now is where it gets interesting - as we can see on the Daily (TF of the chart in this example), we can see that price ran a daily ITL as well as 4H liquidity levels, on its way into the W FVG (happened on Thurs, not Fri, which was interesting considering the RFN on friday), and has since shown bullish displacement back to the upside.
Current Daily targets are 105-108K levels, if Bulls can recapture this area, we can expect some form of consolidation before another leg up. The ETF's (in my opinion) were the institutions and their 'Trojan Horse's' - so the higher we go, the more we can expect sell offs in the form of profit taking via institutional profit taking.
Conclusion - BULLISH BIAS, WITH THE HTF TARGETS BEING DAILY HIGHS, AND THE OVERALL MONTHLY TARGET OF A NEW ATH - 125K is the next logical HTF target based off a trend-based Fib extension.

BTCUSD: Bearish Signal from Mother Candle on Daily ChartMother Candle - A big candle that engulfs the subsequent candles.
The Mother Candle formed on Dec 5th on a Daily Chart still holds good, with a Bear Counter Attack and a Fake Break Down. With the Rising Wedge to get to the Mother Candle, there is a very high probability that this could be a bearish reversal.
If there is a Break Down on the Mother Candle, there are known support levels from GETTEX:92K to $85K. The price could dip down to one of these levels.
Let's see.

Building Liquidity: What It Really Means🔵 Building Liquidity: What it really means
Professional traders often need liquidity (buyers and sellers) to enter/exit large positions without moving the market too much.
This means manipulating the market within a pre-determined range, which serves as the operating center for everything that follows.
🔹 How is liquidity built
Price Ranging: Sideways consolidation before big moves attracts both buyers and sellers.
False Breakouts (Stop hunts): Price may briefly break support/resistance to trigger retail stop-losses and fill institutional orders.
News Timing: Pro traders often execute during or just before major news when volatility brings liquidity.
🔹 How can you spot a Liquidity-building zone
🔸 Volume
Unusual spikes in volume: Often indicate institutional activity.
Volume clusters at ranges or breakouts: Suggest accumulation/distribution zones.
Volume with price divergence: Price rises but volume falls = possible exhaustion. Volume rises and price consolidates = potential accumulation.
🔸 Price Action
Order Blocks / Imbalance zones: Sharp moves followed by consolidations are often pro trader footprints.
Break of Structure (BoS): Institutions often reverse trends by breaking previous highs/lows.
Liquidity sweeps: Price moves aggressively above resistance or below support then reverses = stop-loss hunting.
🔸 News Reaction
Watch pre-news volume spikes.
Look for contrarian moves after news — when price moves opposite to expected direction, it often reveals smart money traps.
Analyze price stability post-news — slow movement shows absorption by pros.
Wick traps and reversals around news events = stop hunting.
🔸 Narrative is Everything
Higher timeframe trends show intent.
Lower timeframes show execution zones.
Look for alignment between timeframes in a specific direction.
🔹 Why do whales move the market in an orderly manner
To fill large positions at optimal prices.
To create liquidity where there is none.
To trap retail on the wrong side of the move.
To trap other whales on the wrong side of this move.
To rebalance portfolios around economic cycles/news.
🔹 Professionals never forget what they've built
When you track price, volume, and news, you’ll find specific bars that form areas that are the foundation for the short-term direction.
This is pure VPA/VSA logic, the interplay of Price Analysis ,Volume Analysis and News, where each bar is not just a bar , but a clue in the story that professionals are writing.
When you monitor volume, price, and news together and perform multi-timeframe analysis, it becomes clear what the whales are doing, and why.
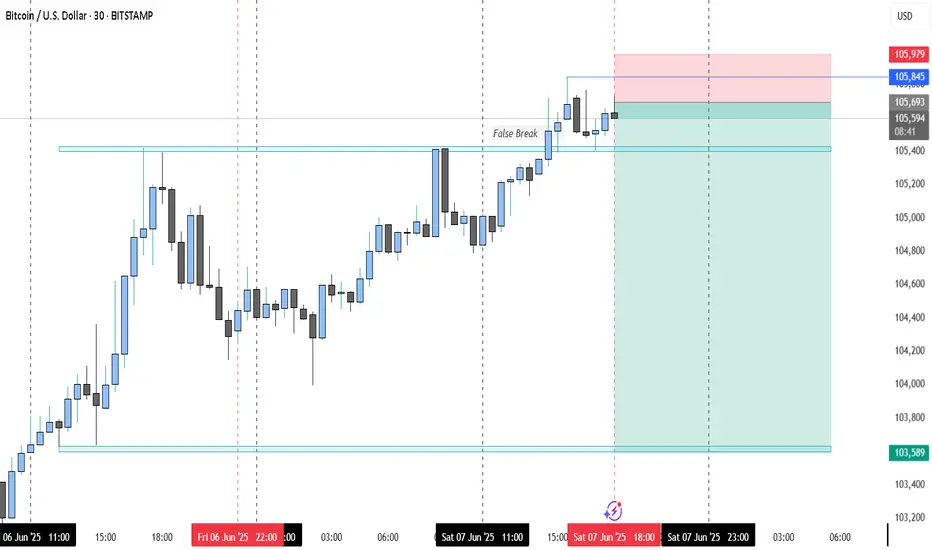
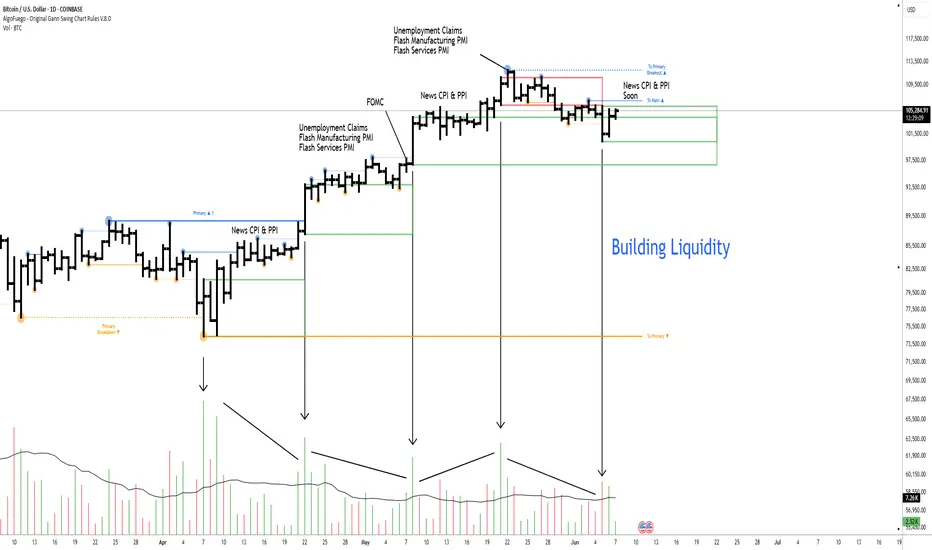
🔹 From the chart above
The market reached a weekly resistance level and then pulled back slightly after whales triggered the stop-losses of breakout traders.
Prior to the breakout, whales had accumulated positions by creating a series of liquidity-rich buying zones on the daily timeframe.
It's essential to understand the broader context before choosing to participate alongside them—whether you're planning to buy or sell.
🔴 Tips
Use volume and price analysis together, not separately.
Monitor any unusual volume bars before economic market news.
Monitor news and volatility spikes to detect traps and entries.
Combine this with liquidity zones (support/resistance clusters).
Build a "narrative" per week: What is smart money trying to do?
A smart trader understands the tactics whales use, and knows how to navigate around them.
BTC/USD Trade Setup - June 7, 2025I'm looking at a potential bullish breakout trade on Bitcoin. Here's the breakdown of my idea:
📊 Context & Structure
Price has broken out of a consolidation zone after reclaiming a prior high-volume node (visible from the Volume Profile on the left).
We see a clear ascending triangle forming, suggesting bullish continuation.
Volume profile shows strong support below current price, with acceptance building at the current level.
📈 Entry & Risk Management
✅ Entry: $104,952 (just above triangle resistance).
❌ Stop Loss: Below the higher low structure and volume gap at $104,401.
🎯 Target: $106,854 — previous high/POI area, aligning with upper resistance on the profile.
📐 Risk-Reward Ratio
RRR: ~3:1, offering a strong reward relative to risk.
📌 Additional Notes:
Waiting for a breakout confirmation candle before full entry.
Strong rejection below $104,700 would invalidate the setup.
This post conveys a clear technical story and shows your reasoning using price action, market structure, and volume profile. Let me know if you'd like a more concise or visual version!

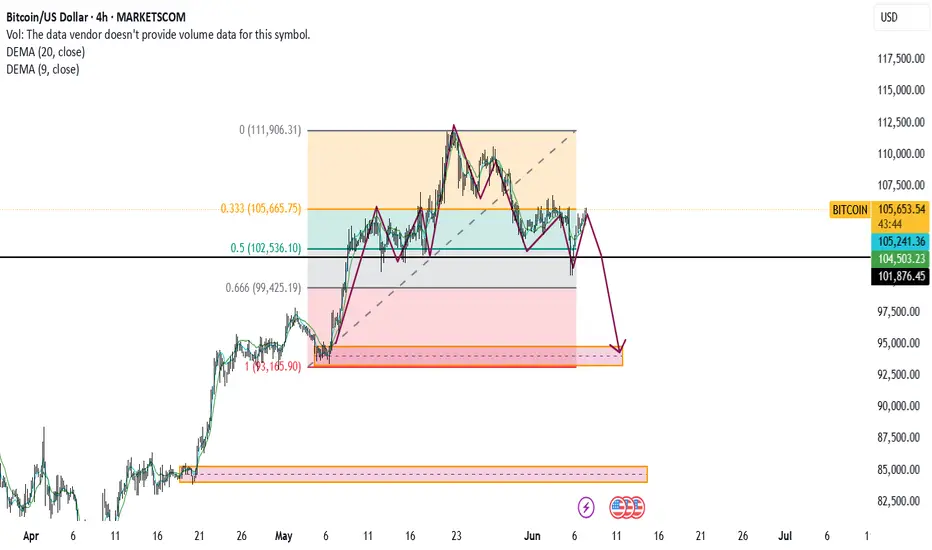
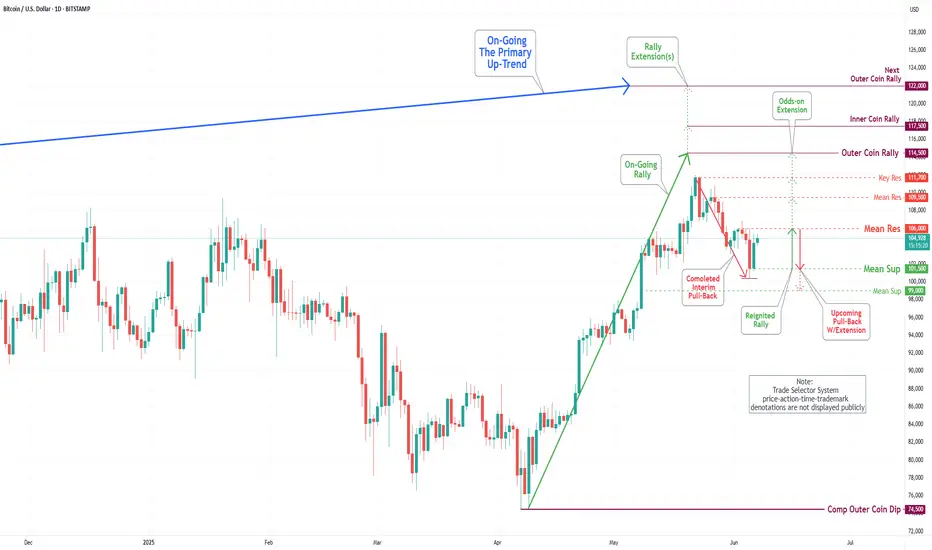
Bitcoin(BTC/USD) Daily Chart Analysis For Week of June 6, 2025Technical Analysis and Outlook:
Bitcoin has experienced a notable downturn throughout the week; however, on Friday, it made a substantial upward movement, effectively recovering all previous losses. It is currently positioned to establish a temporary pause at the Mean Resistance level of $106,000, which may facilitate the development of upward momentum from this point. This situation may pose challenges to achieving the Inner Coin Rally target of $ 114,500, which is contingent upon the Mean Resistance at $ 109,500 and Key Resistance at $ 111,700. It is essential to acknowledge the possibility of a downward pullback from the Mean Resistance level of $106,000, which could result in a decline toward the Mean Support level of $101500.
BTC STILL BEARISHI am bearish on BTC until a strong bodily close above the bearish OB to confirm Bullish and possibly a new High