#Bitcoin: Local Relief But Lower High Expected Price bounced ba#Bitcoin: Local Relief But Lower High Expected
Price bounced back above 105K, but structure still suggests a lower high formation. A revisit to the 100K zone remains likely before CPI data. Clean re-entry opportunities may emerge if the zone is tested again. Patience key.
BTCUSD.P trade ideas

BTC to retest 100kBTC will retest support at $100k IMO, then 5 wave up to $120 top. We will see a decline after that, possibly a bear market start.
My price action prediction is :
2026 is a bear market, target $60k -$50K,
2027 is a consolidated slight move up $70k-$90k.
end of 2027, spring of 28, we see a massive run up to $500k to $750k
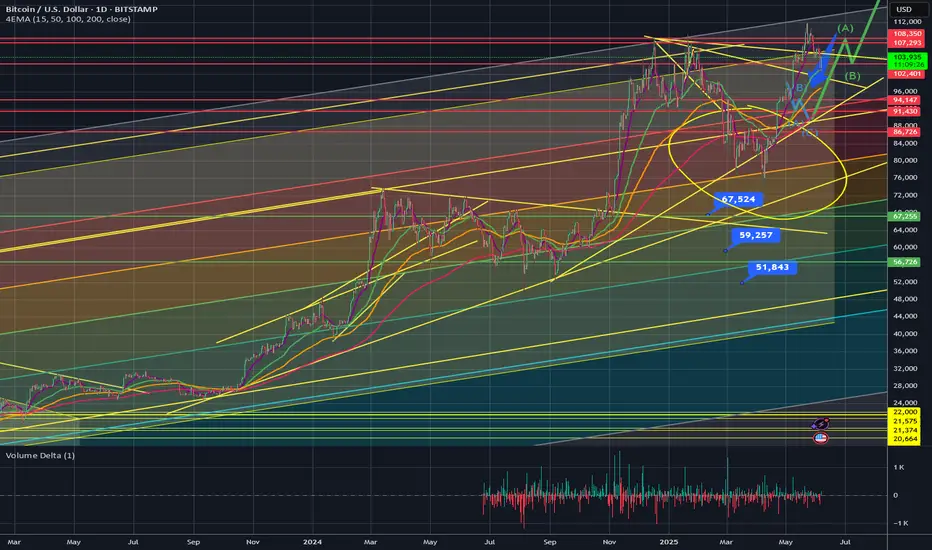
₿ BTC: Delay Tactics in Wave B Bitcoin dropped hard yesterday, throwing a wrench into the expected climb toward the top of green wave B. This bounce was supposed to stretch into the upper blue Target Zone between $117,553 and $130,891, which we flagged as a smart area to take partial profits or layer in short hedges. That zone still stands—BTC just isn’t ready to hit it yet. The current pullback suggests we’ll see more sideways-to-lower price action before green wave B wraps up. Once it does, green wave C should drag Bitcoin into the lower blue Target Zone between $62,395 and $51,323. That’s where we’re looking for orange wave a to complete. After that, a countertrend rally in wave b could pop up—before wave c wraps the entire corrective cycle and finishes blue wave (ii). We’re also watching an alt.(i) breakout scenario (30% probability). In that case, BTC would blow through the $130,891 level early, bypassing the expected dip and reaching new highs faster than projected.
📈 Over 190 precise analyses, clear entry points, and defined Target Zones - that's what we do.


Did you know current line of rejection was 1st used in Feb 2017
The chart says it all
This is a chart I have used here iften but never zoomed out.
That line has rejected us 3 times now this cycle.
It was just once in 2017 but once Crossed, tested and held, it is a mighty line of support.
This maybe why the Bears do not want us to cross it......
But I have little doubt that Bitcoin has the ability to cross it....
There aew many reasons why we have not done so, Technical and Macro and I really am beginning to think that we will have a lazy Summer, ranging across, maybe reaching another small ATH before we really go for it in late Q3 / Q4
BUT, I could be wrong.
Just my opibion

Pre Market update SPX USOIL GOLD BTCWe did get a pump after the numbers today, I expect 6020 to be reached on SPX. Gold is at support , so far. If it breaks down it's bearish. Oil is trying to breakout, but nothing confirmed. BTC had a nice bounce, but probably goes lower soon.

my btc history chartbla bla its a chart i been using for past few years which has been working for me
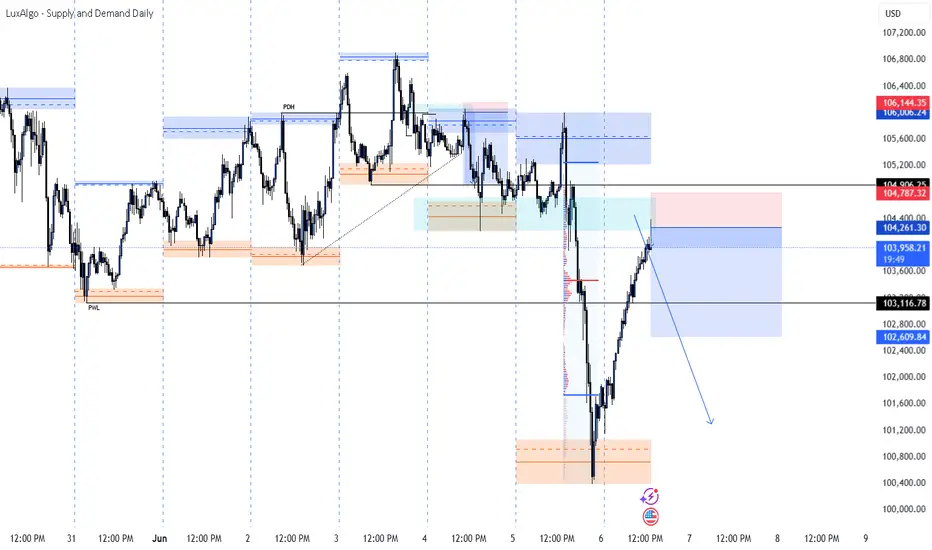
BTCUSD Technical Outlook – Supply Zone Reaction Likely?Price has aggressively recovered from the demand zone around $101,000–$101,500, initiating a sharp bullish leg into a previously defined supply zone between $104,260–$104,787. This region also overlaps with a prior inefficiency and strong sell-off area.
📌 Key Highlights:
PDH (Previous Day High) has been swept.
Price is now entering a confluence of resistance:
🔹 Bearish order block
🔹 Supply zone
🔹 Volume imbalance filled
Clear reaction anticipated as buyers begin to slow down near $104,260–$104,787.
Lower timeframe structure suggests bullish exhaustion as we tap into this zone.
📉 Bias: Bearish
💡 Scenario: Looking for potential rejection from current levels for a move back into $103,116, with deeper downside targets near $102,600 and possibly back into the demand zone below $101,500.
Trade Setup Idea:
Entry: ~$104,260–$104,787
TP1: $103,100
TP2: $102,600
SL: Above $104,800
Invalidation: Clean break and close above $104,800 on higher timeframes.
🧠 Watch price action closely within this zone before entering. Patience will be key for precision.
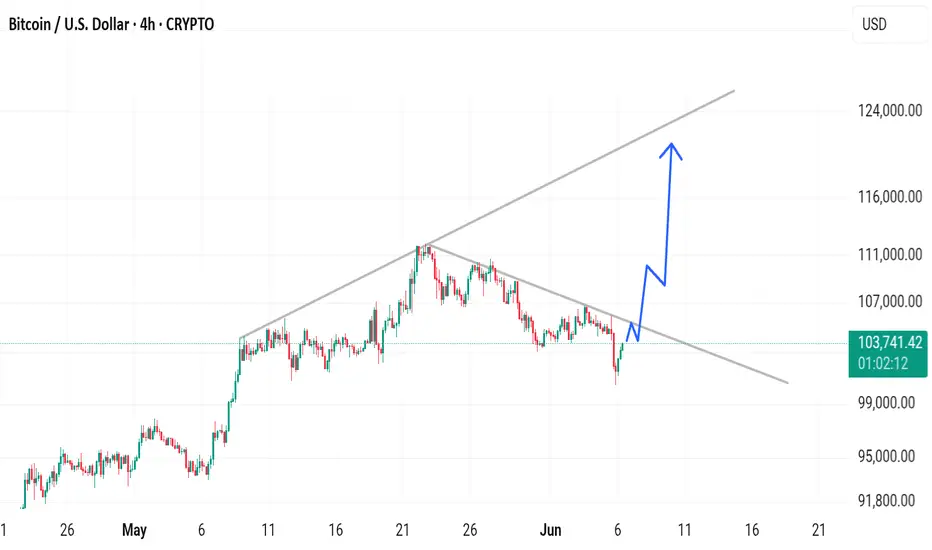
Bitcoin Analysis UpdateThe price growth is currently in the form of a symmetric pattern, but without the expected and necessary volumes to continue the trend. Therefore, I must say that I am waiting for a proper correction, which will create a very good buying opportunity. Be very cautious in your trades.

BTCAfter yesterday's Trump and Musk Dump. Today BTC looking so strong and if it continues like this it may break the downtrend then it will go to 120k sooner than July.
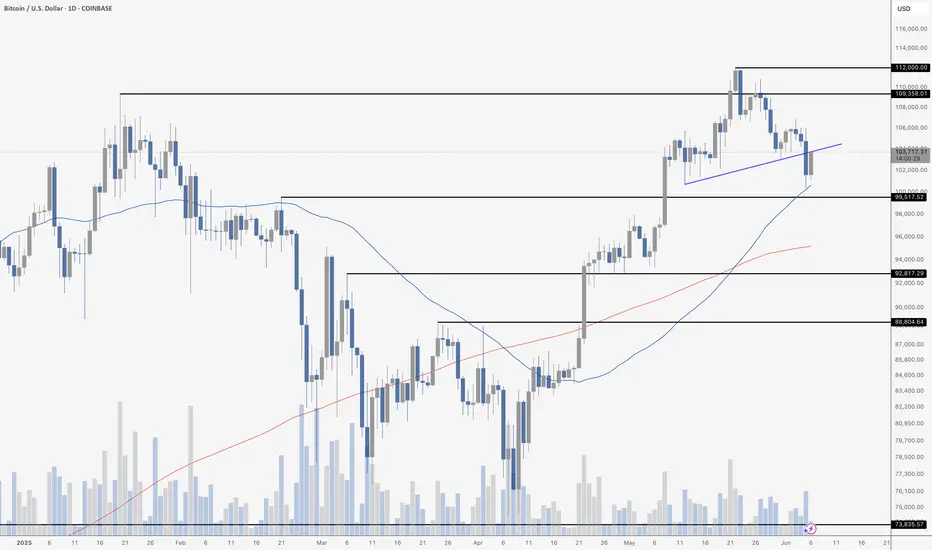
BTC BREAKS DOWN... AND BOUNCESThe Bitcoin daily chart is presenting a technically rich picture, with clear structure and key moving average interactions. Most notably, we’ve seen a breakdown from a classic head and shoulders pattern. The neckline has been broken decisively and is now being retested from below – a common behavior when former support becomes resistance. Traders often watch this level closely for rejection or reclamation.
Despite the breakdown, price is currently finding support at the 50-day moving average, which is rising and suggests underlying trend strength. This bounce has brought Bitcoin back to retest the neckline zone, offering a potential inflection point. A reclaim above the neckline could invalidate the bearish pattern and reignite momentum. Conversely, if price is rejected here, the head and shoulders may play out further, with targets aligning near the $92K level.
Momentum is still neutral to slightly bullish, and volume has picked up on the bounce – which is a positive sign. All in all, this is a key moment for Bitcoin. Holding above the 50 MA and reclaiming the neckline would shift the bias back toward the bulls.
Losing the 50 MA could invite further downside.
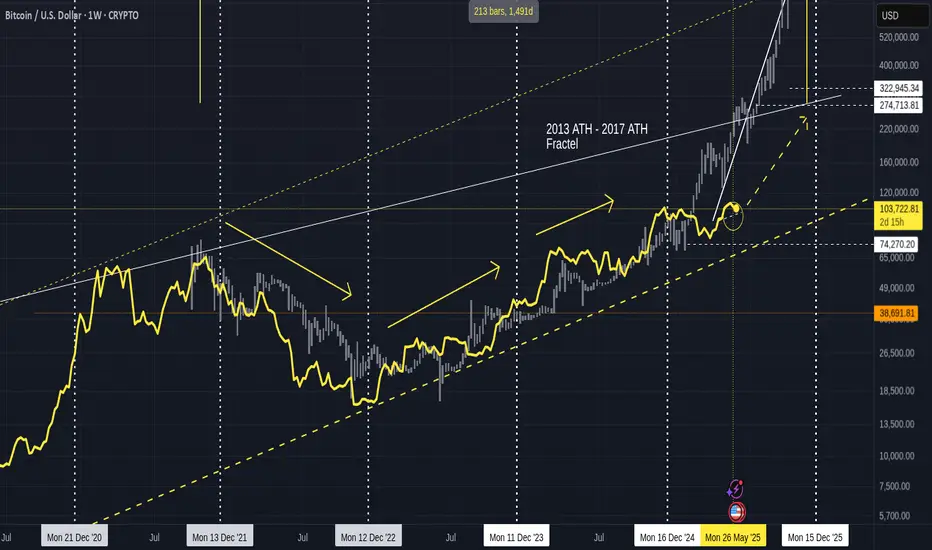
Quick BITCOIN update using old Fractal chart - a small red June
Bitcoin appears to be taking a rest when it is strictly not required.
We are heading towards the 2nd dashed arrow, which as I pointed out months ago is a very possible and more realistic path for Bitcoin to take this cycle.
We have left the 2013 - 2017 Fractal and yet are likely to follow the idea of moving higher to a new ATH from this level off the Fractal.
PA entered that circle I drew back in Feb and is still in it right now, as we can see in the chart below
We can also see how PA has bounced off the 50 SMA on this daily chart.
This does NOT guarantee a continued move higher but it may offer some levels of support.
Should this fail, we do have various levels of support down to around 94K
I will refer back to a previous post and mention that to some extents, I am expecting a RED June. This does not need to be a Big candle, just 1 usd less than the open price wil create that.
104648 was the open price, so, we can easily stay above 100K and create that red candle.
Why do we want a red candle..?
Because, to put it simply, statistically, we have a better chance of continued monthly Green candles after a red june this time
I will attach the chart below so you can read about this in more detail.
This may or may not be good for ALTS>.... but I do not have many now.....just my preference
$BTC relative to $DXY Bullish Trend unbrokenThis chart shows that the CRYPTOCAP:BTC relative to TVC:DXY Bullish Trend is still unbroken

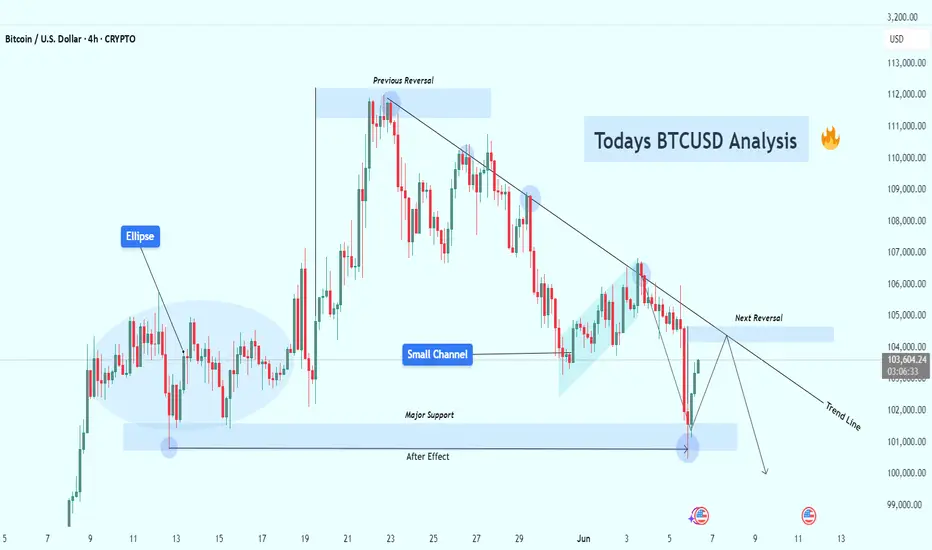
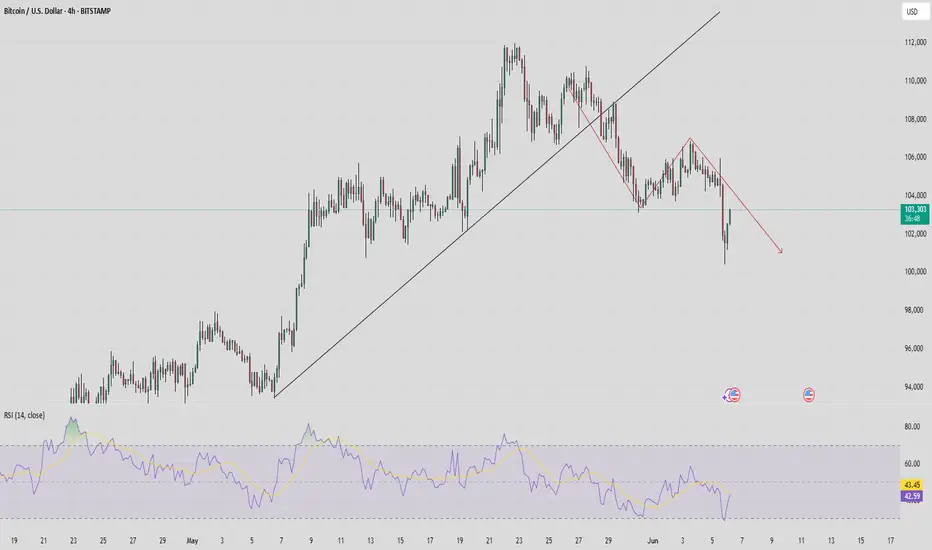
BTCUSD at Decision Point – Rejection or Breakout Ahead? (4H)Bitcoin is currently trading around $103,500, and the price action is presenting a textbook technical scenario with multiple confluences. This chart is rich in structure — from rejection zones and trendlines to channel breakdowns and historical support retests — making it a critical area for traders to observe.
🔍 1. Previous Reversal Zone
The chart shows that Bitcoin previously faced a strong rejection near the $110,500–111,000 level. This created the first lower high, signaling the end of bullish momentum and the start of a trend shift. Every subsequent touch of that zone resulted in rejection, confirming it as a major supply zone.
📉 2. Descending Trendline – Dynamic Resistance
After multiple failed attempts to break above, price has formed a clean descending trendline that is acting as dynamic resistance. Each touch along this trendline has led to a short-term selloff, and price is now approaching this line again, near the Next Reversal Zone.
📌 This confluence increases the probability of another rejection unless there's a strong bullish breakout with volume.
📊 3. Bearish Channel & Breakdown
Before the recent fall, Bitcoin was trading inside a small bearish channel. This type of consolidation often results in continuation — which we saw with the downside breakout. This breakdown also increased bearish momentum and pushed BTC into the major support area.
🧊 4. Major Support Zone – The Battle Ground
Marked around the $101,000–102,000 range, this zone has acted as a strong demand area multiple times. The most recent bounce suggests that buyers are still active here. This could be the last defense for bulls in the short term.
🧠 If this zone breaks, we could see price falling toward the psychological level of $100,000 or even lower.
🌀 5. Ellipse Zone – Accumulation Structure
Early on the chart, an ellipse highlights a horizontal accumulation zone where price moved sideways before breaking out upward. This shows how smart money often enters during quiet phases before explosive moves. Watching for similar signs can provide strong trade setups.
🔄 6. Next Reversal Zone – Watch Closely
Price is now approaching the Next Reversal Zone near $104,500–105,000, which aligns perfectly with the descending trendline. This is a high-probability rejection zone where traders should be watching for bearish confirmations like wicks, pin bars, or bearish engulfing candles.
📌 Two Possible Scenarios
🟥 Bearish Scenario (High Probability):
Price touches the Next Reversal Zone and gets rejected.
We could see a drop back to the Major Support Zone.
If support breaks, expect a move toward $100K–99K in the coming sessions.
🟩 Bullish Scenario (Low Probability Without Volume):
Price breaks and closes above the trendline with strong bullish candles and increased volume.
In that case, BTC could rally toward the $107K–108K resistance and potentially flip the trend bullish.
💡 Trading Insight:
Fridays usually have low volume, leading to unexpected wicks and false breakouts. That’s why it’s important to:
Use small lot sizes
Wait for confirmations
Avoid overtrading before weekend closes
🧠 Final Thoughts:
This is a classic setup — consolidation after trend, rejection zones, trendline resistance, and strong support areas all in one chart. Whether you’re a price action trader or a structure-based analyst, this chart offers a powerful decision point.
Stay patient. Let the market reveal its hand. The next few candles around this trendline will likely dictate the next 1–3 day direction for BTC.
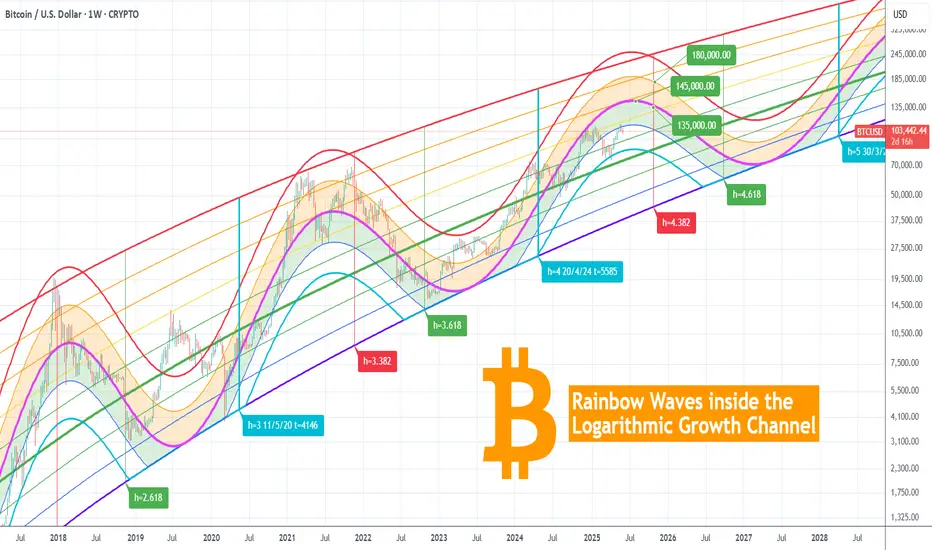
BITCOIN Log Channel and Waves show we're nowhere near the top.This is Bitcoin (BTCUSD) on its Logarithmic Growth Channel with the use of Rainbow Waves on it. This model accounts for the Halvings (light blue vertical lines) and with the use of Fibonacci Time extensions, it estimates the potential Cycle Bottoms (green vertical lines) and Tops (red vertical lines) within the Parabolic Growth Curve.
A fair value is estimated around the purple trend-line (zone top and bottom) as well as a maximum (red trend-line) and minimum (light blue trend-line) wave.
Interestingly enough, BTC hit that minimum wave trend-line on the April 07 2025 Low for the first time since June 17 2017, making it the strongest buy signal we could get at this stage of the Cycle.
So based on all the above, Bitcoin is nowhere near the top of its Cycle and this isn't just because it hasn't yet touched the next red vertical line (Time Fib 4.382) which is on October 27 2025, but also because it is currently trading below the Fair Value Zone (even below its bottom half).
Both previous Cycles topped considerably above that Fair Value Zone and almost hit the maximum wave. Even if by October 27 2025, Bitcoin 'only' hits the purple (Fair Value) trend-line, it would have reached $135000 and if earlier it can even hit $145000. That is the bare minimum based on that model. If it hits the top of the Fair Value Zone by October 27, then we can see prices as high as $180000 even.
Which price do you think we are more likely to see? Feel free to let us know in the comments section below!
-------------------------------------------------------------------------------
** Please LIKE 👍, FOLLOW ✅, SHARE 🙌 and COMMENT ✍ if you enjoy this idea! Also share your ideas and charts in the comments section below! This is best way to keep it relevant, support us, keep the content here free and allow the idea to reach as many people as possible. **
-------------------------------------------------------------------------------
💸💸💸💸💸💸
👇 👇 👇 👇 👇 👇
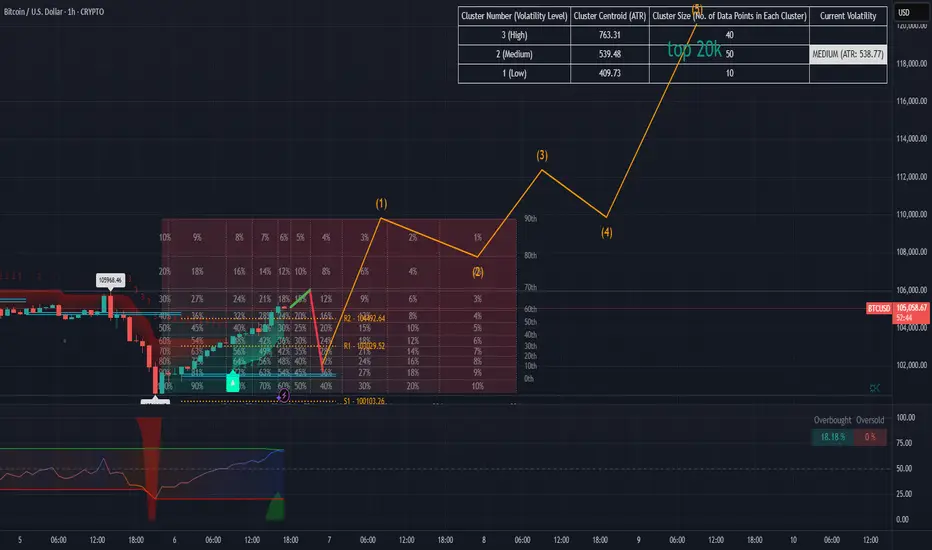
#Bitcoin - Pivot Point is $105163.50Date: 02-06-2025
Pivot Point: $105163.50 Support: $1 03896.91 Resistance: $106437.54
Upside Targets:
Target 1: $107289.52
Target 2: $108141.50
Target 3: $109258.25
Downside Targets:
Target 1: $103041.20
Target 2: $102185.50
Target 3: $101068.75
#Bitcoin

check the trendGiven the 161.8% level being broken, the continuation of the downward trend and correction is likely.
As long as the price fluctuates below the red resistance area, the continuation of the downward trend is likely.

“NFP Showdown: Will the Dollar Crumble or Come Back Swinging?”🔥 It’s Nonfarm Payrolls Friday – and this month’s report could be a game-changer for the markets. With the U.S. economy showing signs of fatigue, could this be the catalyst that finally breaks the dollar? Or will a surprise upside shock flip the script?
In this video, I break down the key drivers behind today’s NFP, how DXY, Gold, and Bitcoin are likely to react, and exactly how I’m positioning myself before and after the release.
Whether you’re trading the spike or waiting for the dust to settle, this is a market moment you can’t afford to miss.
📈 Trade smart. React fast. Let’s dive in.

BTCUSD is entering a bear trendBitcoin recently broke the support zone between the key support level of 102,150 (which has reversed price several times since early May) and the 50% Fibonacci retracement level of the bullish impulse from last month.
The break of this support zone has accelerated the short-term positive ABC 2 correction, which started earlier from the major multi-month resistance level of 110,000
Bitcoin is likely to fall to the next support level of 98,000.00 (previously strong resistance level in February).
BTC update: are we dropping to 93k?As you can see btc has formed a head & shoulders on the daily chart and although we are going up a bit more I think it is just the retest of the neckline of the H&S. This is in line with my previous analyses of btc where I already indicated that we are going to correct to the support zone around 93k where we also have the 0.5 fobonacci level I hate to say it but for now I remain bearish on btc. I will keep you informed (don't forget to like my analyses) tradingview.sweetlogin.com

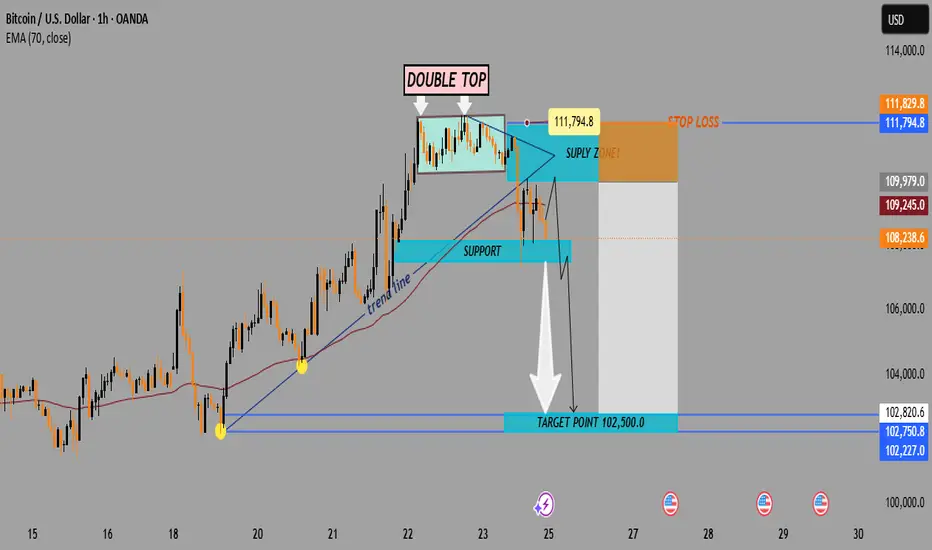
Bitcoin (BTC/USD) 1H Chart Analysis – Double Top Signals BearishPattern Formed: DOUBLE TOP
⚠️ Bearish Reversal Pattern Spotted!
📍 Formed near 111,794.8
⬆️ Price tested the top twice and failed – strong resistance confirmed!
Key Zones:
🔶 SUPPLY ZONE (Resistance):
🟧 111,794.8 - 111,829.8
🔼 Expect selling pressure here!
🔷 SUPPORT Zone (Broken!):
🔻 Price fell below this level, confirming a bearish breakout
🟩 TARGET ZONE:
🎯 102,500.0
✅ This is the likely drop target based on the pattern
🧊 Other minor supports:
* 102,820.6
* 102,750.8
* 102,227.0.
Indicators:
📈 Trend Line
* Supported the price during the uptrend
* ❌ Now broken — indicates momentum shift
📉 EMA 70 (Red Line)
* Current Price (108,238.6) is below EMA 70 = 109,245.0
* Indicates bearish pressure.
Trade Setup:
🔽 Short Entry Idea: After support break
🛑 Stop Loss: 111,829.8
🎯 Take Profit: 102,500.0
⚖️ Risk-Reward looks attractive!
Summary:
📉 Bearish bias confirmed by:
* Double Top pattern
* Supply zone rejection
* Support break
* EMA crossover
🚨 Traders Watch Out: Bears are in control — next major stop likely at 102,500.0!
Head and shoulder pattern forming?! Everyone always believes that a bull run has a long way to go—until it doesn't. Having experienced these cycles multiple times, I see similarities that help in understanding them. Could Bitcoin rise from here and hit $500k or more? Of course, but it could also crash to below $40k. The key question is: how much energy is there in the market to drive it up? When the media starts publishing articles suggesting that buying just 0.1 Bitcoin could make you a fortune, it's time to consider that we might be at the top. Almost all articles predict Bitcoin will reach significant heights, but often by the end of the decade. Why would institutions load up on BTC now at its all-time high, with the exception of MicroStrategy, whose average cost is still under $70k? Many have a lot to lose and can't see the potential at this point. Bitcoin simply isn't at an attractive price for accumulating more.
The technical trend suggests that we may be nearing the end of this bull run (As I predicted it bounced off 112k). Unusually, this current bull run began before the halving, and combined technical analysis indicates we are very close to a peak. We could be forming a head-and-shoulders pattern (or not), which is a strong indicator of a top, at least in the short term. Either way, with very low trading volumes, a price close to its all-time high, and bearish patterns, if you’re not a buyer, you might consider becoming a seller. Reatil investement is also very low and many are paying for food due to the impacts of inflation, with very few people in my circles having free capital to buy BTC at these prices. Trade-safe.

BTCUSD head and shoulders patternOn the daily chart, BTCUSD forms a head and shoulders top pattern. At present, attention can be paid to the resistance near 104000. If the rebound is blocked, short selling can be considered. The downward target is 93000-98000 area.
