BTC Market Structure Summary🔹 Market Structure Summary
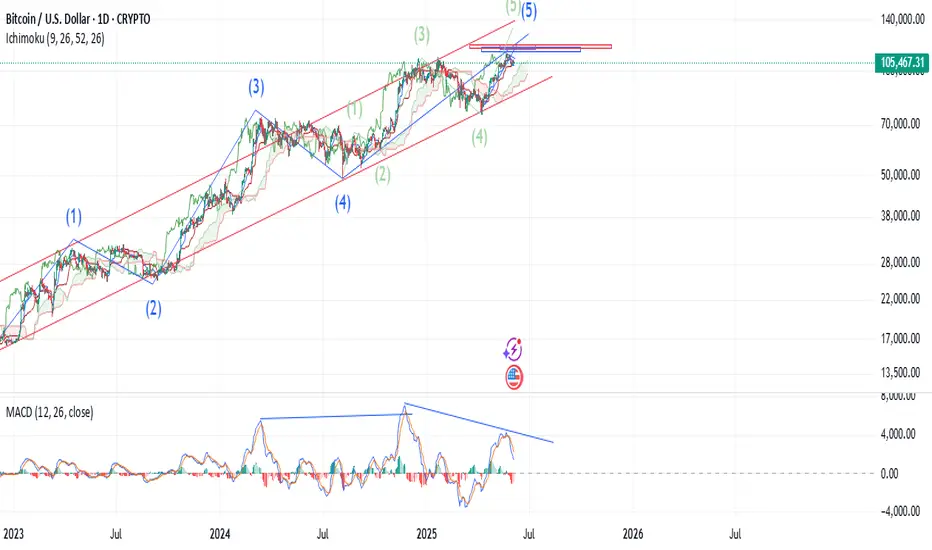
🔼 The impulsive structure (1–5) confirms bullish dominance in the medium term.
🔽 The ongoing ABC correction is healthy and expected in Elliott Wave Theory before continuation.
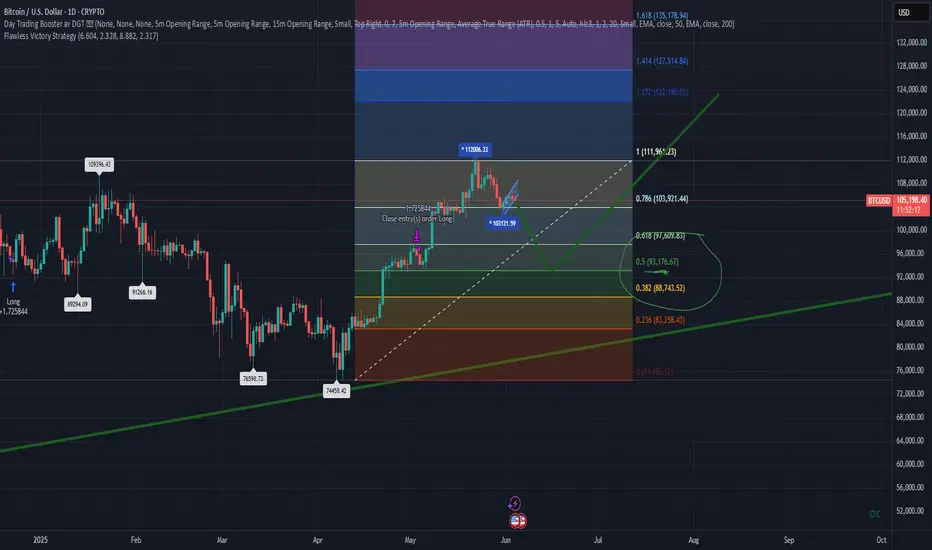
🔵 Once wave (c) completes at the projected zone (78.6%), a new bullish impulse could start, targeting higher highs above the previous ⑤ peak.
BTCUSD.P trade ideas

Bitcoin-is that it for now ? Lazy summer, take off in September?
Not posted this chart for a while but we may find it has become Very relevant to what to expect for the next few months
First thing to note is that PA is once again in TOP of range box and ALSO got rejected off the Long Term Blue line that has rejected BTC PA ATH since 2017. This also coincidened with the 1.618 Fib Extension.
Rejection here was highly likely and given how PA had pushed up, it is not surprising to see PA at least taking a breath.
For me, even though we do have the ability to push higher, I am not to sure we will just yet.
The weekly MACD could offer some credence to this idea
The Arrow points to an area that could turn out to be similar to what we are doing now.
The MACD has begun curling over after a prolonged push higher. While There was strength left, PA took a breath and regrouped.
The Chart below shows this period and how BTC PA reacted...and is circled
This was in Dec 2023 to Jan 2024.
PA had just had a sustained push higher and needed a break.and following a 7 week range, PA moved up another 67%
7 weeks from now brings us to near August.
There are charts that point towards a move in August / September
Here is another chart that offers some confluence to this idea.
The Dotted line is a line of support that PA has used as support numerous times this cycle and currently, is almost bang on the 50 SMA. Assuming that PA goes back down to that and bounces again, a 67% rise takes us back up to the Top of Range
Should we drop that far, to the 50 SMA again, we are in the 92K - 95K zone, scaring a LOT of people, wrecking Leverged players and putting Fear everywhere.
PERFECT FOR BUYING
This area also happens to be the 1.382 Fib extension on the main chart, the next Major line of support below us currently.
Should we fall through that, we reach the Bottom of Range and the intersection with the 50 SMA in.......August
So, we have to wait and see. We can push higher now but to do so would require breaking through that long term Blue line of resistance. I am not sure we can do that just yet.
Also, Should we post a RED June candle, Even a small one, the ideas in the Monthly candle post I recently posted also back up the idea of a lazy summer...... and a move higher around Mid to late August
Stay safe

BTC drop and Bounce targetsBTC need a fib retracement in order to keep going up, I think 0.5 is a bounce target to $120k
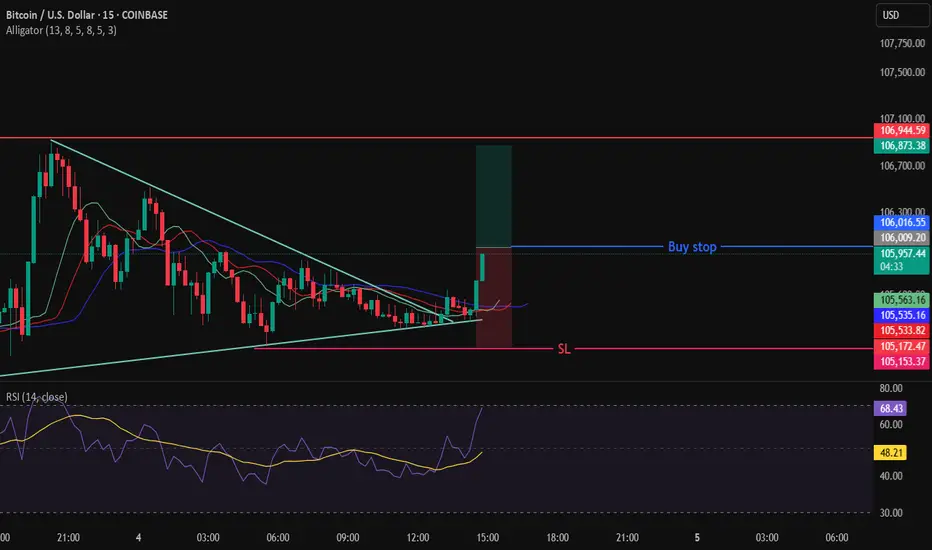
BITCOIN Will Move Higher! Long!
Please, check our technical outlook for BITCOIN.
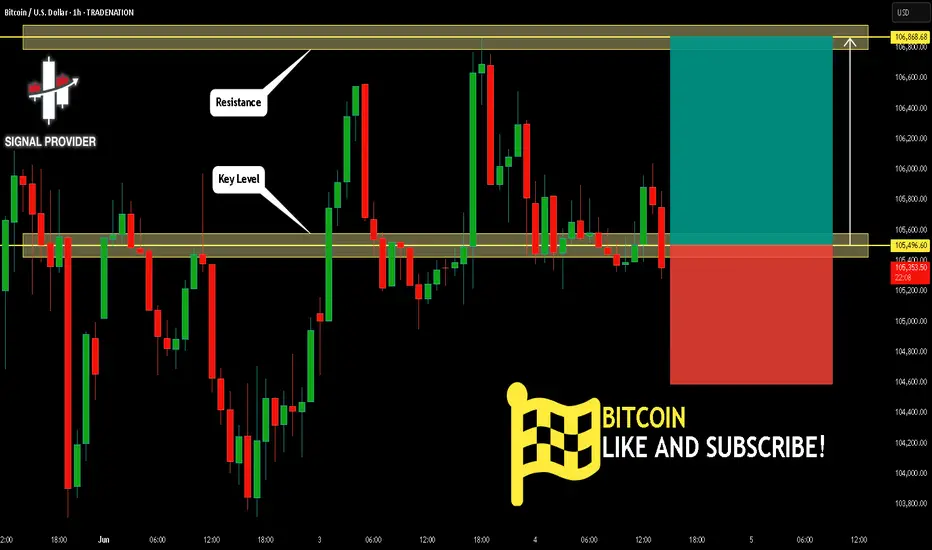
Time Frame: 1h
Current Trend: Bullish
Sentiment: Oversold (based on 7-period RSI)
Forecast: Bullish
The price is testing a key support 105,496.60.
Current market trend & oversold RSI makes me think that buyers will push the price. I will anticipate a bullish movement at least to 106,868.68 level.
P.S
The term oversold refers to a condition where an asset has traded lower in price and has the potential for a price bounce.
Overbought refers to market scenarios where the instrument is traded considerably higher than its fair value. Overvaluation is caused by market sentiments when there is positive news.
Disclosure: I am part of Trade Nation's Influencer program and receive a monthly fee for using their TradingView charts in my analysis.
Like and subscribe and comment my ideas if you enjoy them!
Bitcoin Bear pattern Pair: BTC/Usdt
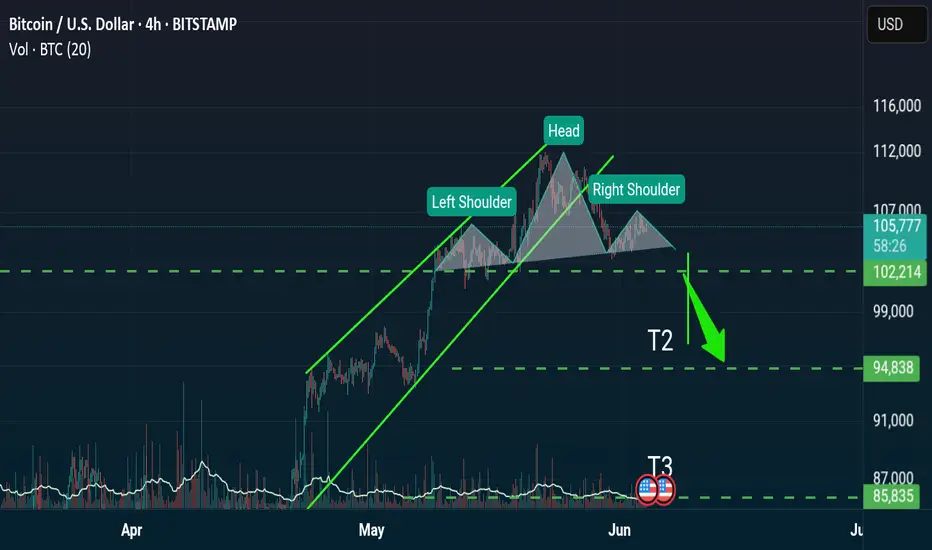
Timeframe: 4h
Pattern: head/shoulders
Rising wedge was breakout prev week, now not need forget about GAP $92 000
Attention always with long/short but cheap chance soon
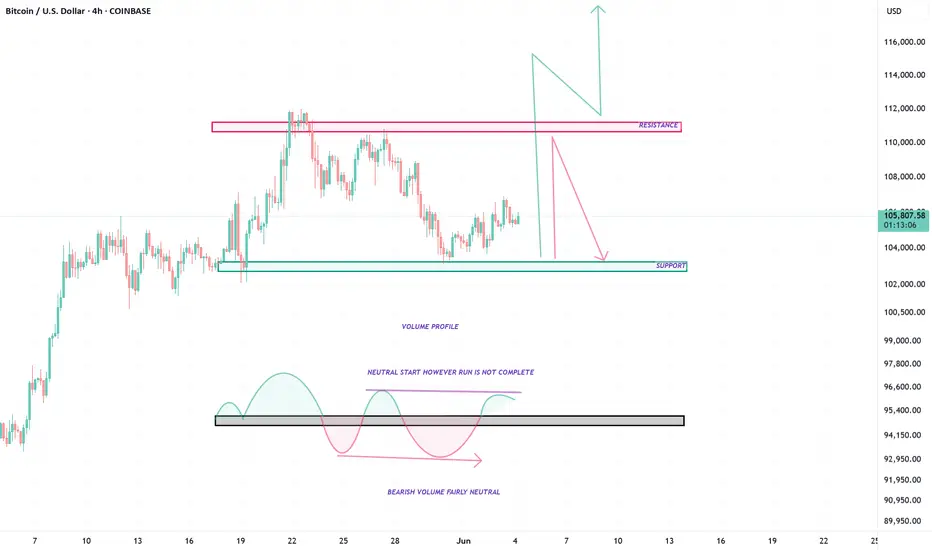
BTC - RUN TO RESISTANCE, WHAT NEXT ?Good Morning Everyone,
Hope all is well. BTC still has some strength left in this push upwards. Odds are that it will squeeze to get to that resistance. Expect either a strong break and further push up or lots of rejection at the resistance zone which will force BTC to renegotiate its supports below.
ENJOY!
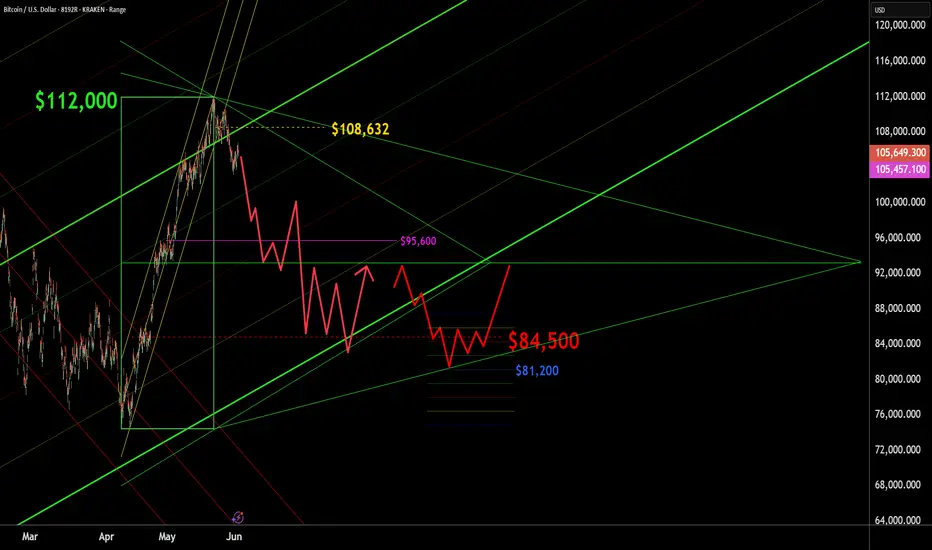
BTC - UPDATE - $84,500 target BTC appears to reluctantly be topping, with a while probability of having already topped at $112,000. My best estimate of the next on boarding price for BTC is in the $84,500 area. Prices above $108,632 indicate I was wrong. Pros could consider shorting to the same number. This is just conversation. And not trading advice. Murrey Math, Elliot Wave , Kumar Wave being employed. See past charts for how we got to here.
The price of Bitcoin is set to experience a major collapse!Based on its historical price action, bitcoin might crash to 55K in next one year.

Bitcoin in Fibonacci retracement 105, 537 shows a huge resistence level, since yesterday BTC is ranging in this area; we are waiting for the news to see which side is more favorable to undergo. Mostly showing positive sentiment and traders are solidifying their position.

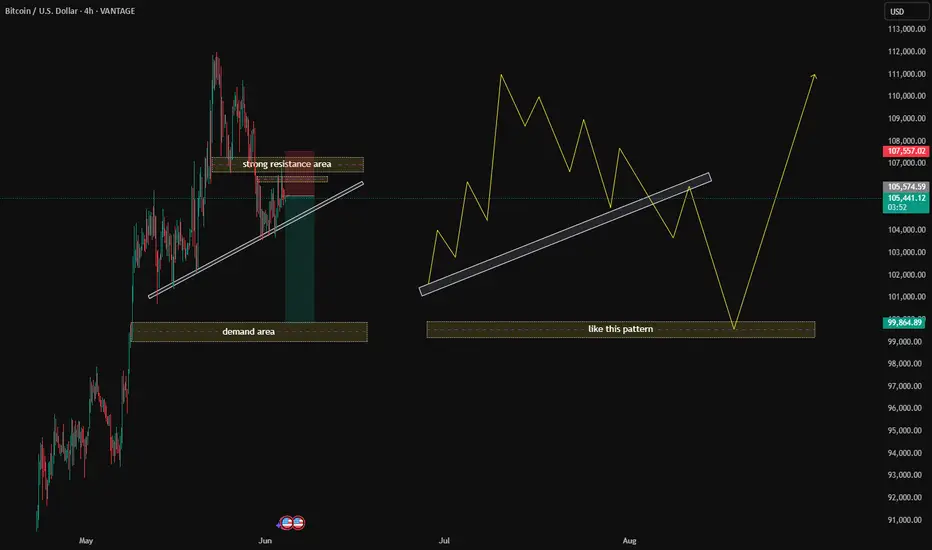
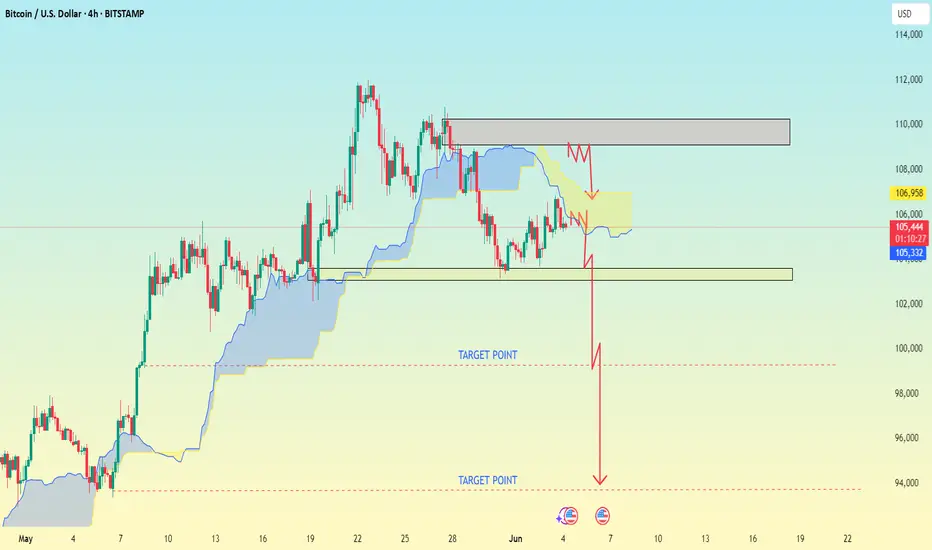
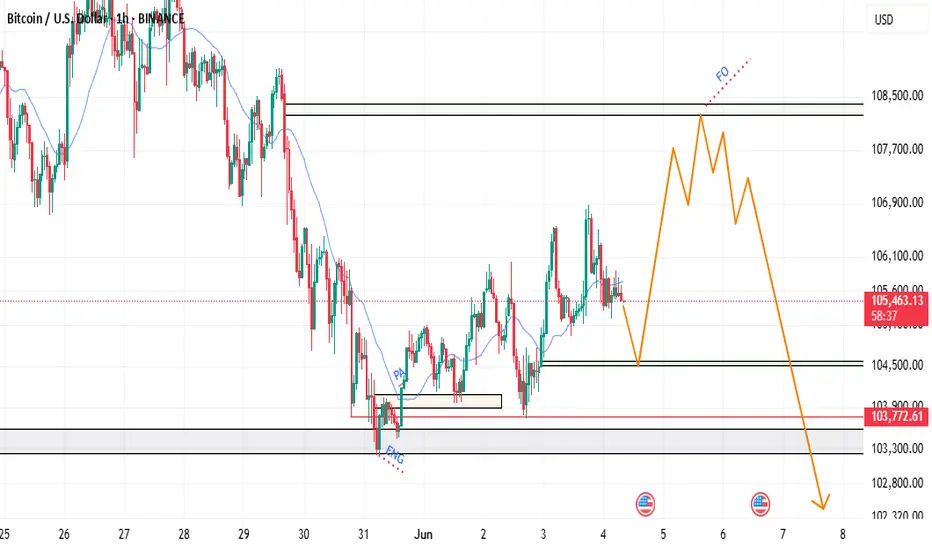
Key Chart Elements Bitcoin (BTCUSD) on the 4-hour timeframe🟡 Key Chart Elements:
1️⃣ Strong Resistance Area
This is marked with a red zone at the top.
This area is where sellers have historically stepped in, pushing the price down.
Price action is currently testing this area, indicating potential rejection or consolidation.
2️⃣ Demand Area
Marked in green at the bottom.
This is a previous area where buyers stepped in with strong momentum.
Price could bounce from here if it retraces.
3️⃣ Trendline Support
An upward-sloping white trendline acts as dynamic support.
Price has been respecting this trendline; any break below it might signal bearish momentum.
4️⃣ Yellow Zig-Zag Patterns
These lines represent price action forecasts or possible scenarios.
They show:
An initial bounce off resistance and then a potential retracement.
A deeper pullback towards the demand zone.
A final strong bullish move after retesting the lower support.
🔑 Scenario 1: (Left Side of Chart)
✅ Price is currently testing the strong resistance area while riding the trendline.
✅ If price respects this trendline and breaks above resistance, a continuation to the upside is expected.
✅ A stop-loss would typically be placed below the trendline.
✅ A take-profit could target previous highs near $107,000–$108,000.
🔑 Scenario 2: (Right Side of Chart)
✅ Shows a deeper retracement scenario:
Price breaks the trendline, heading toward the demand area (around $99,000).
After bouncing from demand, price respects the trendline from below, forming a bullish structure.
Once price stabilizes and reclaims the trendline, a strong bullish breakout is anticipated.
🔍 Suggested Trading Plan:
🔹 Aggressive Bulls:
Look for a break and retest above the strong resistance area (red zone).
Enter on confirmation with a tight stop below the trendline.
🔹 Conservative Bulls:
Wait for a deeper pullback into the demand area and the yellow projected structure.
Enter near $99,000 after confirmation (e.g., bullish engulfing candle or strong bounce).
🔹 Bears:
Watch for a strong rejection from the resistance area with a break of the trendline.
Consider shorting toward the demand area with a stop above the resistance zone.
💡 Conclusion:
Your chart suggests both bullish and bearish scenarios depending on price action near the key levels:
Strong resistance (~$106,000–$107,000)
Demand area (~$99,000–$100,000)
Trendline support (dynamic level)
Traders should watch for confirmation (e.g., break and retest, engulfing candles) before entering trades.
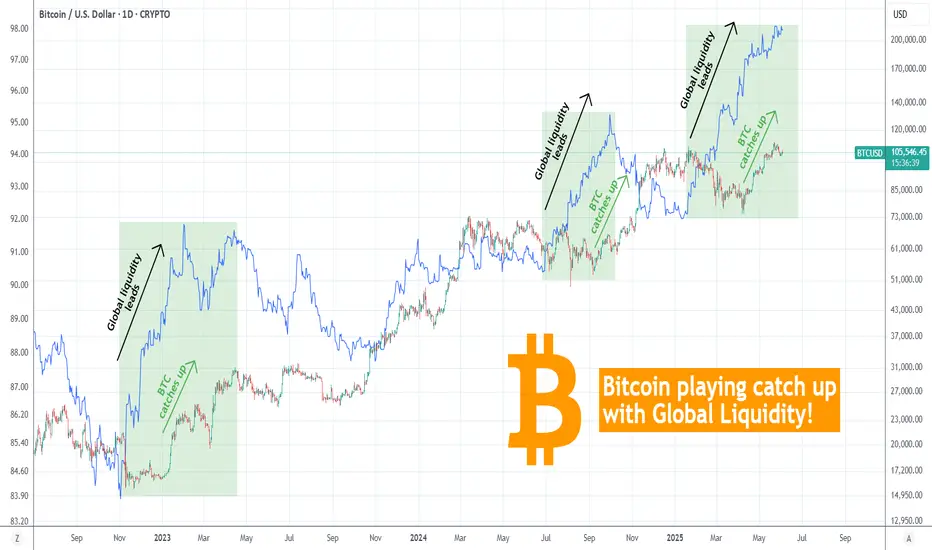
BITCOIN Will it catch up to the rising Global Liquidity again?Bitcoin (BTCUSD) is attempting to stage yet another short-term rally on its Tariff War recovery Bullish Leg but the picture is even more interesting on the long-term.
This is a simple yet very powerful and explanatory chart where it shows that every time the Global Liquidity (blue trend-line) led the uptrend and started rising before BTC on this Bull Cycle (since the November 2022 bottom), BTC eventually caught up to the trend and closed the Gap.
This time Global Liquidity has been rising since the start of the year (early January) while Bitcoin only started to do so since April 07. Even if the Global Liquidity pauses here, Bitcoin still has the potential to continue rising irrespectively.
How high do you think this can go? Feel free to let us know in the comments section below!
-------------------------------------------------------------------------------
** Please LIKE 👍, FOLLOW ✅, SHARE 🙌 and COMMENT ✍ if you enjoy this idea! Also share your ideas and charts in the comments section below! This is best way to keep it relevant, support us, keep the content here free and allow the idea to reach as many people as possible. **
-------------------------------------------------------------------------------
💸💸💸💸💸💸
👇 👇 👇 👇 👇 👇
BTC Massive Drop from 118K to 50K! As you can see i hope weekly Elliot wave will complete in around 118K to its highest price and then may start a correction wave as ABC weekly so that BTC Price could reach to 50K!
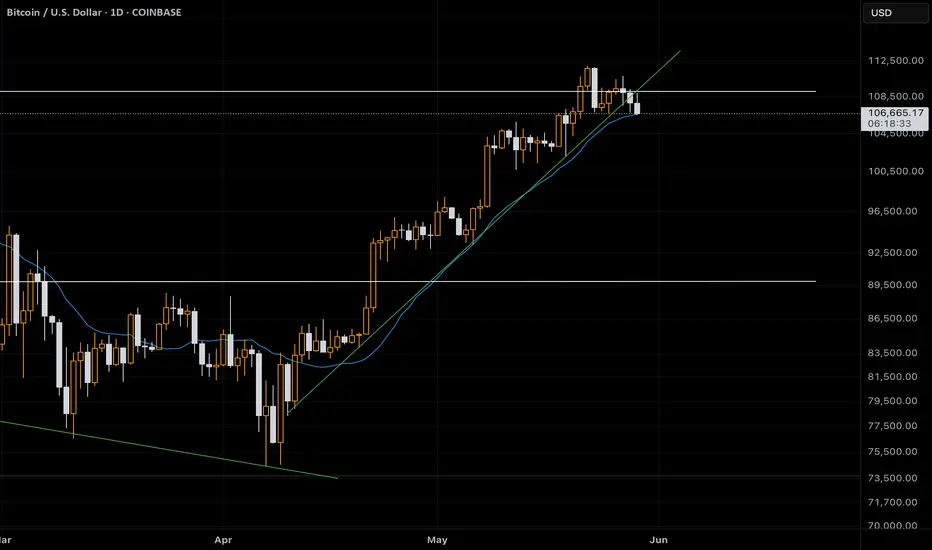
$BTCUSD - DIP INCOMING *I don't place trades based on trend lines but just act as a guide of how price action behaves.
Diagonal trend line which supported price on the way up is now broken and currently being tested as resistance.
That being said price is holding up pretty well as the MA is acting as a support which will be my trigger to go SHORT if broken. Add to that the weekly open resistance confluence and 100K retest is the first Short target and if markets overreact which they normally do then sub 89K is not off the books.
Stay safe
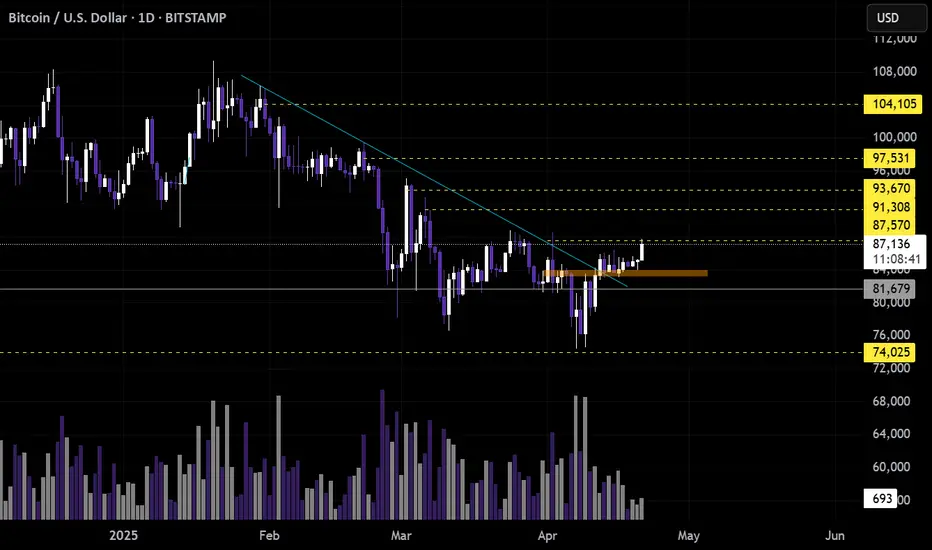
BTC RESISTANCESMight have some reaction when the levels got hit. Let's see and review it in the future.
based on just price level and price reactions
BTC/USD..chart pattern..BTCUSD trade setup based on the chart pattern details
---
🟠 Trade Idea: BTCUSD Sell
Sell Entry: 105,500
Resistance Level: 101,000
Target 1: 99,000
Target 2: 93,000
---
🔍 Interpretation
Pattern Implied: Although you didn't name the exact chart pattern, this setup suggests a bearish reversal — potentially from a double top, head and shoulders, or bearish rising wedge.
Sell Entry at 105,500 implies BTC has recently bounced or failed at a resistance zone.
Resistance at 101,000 being below the sell entry might be a typo — or possibly meant to show a recent break above a now-invalidated level.
Targets at 99,000 and 93,000 suggest a step-down approach — taking partial profits or expecting continued selling pressure.
---
📊 Risk/Reward Overview
Entry Stop Loss (assumed) Target 1 Target 2 R:R (to 99K) R:R (to 93K)
105,500 ~107,000 (1.5K risk) 99,000 93,000 ~4.3:1 ~8.3:1
> Note: These R:R figures are rough estimates assuming a 1.5K stop loss above entry.
---
🔔 Key Considerations
Confirm Chart Pattern: Ensure there’s a confirmed bearish pattern with volume confirmation.
Check Momentum Indicators (e.g., RSI, MACD) for bearish divergence or trend exhaustion.
Support Levels: Watch for buying reaction near 99,000 and stronger support near 93,000.
---
Would you like me to:
1. Analyze the actual BTCUSD chart and validate this pattern?
2. Draw the setup visually?
3. Suggest a better stop-loss level or trailing strategy?
Let me know!
BTCUSD updateHi traders I shared this set up 1 January n started by predicting sells manipulation happen n market sells as you can see we predicted buys after we reach some zone now we've been going higher aswell n recovery those sells,soo amstil bullish until 125k as first target are tired of loosing money follow any trend I support God will release you from loosing streak to winning 👍

Bitcoin: Fib Interference PatternNeeded 3h timeframe version of the Fibonacci interference pattern to better capture and document short-term market behavior around key intersection zones.
Measurements

I determined the entry point in the previous analysis, it had toI determined the entry point in the previous analysis, it had to fit under the floor she had built.
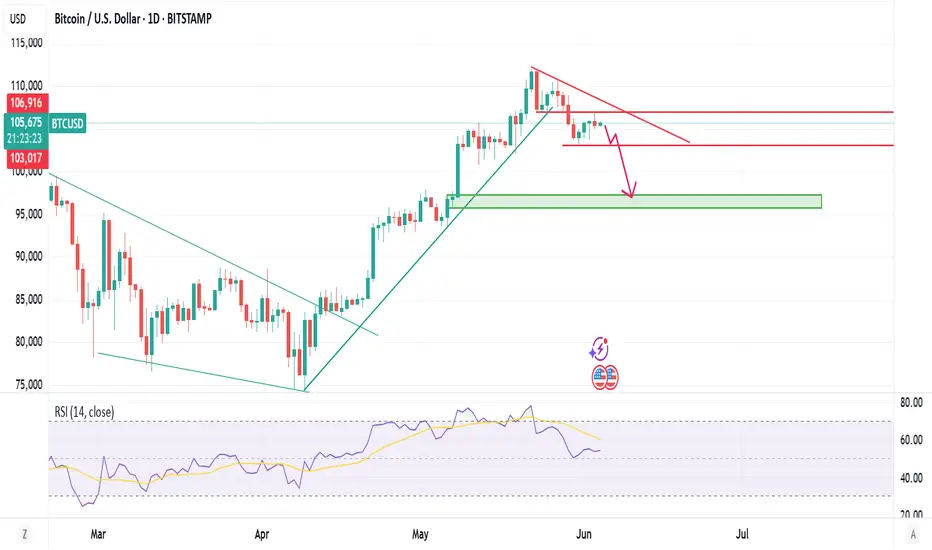
BTC/USD (demand zone), confirming the pullback.Timeframe: 4H (4-Hour)
Asset: BTC/USD
Current Price: ~$105,408
Trend Direction: Currently in an upward trajectory with a recent Break of Structure (BoS) confirming bullish intent.
---
🧠 Technical Analysis Details
1. Market Structure
Break of Structure (BoS): Highlighted in a circle — this marks a significant shift in market sentiment from bearish to bullish.
Higher Highs and Higher Lows are forming post-BoS, which is typical in a bullish market structure.
2. Fair Value Gaps (FVG)
Two FVG zones are marked (rectangular green areas):
First FVG: After a rapid move downwards, this gap suggests an inefficiency that price eventually returns to.
Second FVG: Also gets filled, showing institutional-style price action respecting inefficiencies.
3. Support Zone
A broad green support zone was respected in the March-April range, leading to a strong bullish push — a likely area of demand accumulation.
4. Entry & Target Zones
Entry Box: Red shaded region between ~$96,000 to ~$100,000. Suggests a potential pullback entry zone.
Target Box: Green shaded region ending at ~$120,951. A likely take-profit zone.
The projected movement is shown with a squiggly arrow indicating a bullish move from the entry zone to the target.
---
💡 Strategy Summary
Bias: Bullish
Entry Plan: Wait for retracement into the red zone (demand zone), confirming the pullback.
Target: Ride the move toward $120K+ region.
Stop Loss (Implied): Below the entry zone, possibly under $95K.
---
⚠️ Other Observations
Chart is Clean: No excessive indicators, focusing on price action, structure, and liquidity concepts.
Institutional Style: Uses ICT/Smart Money Concepts — BoS, FVG, and mitigation.
Time Anchor: Projection points toward mid-to-late June (e.g., Fri 20 Jun 2025 as a key area).

btcusd sell signal. Don't forget about stop-loss.
Write in the comments all your questions and instruments analysis of which you want to see.
Friends, push the like button, write a comment, and share with your mates - that would be the best THANK YOU.
P.S. I personally will open entry if the price will show it according to my strategy.
Always make your analysis before a trade

btc usd btc usd on some profitbooking after heavy spike , trendline resistance is main to be watch for breakout for further upside else can test 97000-95500 $ on lower side which is again a buying zone , will check for our parameters to be fullfill at lower.
BTC It may be Bullish, but man it looks BearishJust lookin at the 30 min. Maybe BTC is bullish and everyone is right, but I tell you right now it looks bearish. Do what you want.
