BTC/USD Long Setup – Buy the Dip into SupportMarket Context:
Bitcoin is currently in a retracement phase after rejecting from the local high near 111,900. Despite the short-term pullback, the broader structure remains bullish. This setup is based on a retracement into a key support zone, offering a potential entry for the next leg up.
Setup Idea:
Price is pulling back into a confluence area that includes:
The 0.5 Fibonacci retracement at 105,454
Previous structure support
A retest of the broken diagonal trendline
This zone is expected to act as demand, providing a favorable long entry opportunity.
Trade Plan:
Entry zone: Around 105,400
Stop loss: Below 104,100 (beneath structure and fib zone)
Target: Retest of the previous high near 111,890
Risk/Reward: High R potential with clearly defined invalidation
Notes:
If price breaks below 105,000 and fails to show buying strength, the setup becomes weaker. A decisive break below 103,900 invalidates the trade idea. Wait for bullish confirmation (e.g. higher low or volume reaction) in the entry zone before committing.
This is a clean, structured opportunity aligned with the prevailing trend. Patience and confirmation are key.
BTCUSD.P trade ideas

BTC CONTINUES TO PUSHBitcoin continues to press higher with quiet confidence. After reclaiming the $106,787 resistance level with a strong daily close last week, BTC has held the breakout and is now consolidating just above it – a textbook bullish retest. The 50-day moving average is rising beneath price, offering additional support as momentum builds. We’re seeing a small cluster of tight candles, hinting that the market is coiling for a potential move.
Volume has pulled back slightly since the breakout, but there’s no sign of aggressive selling. The structure remains clean: higher highs, higher lows, and a clear path toward the next major resistance at $112,000.
For now, it’s a bullish posture with strong technical support below and a stair-step climb in progress. Unless price falls back below $106,787, this looks like a base being built for continuation – not exhaustion.

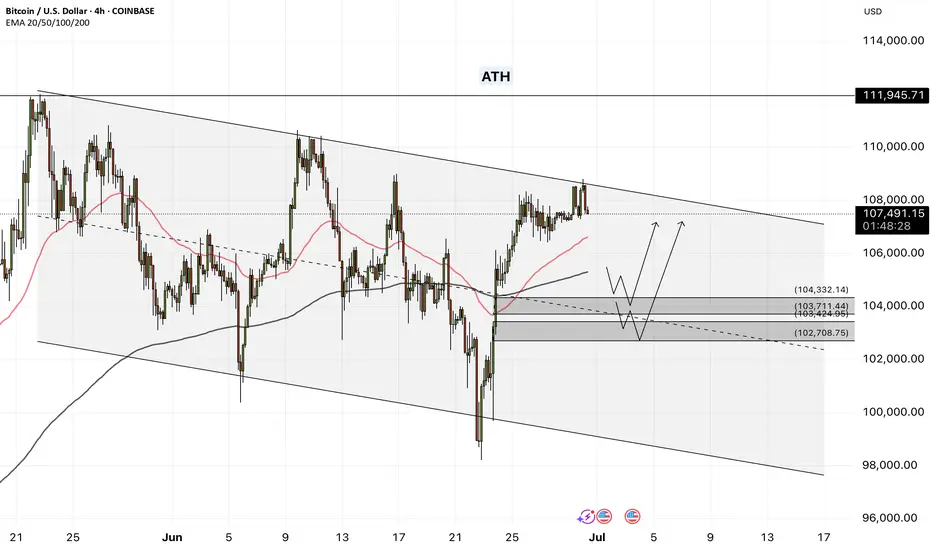
Bitcoin - Will Bitcoin Hit a New ATH?!Bitcoin is trading above the 50- and 200-EMAs on the four-hour time frame and is within its short-term descending channel. Bitcoin can be bought from the demand zone indicated. A break of the channel ceiling would pave the way for Bitcoin to rise to a new ATH.
It should be noted that there is a possibility of heavy fluctuations and shadows due to the movement of whales in the market and compliance with capital management in the cryptocurrency market will be more important. If the downward trend continues, we can buy within the demand range.
In recent days, Bitcoin has been trading in a range of around $107,000, and the market is going through a consolidation phase with complex but deeply fundamental characteristics. What matters at this point is not just the current price, but the precise mix of capital flows, the behavior of major players, on-chain data, and macroeconomic ratios that shape Bitcoin’s short- and medium-term trajectory. Overall, although Bitcoin’s rapid growth after the halving has stopped, internal market signals point to a continuation of the upward trajectory in a more stable framework.
The first important component is the significant influx of institutional capital into the market via ETFs. In the past week, according to CoinShares, more than $1.24 billion in new capital entered crypto products, with Bitcoin accounting for more than $1.1 billion. This marks the 10th consecutive week of capital inflows into the market, bringing the total inflows for 2025 to over $15 billion. Prominent ETFs such as BlackRock’s IBIT and Fidelity’s FBTC are attracting hundreds of Bitcoins per day, indicating steady institutional demand that has weathered the momentary volatility and is more focused on long-term asset building.
Alongside this capital inflow, the Onchain data also paints a mixed but highly interpretable picture. While the average active address rate has declined slightly and the MVRV (market value to realized value) has fallen from 2.29 to 2.20, these changes are more indicative of profit-taking by investors than selling pressure! In fact, rather than fear of a correction or crash, the market is witnessing a “gentle shift of ownership” between short-term and long-term holders. UTXO data also shows a roughly 5% increase in Bitcoin held for over 8 years, a strong sign of long-term accumulation and a decrease in the willingness to sell at current prices!
This can be seen as a period of supply and demand equilibrium; a period in which large investors have entered, but on the other hand, some older players are taking reasonable profits. This has led to a kind of price consolidation, which in June showed itself with only 2% growth—the weakest monthly growth since July last year. However, CoinDesk and Glassnode analysts rightly emphasize that this consolidation is not a sign of market weakness, but rather evidence of the maturity of Bitcoin’s price behavior. The price is reacting to data rather than becoming emotional.
From a macroeconomic perspective, Bitcoin remains highly sensitive to the Federal Reserve’s monetary policy, the value of the dollar, and interest rates. While the market is still waiting for interest rate cuts in the second half of the year, Bitcoin will remain in a quasi-expectant state until then, reacting to macro data, short-term and reactive. However, given that most ETFs follow long-term accumulation models, any stabilization in interest rates or easing geopolitical pressures could trigger a new wave of upside. Common analyst scenarios predict a range of $120,000-$130,000 for Bitcoin by the end of the summer if current conditions are maintained and capital inflows continue. In summary, Bitcoin is now at a stage where the dynamic combination of institutional accumulation, supply and demand balance, and on-chain data has transformed it from a purely risky asset into a strategic investment vehicle. The market has moved beyond the emotional phase and entered a phase of stability and maturity. This is a promising sign for long-term investors, provided that risk management is maintained and sensitivity to macro events is maintained. Bitcoin is preparing for the next stage of its rally—but unlike in the past, this time it is standing on the shoulders of fundamentals that are much stronger than at any time in the asset’s history.
ETFs with the most volume traded on Friday
Total: $501M
BlackRock: $153M
Fidelity: $165M
Grayscale: $0M
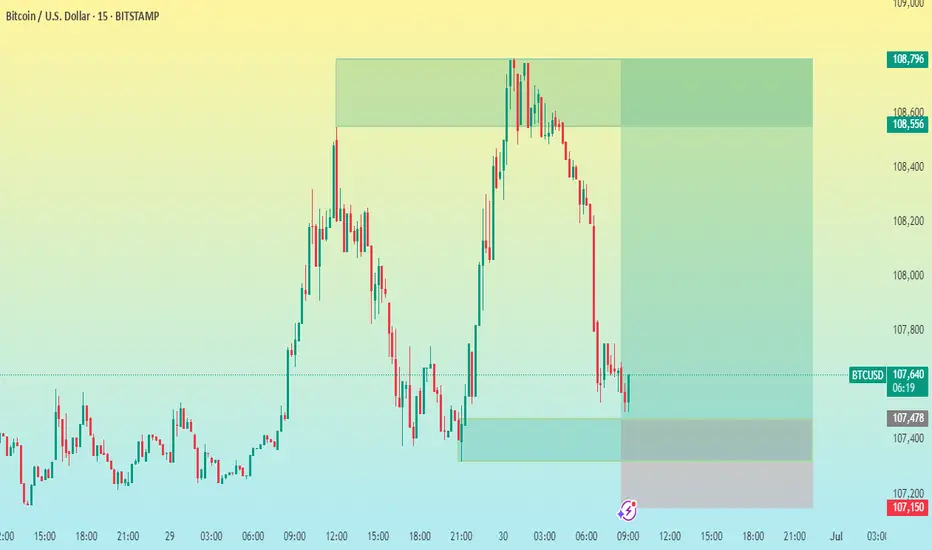
BTC/USD 15M CHART PATTERNHere's a summary of your BTCUSD 15-minute trade setup:
---
Trade Type: Buy
Entry Price: 107,500
Take Profit Levels:
1. TP1: 108,000
2. TP2: 108,300
3. TP3: 108,796
Stop Loss: 107,150
---
Risk-Reward Analysis:
Risk (SL): 107,500 - 107,150 = 350 points
Reward:
TP1: 500 points → ~1.43 R/R
TP2: 800 points → ~2.29 R/R
TP3: 1,296 points → ~3.70 R/R
---
Would you like me to turn this into a trading journal entry, script (e.g., for TradingView/MetaTrader), or analyze the probability based on recent price action?
June 25 Bitcoin Bybit chart analysisHello
This is Bitcoin Guide.
If you "follow"
You can receive real-time movement paths and comment notifications on major sections.
If my analysis was helpful,
Please click the booster button at the bottom.
This is the Bitcoin 30-minute chart.
Nasdaq indicators will be announced at 11 o'clock shortly.
Nasdaq is rising vertically + renewing its all-time high.
Accordingly, I ignored the weekly MACD dead cross and
proposed the strategy for the pattern by substituting Tether dominance.
Although it is not visible on the screen,
I created today's strategy with the condition of maintaining the long position of $100,587.9 that was confirmed on the 23rd.
* One-way long position strategy when the red finger moves
1. $106,746 long position entry section / When the purple support line is broken
or when section 2 is touched, stop loss price
2. $108,66 long position 1st target -> Good 2nd -> Great 3rd target price
When section 1 at the top touches, it can be connected to an upward trend,
and section 2 is a sideways market.
At the very bottom and the very top,
I have indicated the maximum possible trend until tomorrow afternoon.
Up to this point, I ask that you simply use my analysis for reference and use only
I hope that you will operate safely with the principle of trading and stop loss.
Thank you.

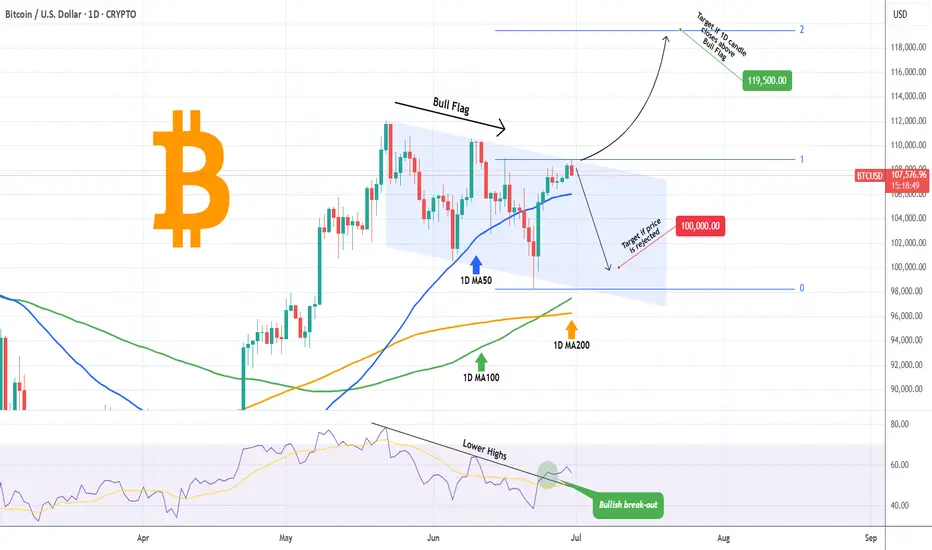
BITCOIN Rejected (so far) where it absolutely SHOULDN'T!!Bitcoin (BTCUSD) hit today the top of the Channel Down pattern, which as we've discussed numerous times, is most likely on the long-term a Bull Flag technically. Still, this early test has so far turned into a rejection.
Early on to tell as the price remains above even the 1D MA50 (blue trend-line) but if it breaks above the closes a 1D candle above the top of the pattern, we expect it to immediately target the 2.0 Fibonacci extension level at 119500. We have analyzed of course why on the long-term the Target is at least $150k, but this is a shorter term analysis. Notice also how the 1D RSI has already broken above its Lower Highs trend-line.
As long as the price remains rejected within the Channel Down, it is possible to look for support on the 100000 level again, where this time it may make contact with the 1D MA100 (green trend-line) in an attempt to 'attract' the last batch of buyers.
Which scenario do you think will prevail? Feel free to let us know in the comments section below!
-------------------------------------------------------------------------------
** Please LIKE 👍, FOLLOW ✅, SHARE 🙌 and COMMENT ✍ if you enjoy this idea! Also share your ideas and charts in the comments section below! This is best way to keep it relevant, support us, keep the content here free and allow the idea to reach as many people as possible. **
-------------------------------------------------------------------------------
💸💸💸💸💸💸
👇 👇 👇 👇 👇 👇
demand spotted hunted and caughtits just becomes easier once you understand comprehensively how the forex market moves. its structures and its dynamics
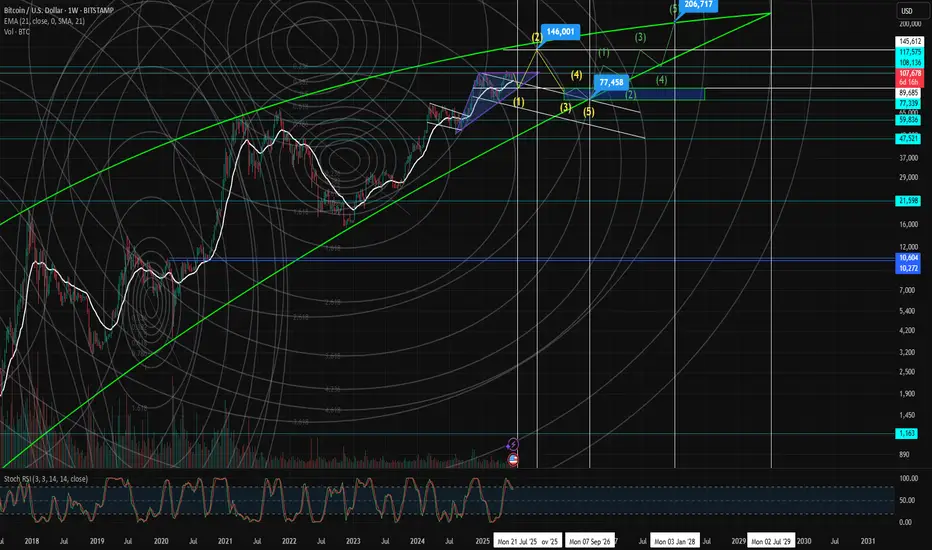
See you in 2029!Maybe this is my last analysis after my long journey in Bitcoin.
Thank you and see you in 2029, I will be back after 20th Bitcoin journey.
Last chance to make profit from BTC with buying positionBullish flag
Strong resistance breakout
2 bull points
Position trade spot buying
Bitcoin completing timecycle on oct 2025 after that it would be 4th time if market again crash for around 70%
Manage your risk in both future and spot trading
Note: NO analysis would 100% profitable trading is the game of probability and risk management so follow your trading plan with proper risk reward and win rate.
Bitcoin Eyes $110K Target Above Key Support LevelBitcoin trades slightly below last week’s high near $107,660.0, while RSI 14 shows bearish divergence without a clear downward move.
Immediate support is at $107,230.0, and resistance at $108,550.0. If BTC closes above resistance, a rally toward $110,651.0 may follow. The bullish outlook remains valid as long as the price stays above $104,681.0.

Bitcoin: a decision week Previous week brought some relief among market participants, when it was announced that the U.S. Administration and China completed the deal regarding trade tariffs. Details of this deal have not been publicly disclosed, however, the markets reacted positively to it. The U.S. equity market gained significantly, while the crypto market managed to hold higher grounds. BTC started the week with a break of $105K toward the upside, testing the resistance at $108K. The majority of trades occurred between $106K and $107K.
The RSI continued to move above the 50 level, indicating that the market is still not ready to seek the oversold market side. The indicator is ending the week at the 56, bringing some probability for the overbought market side in the coming period. The MA50 continues to diverge from MA200, without an indication that the cross might come anytime soon.
Charts are showing that the BTC is currently on the cross road. There are equal probabilities that the coin might be traded toward both sides in the week ahead. On one hand, trades from the last week showed enough buying orders, which were holding the coin at the higher grounds, continuously seeking the break of the $108K level. However, if this market strength does not manage to support the BTC in the week ahead, then the reversal will be inevitable. In this case, the $105K will be the first stop.
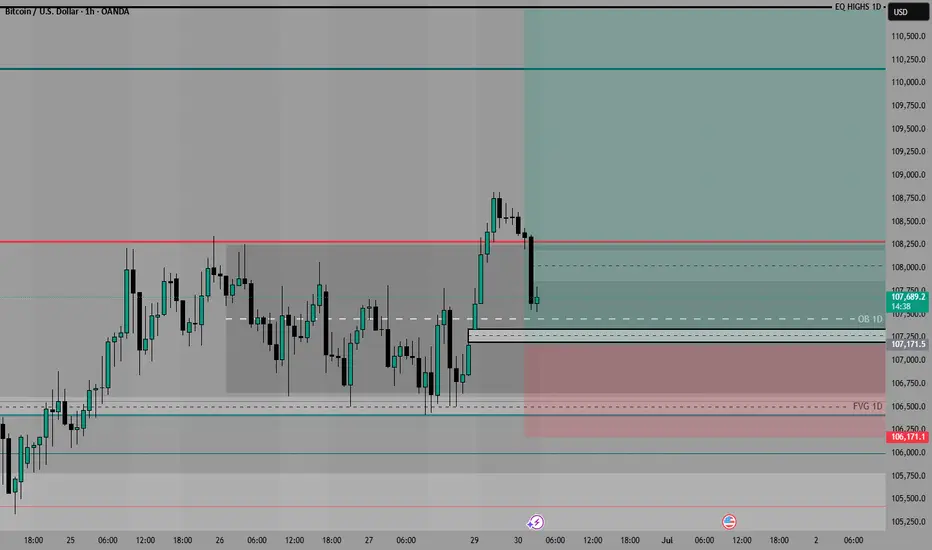
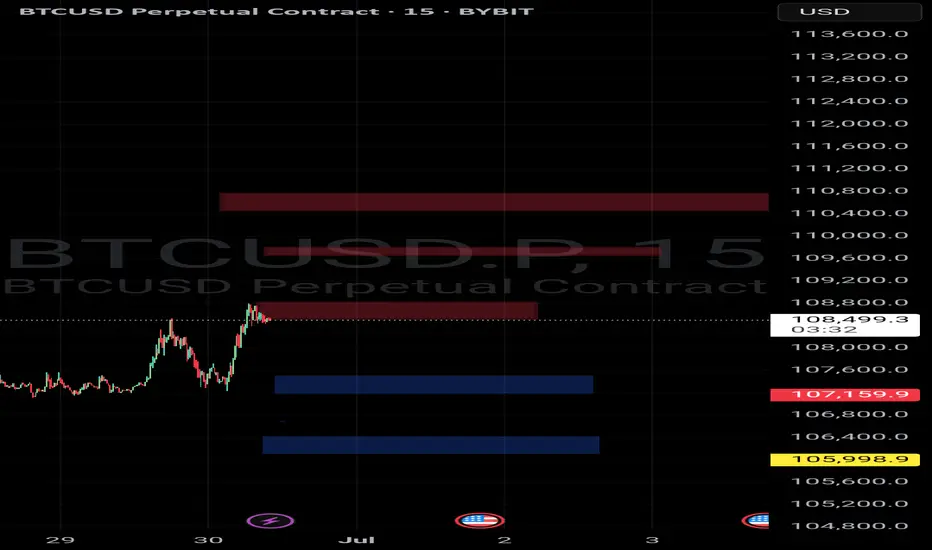
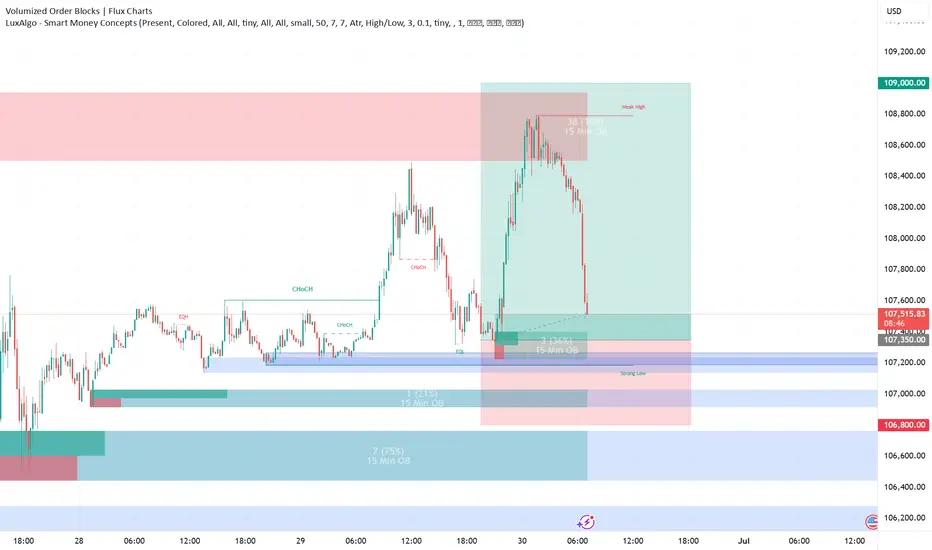
BTC WILL PLAY THIS BOXES
### 🔴 **Bearish Order Blocks (Resistance Zones)**:
These are likely areas where price previously faced selling pressure and may again.
1. **Zone 1 (Lowest Red OB)**
📍 Range: \~108,300 – 108,800
🔹 Price is currently reacting at this zone.
🔹 If price fails to break and close above this zone with volume, expect a short-term rejection.
2. **Zone 2**
📍 Range: \~109,65,0 – 110,000
🔹 If price breaks above Zone 1, this becomes the next target/resistance.
3. **Zone 3 (Highest Red OB)**
📍 Range: \~110,500 – 111,500
🔹 Strongest resistance in this chart. If price reaches here, high chance of reversal unless strong momentum continues.
---
### 🔵 **Bullish Order Blocks (Support Zones)**:
These are previous demand areas where buyers stepped in.
1. **Zone 1 (Highest Blue OB)**
📍 Range: \~106,900 – 107,600
🔹 Closest support below current price. If price retraces, it may bounce from here.
🔹 Good area for long entries if price gives bullish confirmation.
2. **Zone 2**
📍 Range: \~105,800 – 106,500
🔹 Stronger support zone; last defense before potential further downside.
🔹 Matches with yellow price marker (105,998.9), possibly a key liquidity level.
---
### 🧠 **Trade Idea Suggestion** (Based on your OB strategy):
#### ✅ **Bullish Scenario**:
* Break & close above 108,800 (top of current red OB) with volume → Look for retest to go **long**.
Market Manipulators Work Together to Exploit Hope | BM Is Over Iran–Israel Tensions Rising Again | A Hidden Gem for Traders
The conflict between Iran and Israel is heating up once again, and things are far from settled. Behind the scenes, there are signs that Iran may restart its nuclear weapons program, which could trigger a serious reaction — not just from Israel, but also from Western countries and nearby Arab nations.
If this conflict turns into a wider war, we could see major global impacts, including:
Rising oil prices due to tensions in the Middle East
Increased defense spending and movement in military-related stocks
Volatility in gold, USD, and crypto markets as investors seek safety
📉 While the world is watching quietly, this is actually a hidden signal for smart traders. The media might not be talking loudly about it yet, but war risk is building — and when it explodes into headlines, markets could react fast and hard.
🧠 Smart Traders Know:
Geopolitical tension = market moves
Fear fuels gold, oil, and crypto spikes
Nuclear headlines could shift investor psychology overnight

waiting for BTC to reach to demand area#BTC we will buy @107350 with the SL of 106800 for target 109000 and above
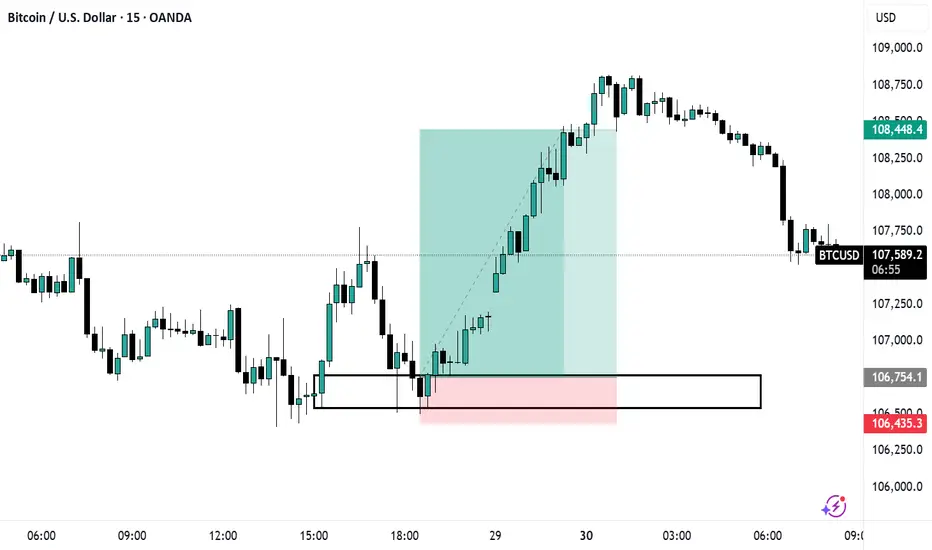
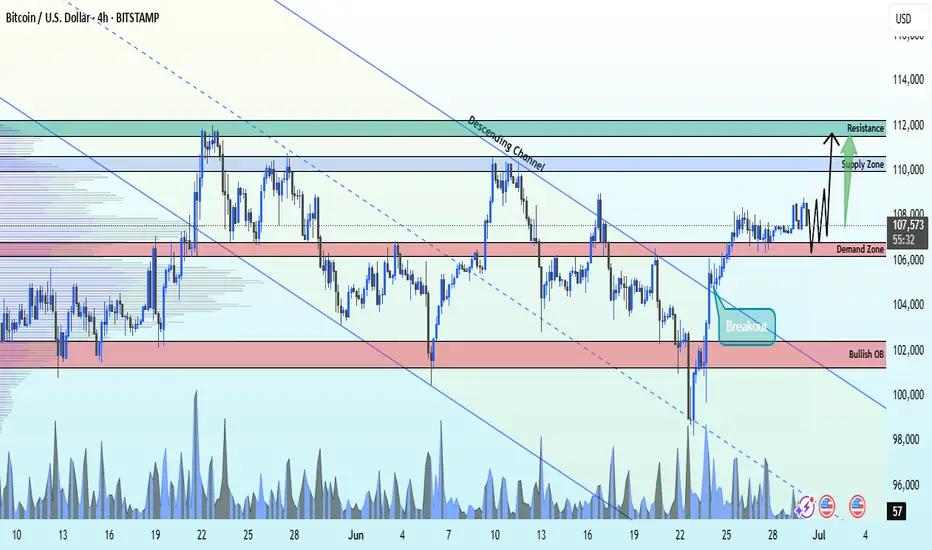
BITCOIN Breakout From Ascending Channel bullish from demand ZoneBTCUSD Breakout Alert
Bitcoin has officially broken out of the descending channel on the 4H timeframe, signaling a potential bullish reversal from the key demand zone at 106,100.
🎯 Technical Targets:
1st Target: 110,000 – Major supply zone
2nd Target: 112,000 – Strong resistance level
🔒 Stop Loss: 103,000 – Below bullish order block for risk protection
This setup offers a clean R:R with strong confluence. Watch for continuation above 108K for confirmation.
📊 TA only – always manage your risk!
🔥 Like, follow, & comment to stay ahead with more real-time updates!
#BTC #CryptoTrading #PriceAction #BitcoinAnalysis #LiviaTrades 😜
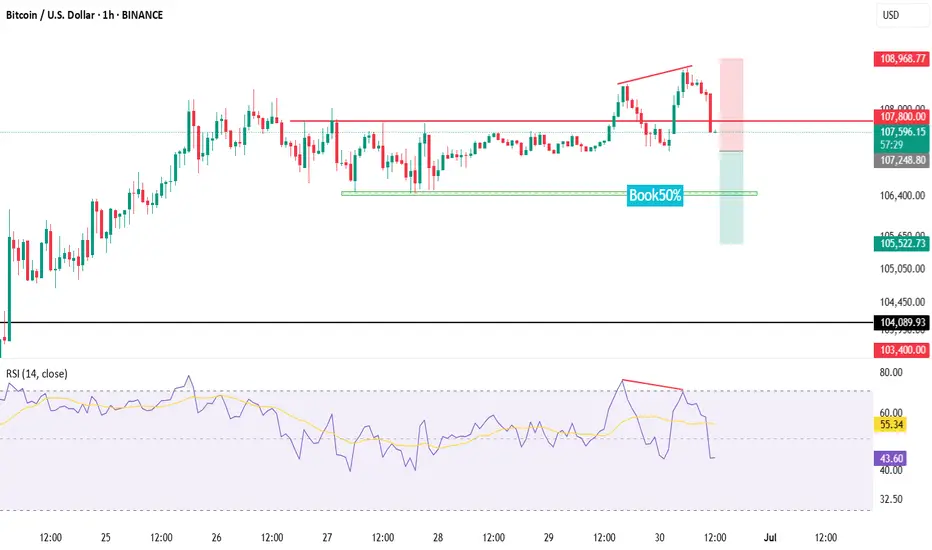
BTCUSD📉 The Setup: Bearish Divergence on BTCUSD (1H/15m/30m)
🔍 Observation:
On the 1 Hour chart, Bitcoin
🧠 Meaning: The Buying pressure is weakening, and a breakdown might be near!
Entry SL TP shared in chart
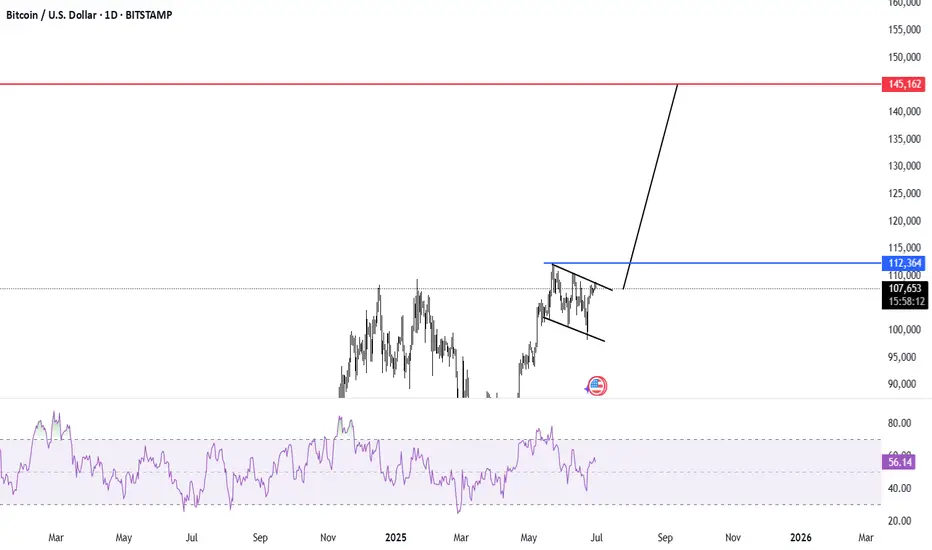
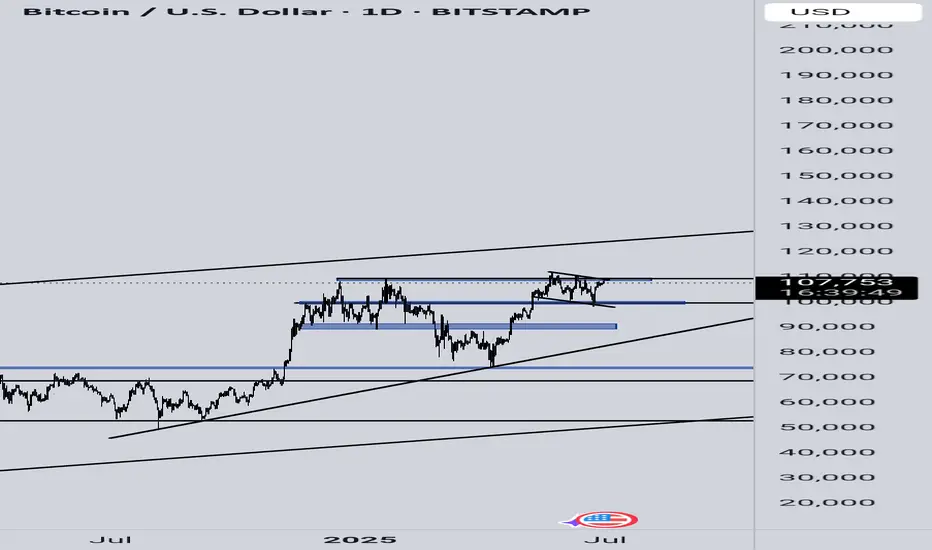
Bitcoin is now **on the verge of one of the biggest breakouts in
\#Bitcoin – **Higher Time Frame Analysis** 📈
Bitcoin is now **on the verge of one of the biggest breakouts in its history**.
📊 On the **daily chart**, we can clearly see a structure forming that's **similar to a Pole & Flag pattern**, which is typically **very bullish** from a price action perspective.
⚠️ However, we remain **cautious** —
We don’t just want a breakout above the upper trendline…
What we’re looking for is a **strong daily candle close above the previous all-time high** (\~**\$112,000**).
💥 If that happens, I’m anticipating a **massive upside move**, potentially towards the **\$123,000–\$125,000** zone.
Let’s stay alert and wait for **clear confirmation** before jumping in!

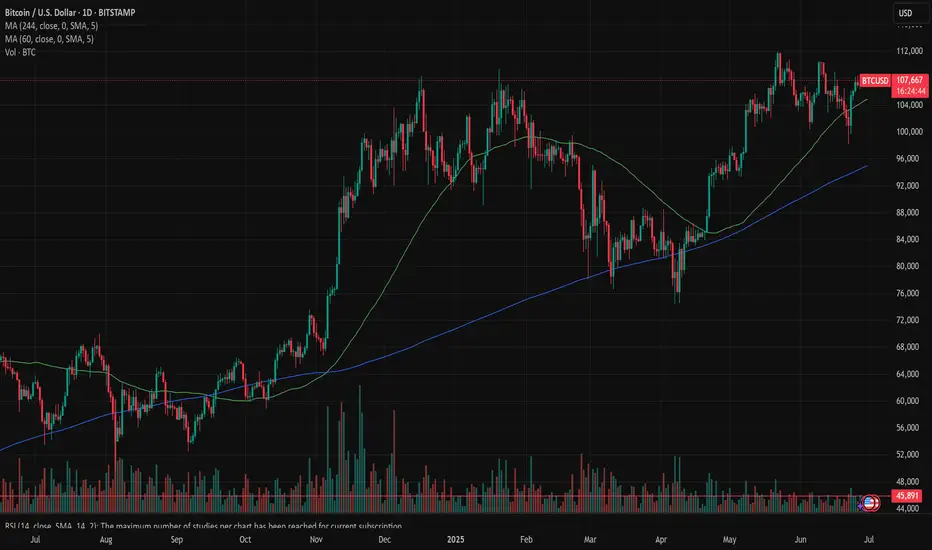
Traders Gurus always wrong at the crucial pointWhy are trading gurus often wrong at market tops or bottoms?
I recently received an email from the B*itcoin L… channel (where people like P.L. Brandt, Loukas, etc. are members), and it said the following:
The next installment of the 4-Year Cycle.
Exploring the powerful bullish case for Bitcoin, driven by a perfect storm of narratives: institutional adoption, regulatory clarity, and cycle timing. From ETF inflows and corporate treasuries to a pro-crypto U.S. administration, potential interest rate cuts, and surging legitimacy post-halving — signs point to a possible super cycle unfolding.
But honestly, if you know how to read a BTC chart, where exactly do you see a “powerful bullish case for Bitcoin”? Tons of indicators suggest the opposite — even BTC Dominance (BTC.D) doesn’t confirm it.
Wasn’t the move from $16K to $110K already the bullish case?
Based on what I’m seeing in the charts, BTC is likely to cool off for a year, maybe even two. I expect it to come down to at least $50K–$65K before making any significant move upward again. We haven’t even had a proper flash crash yet, which is surprising given everything that’s been going on in the world over the past few months. Something fishy is going on.
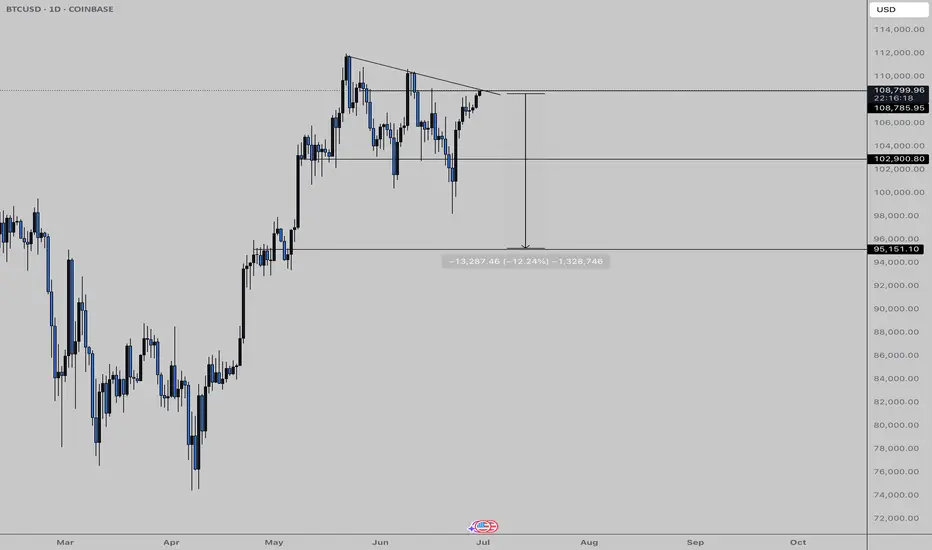
BTC Shorts Into Q3 | Monthly + Half-Year Candle PressureWe’re entering a pivotal window on the Bitcoin chart, the monthly close, Q2 close, and 6-month candle all lining up. This kind of macro convergence rarely goes unnoticed by the market and often marks major structural shifts.
BTC has failed multiple times to break through key highs, and with momentum fading into this close, I’m leaning short heading into Q3. Even if price wants to trend higher later this year, I expect that move to begin from a deeper wick, not from the top of the current range.
I’m watching the 103K level closely. A break below it could trigger a swift drop toward 95K, possibly lower depending on how the new monthly opens and reacts. That would line up with the idea of a strong lower wick forming on the new 3M or 6M candle.
This isn't a long-term macro short, just a high R setup where structure, timing, and context are aligning. I believe this move starts today or very soon. The next few candles will speak volumes.
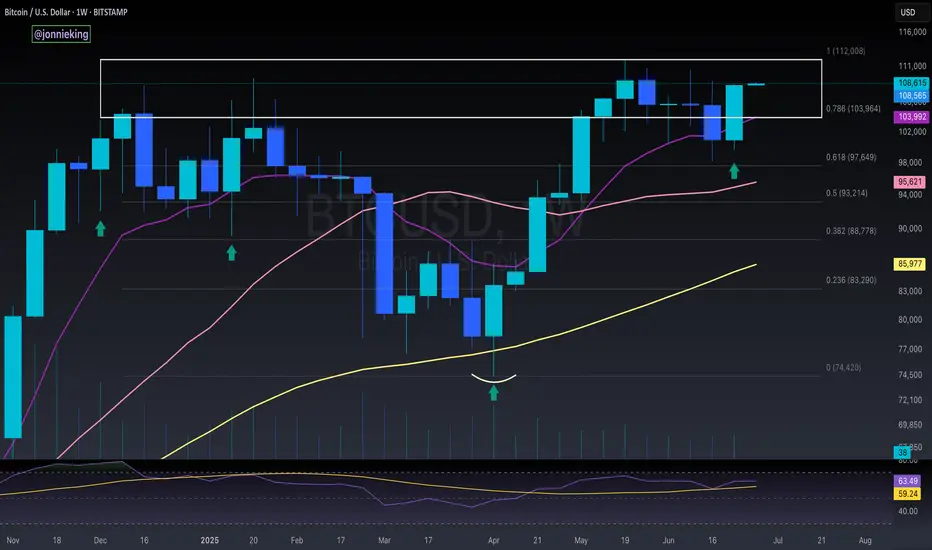
$BTC Bullish Engulfing Weekly CloseCRYPTOCAP:BTC closes the Week with a Big Bullish Engulfing candle back within the POI.
Should retest ATH soon.