Bitcoin Daily: It Will Go Lower, I Will Explain WhyIt is hard to make these predictions because there are so many different points of view, so many opinions. There is so much data available that one can easily become confused. We can write an entire book about Bitcoin's next move and still not know what will happen next. I will keep it simple and straight forward and you will be able to understand and appreciate how easy it is when we focus on the chart only. Bitcoin is breaking below 100K.
Bitcoin is already trading at support. The mid-May consolidation range. From this range Bitcoin produced an advance and hit a new all-time high. The all-time high is a triple-top when we take the highs from January 2025 and December 2024. The fact that the action happens below this level now is bearish and this range has been confirmed as resistance.
The market will look for strength and this simply means lower.
Since resistance has been confirmed after a 50% rise, it is normal to see a retrace, can be medium-sized to balance out the strong-long bullish wave. Bullish action was present between 7-April until 22-May, 45 days.
The current retrace can take only a few weeks, think about 15-21 June as a rough estimate but nothing more (can end much sooner).
If you are unprepared and don't have map of the bigger picture, this can become terrifying and even lead to poor decisions at some point. If you know that this is only a retrace and the market will continue growing after a test above 90K, you can rest easy or even take advantage of this situation.
Now, what Bitcoin does is not the entire market. In a bull market, when Bitcoin moves down, money flows to the Altcoins. When Bitcoin goes sideways, the Altcoins grow. So dynamics will be much, much different now compared to what you saw in 2024, 2023 and 2022. The way the market will behave it is basically new for most participants.
The conclusion is that all is good and the chart is pointing lower short-term. After a short-term retrace, we get additional growth. Simple isn't it? It is...
Thank you for reading.
Namaste.
BTCUSD.P trade ideas
BTCUSD Uptrend Continues - Consistent Daily Demand ZonesConsistent daily demand zones are being created in this uptrend, signalling this is still a buyers' market. Momentum to the upside will continue and new All Time Highs will be claimed as long as new demand zones on H4 and daily timeframes are created.

BTCUSD – Bullish Channel Support Bounce SetupBTCUSD is currently trading within a clearly defined ascending channel on the 15-minute chart. The price recently touched the lower boundary of the channel and is showing signs of a potential bullish bounce.
This structure suggests that the pair may continue respecting the trend and head toward the upper boundary of the channel, offering a favorable risk-to-reward opportunity.
The trade plan includes a long setup with stop-loss placed just below the channel support and a target near the upper resistance zone. Volume remains moderate, supporting gradual upward momentum.
Technical Highlights:
Pattern: Ascending Channel
Key Support: Lower trendline
Entry Zone: Near current support
Target Zone: Around 106,500
Stop-Loss: Below recent swing low (around 104,185)
This is a technical chart idea based on price action and structure. Please manage your risk accordingly.

Bitcoin Long Term ProjectionI'm expecting bitcoin to keep dropping below $100k and possibly fluctuate between $103k down to $98k for a while eventually eventually taking out a point of liquidity around the $92.5k level which could provide a short term retracement back into the $100k levels.
Until the imbalance around the $87k level is tapped I don't see the possibility of Bitcoin making any new ATHs. Even if this imbalance is filled it could only provide short term bullish momentum which would continue to fuel the bears and continue to push the price into low $70k levels.

Bitcoin: What's next?BTC has lost local support around $107k and currently testing previous resistance around $104k.
If buyers are able to step in between $100k - $104k and reclaim $107k, it will signal strength.
If BTC experiences continued weakness, losing $100k as support, I would expect price to test the $95k - $97k region or 1D 200MA before signaling a reversal.
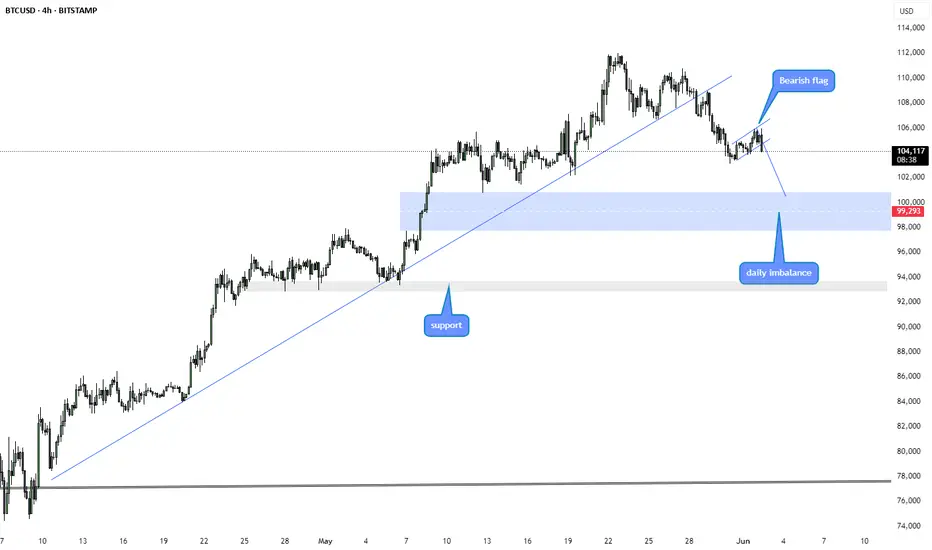
Is btc on its way to 99k?As you can see, btc has formed a bearish flag on the 4h chart and we are currently breaking out. I am therefore not bullish on btc at the moment, because I think we will drop back to 99k and maybe even to 93k because there is very strong support. I will keep you informed. tradingview.sweetlogin.com
BTCUSD Breakdown Incoming? 4H Chart Flags Key Bearish Entry🔵 Entry Point (Sell Limit / Market Entry)
• Around $104,600 – $104,700
This area aligns with the retest of the descending trend line and a weak resistance zone. Price is reacting negatively after hitting this level.
🟥 Stop Loss
• $107,060
Placed just above the weak resistance. This protects the trade in case price breaks structure and invalidates the bearish setup.
🟩 Take Profit Targets
1. TP1: $101,818 (Support 1)
o First major support zone; price has bounced here previously.
2. TP2: $98,020 (Support 2)
o Deeper support and more aggressive target. Aligned with previous wick lows.
🔺 Chart Observations
• Trend Line: Still intact and respected. Price rejected it on the latest retest.
• Structure: Lower highs and lower lows show bearish momentum.
• Volume/Volatility: Tapering candles around resistance indicate weakening bullish attempts.
• Risk-to-Reward
o TP1 R:R ≈ 1.3:1
o TP2 R:R ≈ 2.5:1+
⚠️ Scalper Note
If you’re trading this as a scalp, consider securing partial profits at TP1 and moving SL to breakeven to protect gains. Volatility around macro events or news (like the red event icons near June 3–5) could trigger wicks.
Would you like me to add RSI, MACD, or EMA confluence to strengthen the setup further?

What Would You Do If The Bitcoin Top Was In?Bitcoin remains incredibly strong, trading near all-time highs. The structure is undeniably bullish, with price continuing to hold above key moving averages and previous resistance levels. The volume profile is healthy and supportive of the uptrend.
That said, I always like to challenge my own bias and look at the other side of the coin. Let’s rewind to 2021 - after a major rally, Bitcoin made a new high, swept previous highs, and then entered a deep correction. If history were to repeat, and this current rally turns into a similar scenario, what would your plan be? Would you take some profits at these levels? Set tighter stop losses? Adjust your risk accordingly?
Again, this is not what I expect to happen. I remain bullish on Bitcoin’s long-term prospects. But it’s essential to stay open-minded and pre

BTCUSD Entre point 104600 target 106000 stop loss 104000Let's break it down:
- Entry Point: 104,600
- Target: 106,000 (1,400-point gain)
- Stop Loss: 104,000 (600-point risk)
Risk-reward ratio looks decent! You're going long on BTCUSD, expecting a significant gain. Let's see how it plays out!
Potential reward: 1,400 points
Potential risk: 600 points
What's driving this bullish trend?
Bullish View Towards $109,000!Hello dear traders! 🍻
Today, I want to share my bullish outlook on Bitcoin. After a precise examination of the chart and the influencing factors, I believe Bitcoin has the potential to reach $109,000 in the short term.
🔷 Technical Analysis: Confirming Order Block Strength
From a technical perspective, Bitcoin had a crucial interaction with a designated order block (marked by a red square) on the chart and immediately moved upwards. This direct and strong upward reaction indicates the power and significance of this specific order block.
Please keep in mind that this analysis is solely my personal opinion. Any return of the price to this area could be very significant. However, if the price breaks below this red area, my bullish analysis would be invalidated, and we could potentially see a drop to $95,000.
🔶 Fundamental Analysis: A Bright Future Ahead
Beyond the technicals, several strong fundamental factors also support a positive outlook for Bitcoin:🔻
1. ETF Inflows: The continuous inflow of liquidity into Bitcoin Spot ETFs paints a bright future for Bitcoin, consistently increasing buying pressure in the market.
2. Institutional and National Adoption: The growing acceptance of Bitcoin by investment funds and even as strategic reserves by countries could truly transform Bitcoin into a global and highly valuable asset.
3. Accumulation by Long-Term Holders & Decreasing Exchange Supply: Data shows that long-term Bitcoin investors are actively accumulating and holding onto their assets. Concurrently, the supply of Bitcoin on exchanges is decreasing. This suggests that investors are not planning to exit their positions for current profits and are anticipating much higher prices.
📍 Conclusion ⚠️
Overall, this was a short-term, personal analysis that I've provided. I hope you find it useful.
Important Note: Any break below the red marked area invalidates this analysis.
GOODLUCK🍀
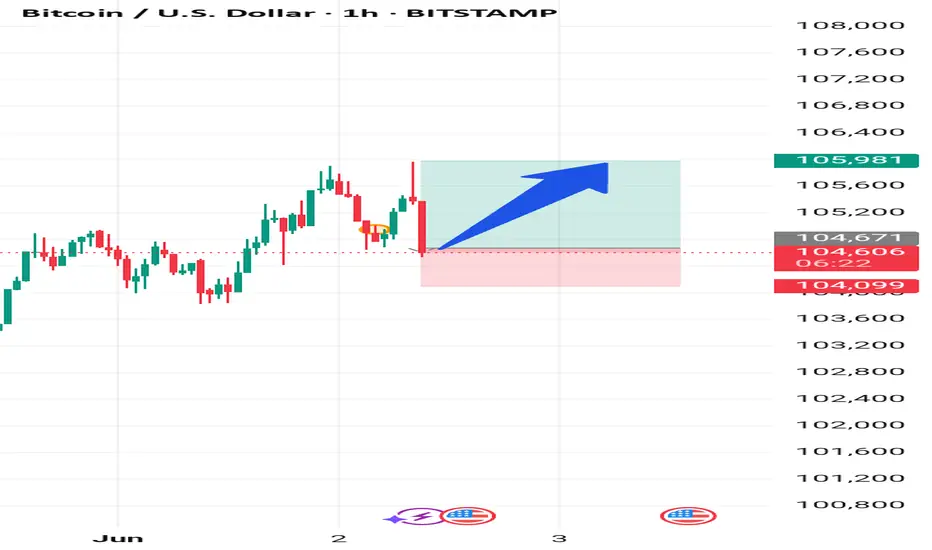
BTCUSD UPDATE 2- 6 - 25The chart you uploaded shows a falling wedge pattern on the Bitcoin (BTC/USD) 1-hour chart. Here is an updated analysis based on visual indicators:
---
🔍 Pattern Overview:
Pattern: Falling Wedge (bullish reversal pattern)
Price Action: Consolidation within two downward sloping trend lines
Current Price: Around $104,773
Potential Breakout Target: ~$112,240
Support Zone: ~$102,830
---
📈 Updated Technical Outlook:
✅ Bullish Scenario:
If BTC breaks above the wedge resistance (upper blue line), a rally towards $112,240 is possible.
This level is likely captured by the wedge height projected above the breakout point.
Look for a clear breakout candle with volume above ~$105,000 for confirmation.
⚠️ Bearish scenario:
Failure to hold above support (~$102,830) could invalidate the bullish setup.
A break below this could open the door to further declines, especially if macroeconomic factors turn negative.
---
📅 Timing and Events:
Marked by icons at the bottom are upcoming US economic events, which could trigger volatility.
Keep an eye out for high-impact data releases like non-farm payrolls, CPI, or interest rate announcements.
---
✅ Actionable Summary:
Buy Trigger: Break and close above the wedge with strong volume (~$105K+)
Target: $112,240
Stop Loss: Below $102,830 (or below the lower trendline)
Would you like me to interpret or update the image with these insights, or create a fresh one with the expected breakout?

Bitcoin - Will Bitcoin reach $120,000?!Bitcoin is in its short-term descending channel on the four-hour timeframe, between the EMA50 and EMA200. Personally, I would look to sell Bitcoin at a target of $100,000. Either from the channel ceiling or after an invalid breakout of the specified channel. If this corrective move occurs, Bitcoin buying opportunities can be sought within the demand zone.
It should be noted that there is a possibility of heavy fluctuations and shadows due to the movement of whales in the market, and capital management in the cryptocurrency market will be more important. If the downward trend continues, we can buy within the demand range.
The Bitcoin 2025 Conference, widely regarded as the largest global event dedicated to Bitcoin and blockchain technology, took place from May 27 to 29 at the Venetian Convention Center in Las Vegas, Nevada. First launched in 2019 and held annually since, the conference has become the central meeting point for Bitcoin enthusiasts and professionals, offering a platform for knowledge exchange, ideation, and innovation within the Bitcoin ecosystem. With over 30,000 attendees, 400 speakers, and participation from around 5,000 companies, this year’s event played a significant role in advancing the global adoption of Bitcoin—often referred to as “hyperbitcoinization.”
The 2025 edition covered not only technical subjects such as Layer 2 scaling solutions and privacy enhancements, but also broader themes like institutional adoption, strategic Bitcoin reserves, and its implications for financial freedom on a global scale.From an economic perspective, there was a strong emphasis on Bitcoin’s role as a store of value amid inflationary pressures and unstable monetary policies. Forecasts presented by key figures such as Michael Saylor and Paolo Ardoino pointed to Bitcoin’s potential to emerge as a foundational asset within global financial systems. These projections were further supported by the expansion of the M2 money supply in 2024 and expectations for continued growth into 2025.
In addition to highlighting opportunities, the event also addressed the challenges facing Bitcoin. One major concern was the lack of clear legal and regulatory frameworks in certain countries—a topic addressed by Caitlin Long and other speakers. Such regulatory uncertainty could hinder broader Bitcoin adoption. Moreover, Bitcoin’s price volatility—highlighted by a 3.4% decline in the weeks leading up to the conference—raised questions about the market’s long-term stability.
Meanwhile, Coinbase reported that the repayment of debts related to the bankrupt FTX exchange could act as a $5 billion liquidity injection into the crypto market. This development is expected to boost capital inflows and potentially draw major institutional players back into the space.
According to Coinbase, as of May 30, the “FTX Recovery Trust” has begun its second phase of repayments, distributing over $5 billion in stablecoins to creditors. These payouts are being processed over three days via the BitGo and Kraken platforms. Unlike the first round in February, this phase involves only stablecoin disbursements rather than a mix of crypto and cash—enabling recipients to reinvest their funds more quickly and efficiently.
Additionally, U.S.-based companies currently hold 94.8% of all Bitcoin owned by publicly traded firms. The U.S. also commands 36% of the global Bitcoin hash rate, underscoring its dominance in mining activities. So far, 36 U.S. states have enacted pro-Bitcoin legislation, signaling a growing legal endorsement of the cryptocurrency across the country. This level of concentration—in ownership, regulatory leadership, and mining capacity—could position the U.S. to play a more decisive role in shaping future global Bitcoin regulations.
Bitcoin Monthly Candle Colour Close since 2011 - looking forward
May Closed GREEN, and We are currently on a Very small Green candle for the month open.
Last month, in this series of monthly charts posts, I mentioned this..
"On only 2 occasions have we had a GREEN JAN, RED FEB, RED MARCH, GREEN APRIL
And Both of them were on the way to ATH. ( Arrows )
On both those occasions we had a GREEN MAY, though the gains were minimal and one was followed by a Green June and the other by a Red June."
And we just closed May with a minimal GREEN candle.
This is important to understand, This month, we have a 50/50 chance of repeating the Green June candle in this pattern.
Outside of this pattern, The previous MAY closes, 7 Green to 6 Red.
Of the 7 Green, 5 were followed by a Green June
With this, we have a higher % chance of a Green June
Of All previous June Closes, we had 7 Green to 6 Red.
Of those 7 previous Green June Closes, 3 were followed by GREEN July
Of the 6 previous RED Junes, ALL were followed by GREEN July
With this in mind, we maybe in a better position if we did close June with a small RED candle, as we did in the 2020 sequence ( right hand Arrow)
Should we close June RED, I will then expect a fairly level summer period with PA beginning to start moving again around September / October
Bitcoin PA is in an excellent position to move higher now though. It is also in an excellent position to move away from previous cycle patterns and begin creating new one.
We do have to remain vigilant as markets are moving everywhere and Macro conditions could change rapidly
But the one thing that seems to remain static is that it is a VERY GOOD IDEA to Buy Bitcoin and HOLD IT

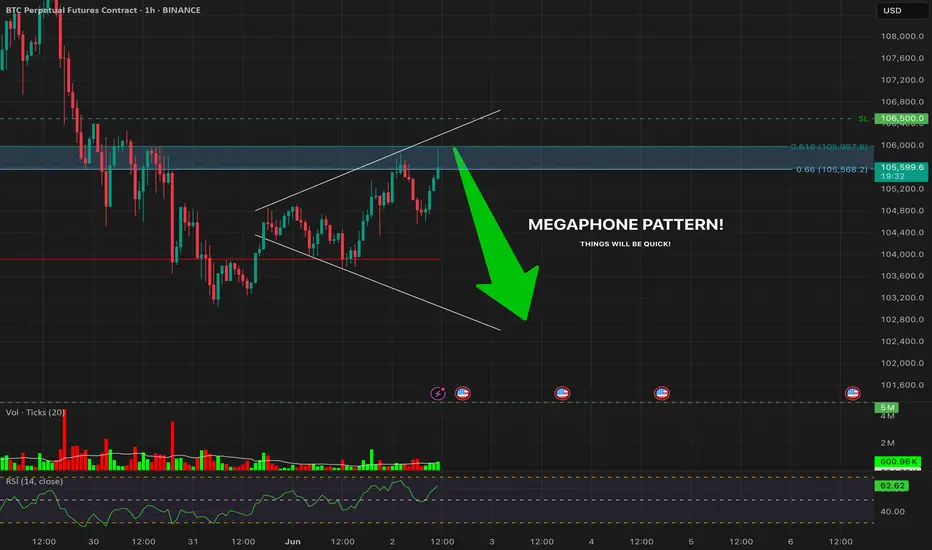
MEGAPHONE ALERT! BTC 1H Outlook🧩 Megaphone Formation (Broadening Wedge)
Volatility expanding inside a widening range
Price now testing the Fib cluster (0.66–0.618) between 105,568–105,987
RSI at 66.3, nearing overbought — pressure is building
Volume surging above 20-period MA → breakout imminent
🎯 Key Confluences:
Upper Bollinger Band: 105,950
Mid BB (Basis): 105,110
Lower BB: 104,342
55 SMA: 104,500
SL Zone (Invalidation): Above 106,500 (upper wick resistance)
🔻 Bearish Breakdown Scenario:
Loss of 105,100 and breakdown from lower wedge line
RSI drops < 45 + volume spike → hedge confirmation
Targets: 104,000 → 102,500
🔺 Bullish Breakout Scenario:
Close above 106,000–106,500 with volume
Targets: 107,800 → 108,900
Manage with trailing stops — things will be quick!
⚠️ Summary:
Megaphone = Volatility Bomb
Stay nimble. If BTC fails at this Fib zone, the breakdown will be fast and decisive. If it breaks out, bulls might squeeze higher but need volume to sustain it.
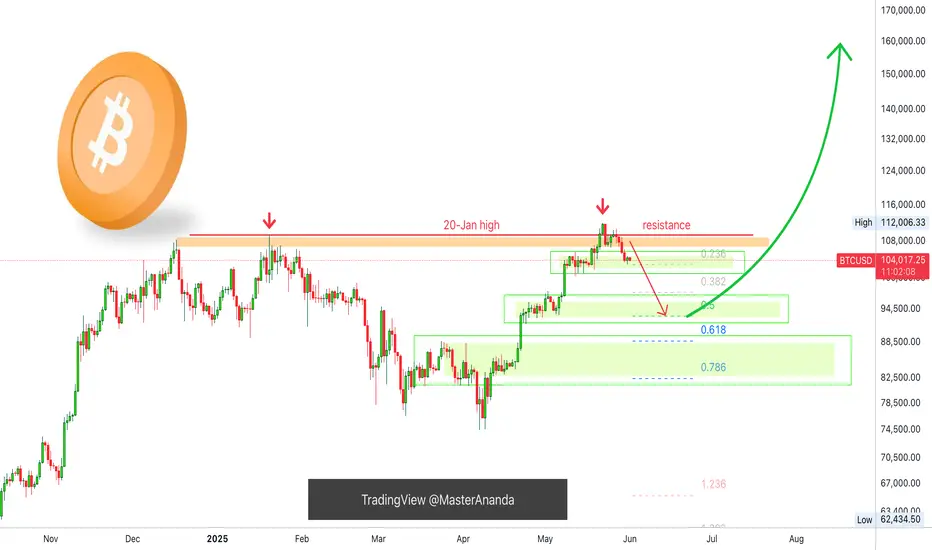
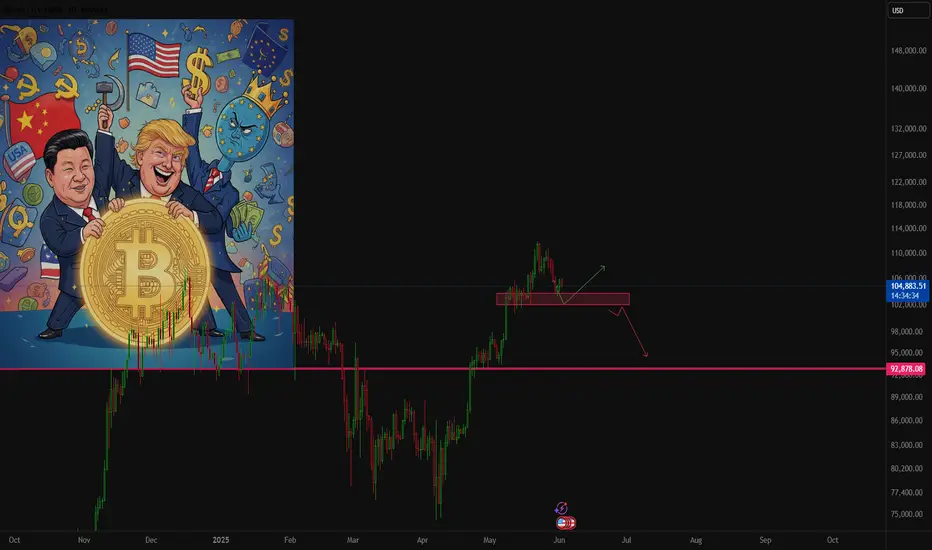
$Btc Bearish Flat Pattern Forming?Bitcoin Bearish Flat Pattern Forming? Potential Short Setup to $97K-$98K if Rejected at $106K
📉 BTC recently hit a new all-time high around $112K, followed by a series of higher lows near $110K, $108K, and potentially $106K. If price gets rejected at $106K, a bearish flat pattern may play out—triggering a high-probability short opportunity toward the $97K–$98K support zone. However, a clean breakout above $107K will invalidate this setup.

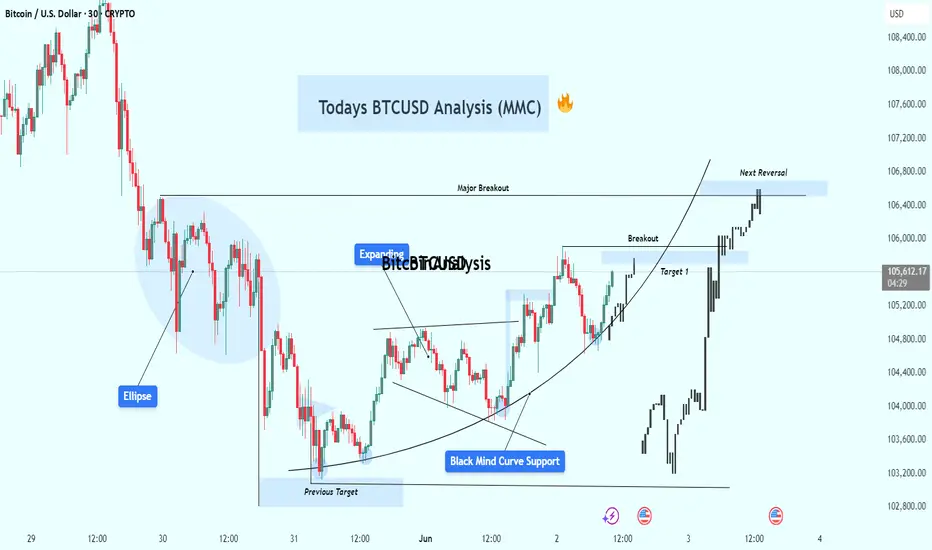
BTCUSD Mind Mapping Analysis (MMC) + Structure Mapping + Target🕵️♂️ Introduction
Welcome traders! In today’s BTCUSD analysis, we dive deep into the Mind Mapping Concept (MMC) with curve-based support, smart money structure shifts, and mapped liquidity levels. This chart reveals how institutional players moved price through liquidity traps, accumulation zones, and major breakout points, culminating in a reversal zone.
This breakdown is ideal for traders using:
Smart money concepts (SMC)
Curve theory
Liquidity sweeps
Structure mapping
🔍 Detailed Breakdown of the Chart:
🔹 1. Ellipse Zone – Liquidity Trap Phase
The blue ellipse on the left shows a clear area of price compression and indecision.
This is where retail traders often enter prematurely, expecting reversal.
Smart money exploits these zones to collect liquidity — this is not yet a trend shift, but a trap.
You can observe multiple wicks and fakeouts, signaling manipulation and preparation for expansion.
🔹 2. Expanding Channel – Volatility Phase
Following the trap, price enters an expanding pattern (also known as a megaphone).
These structures indicate uncertain market behavior, often manipulated to clear both highs and lows.
Smart money uses this to exhaust both buyers and sellers before deciding the real trend direction.
🔹 3. Previous Target & SR Flip Zone
Price reaches the previous downside target, completing a downward liquidity move.
From here, the market forms a support-resistance flip (SR-Interchange) — a textbook zone for institutional entries.
Once this zone holds, it confirms that buyers are absorbing sell orders.
The curve starts forming, indicating deeper market structure realignment.
🔹 4. Black Curve – Mind Mapping Curve Support
One of the most important elements of MMC — the curve — acts as a psychological and algorithmic support line.
The curve captures the accumulation structure in a flowing manner.
Repeated touches and rejections confirm its strength.
As long as price respects the curve, the bullish momentum remains intact.
🔹 5. Breakout Confirmation
Price breaks through mid-range consolidation and hits Target 1.
This move confirms a shift in market sentiment from indecision to bullish control.
The breakout is supported by volume, structure alignment, and curve acceleration.
🔹 6. Major Breakout Zone
A major resistance line is broken — this marks a shift in macro structure.
At this point, we label the zone as “Major Breakout” — any retest of this can offer a high-RR entry.
🔹 7. Next Reversal Zone (Supply Zone)
Price is now inside the Next Reversal Zone, which is a potential supply area or liquidity magnet.
Institutional traders may use this zone for profit-taking or to initiate a deeper retracement.
Watch for rejection signs, such as long wicks, engulfing patterns, or volume divergence.
If this zone is absorbed (i.e., broken cleanly), expect another leg higher.
💡 MMC Summary (Flow Recap):
Trap → Expansion → Liquidity Target → SR Flip → Curve Accumulation → Breakout → Target Hit → Reversal Zone
Each stage reflects smart money behavior and follows the natural cycle of manipulation → accumulation → distribution.
📊 What to Watch Next?
Confirmation Rejection in Reversal Zone? Short entries could be valid with curve re-entries.
Bullish Continuation? A clean break above reversal zone = new weekly highs likely.
Retest of Curve? If price pulls back, watch for rejections on the curve for safer long positions.
🚨 Trade Tips Based on This Setup:
✅ Use multi-timeframe confluence (M30 + H1 or H4)
✅ Always mark out previous liquidity zones
✅ Place SL below the curve or zone rejections
✅ Avoid entering trades inside expanding zones – wait for structure confirmation
🔖 Conclusion
This BTCUSD setup showcases a masterclass in smart money behavior using the Mind Mapping Concept (MMC). From trap to breakout, every move is cleanly mapped, providing a strong edge to traders who understand institutional footprints.
Whether you're a scalper, day trader, or swing trader, incorporating MMC curve support and liquidity logic can take your trading precision to the next level.
Fib Channel Extending From 2020 To PresentThe Fractal Wave Marker is used in this analysis. It gives a multi-scale perspective of swing highs and lows - how the market moves across different time intervals.
Nested cycles (fractured pattern) reveals important order in phase transitions from small pullbacks to major trends. Basically making it easier to look for systematic patterns.
For example, with this tool we can easier spot a commonality like the identifying consistent angle that connects consecutive tops as well as bottoms by parallel lines that gives an idea of general direction.
If we were to use that channel as a topological expression to examine to what extent the fact of price happening there influenced probability density and what it changed in future price behavior , we would literally integrate it with broader scale fibonacci structures like: adding more ratios after 1 (not just 0 - 1) to illustrated chart above.
The implemented version would look something like this:
Chart-based curve aligning with angle of the channel - validating measurements in use.
Documenting the structural buildup for research purposes.

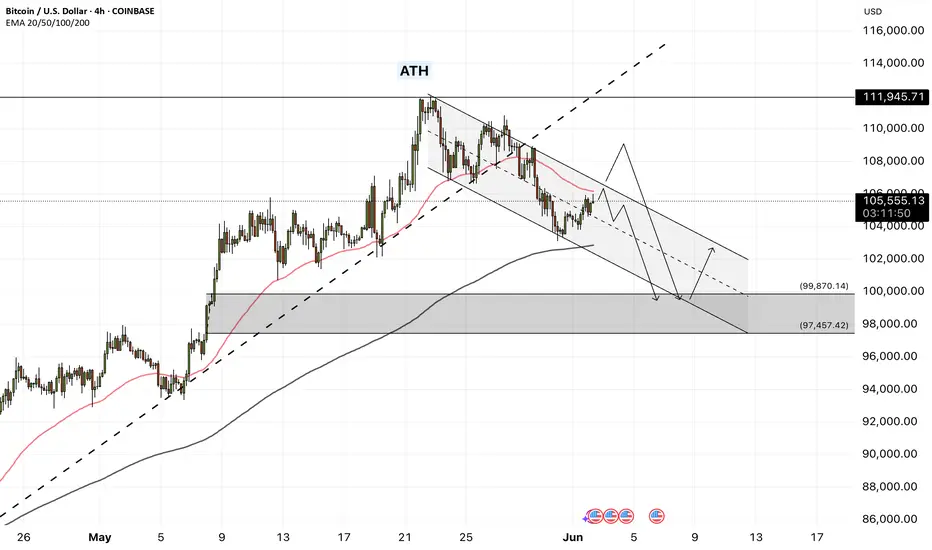
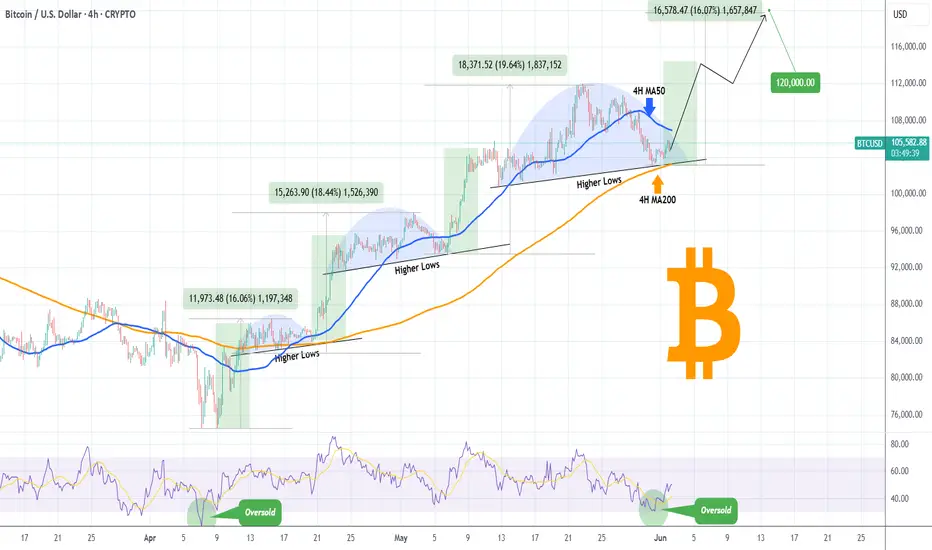
BITCOIN Can the 4H MA200 hold and kickstart the next rally? Bitcoin (BTCUSD) almost hit on Saturday its 4H MA200 (orange trend-line), which has been holding since April 16, and immediately rebounded. So far the bullish reaction is moderate as the price action is still being restricted below the 4H MA50 (blue trend-line), which is now acting as the short-term Resistance.
The blue Arc pattern that BTC has formed in the past 3 weeks, resembles the last two peak formations and pull-backs since the early April bottom. On top of all this, the 4H RSI got oversold (30.00) actually for the first time since the April 07 bottom.
With the weakest rally of this long-term Bullish Leg being +16.06%, if the 4H MA200 holds and a 4H MA50 break-out confirms it, we can expect a minimum short-term rise of almost $120k (+16.06%).
Do you think that's what's coming next? Feel free to let us know in the comments section below!
-------------------------------------------------------------------------------
** Please LIKE 👍, FOLLOW ✅, SHARE 🙌 and COMMENT ✍ if you enjoy this idea! Also share your ideas and charts in the comments section below! This is best way to keep it relevant, support us, keep the content here free and allow the idea to reach as many people as possible. **
-------------------------------------------------------------------------------
💸💸💸💸💸💸
👇 👇 👇 👇 👇 👇
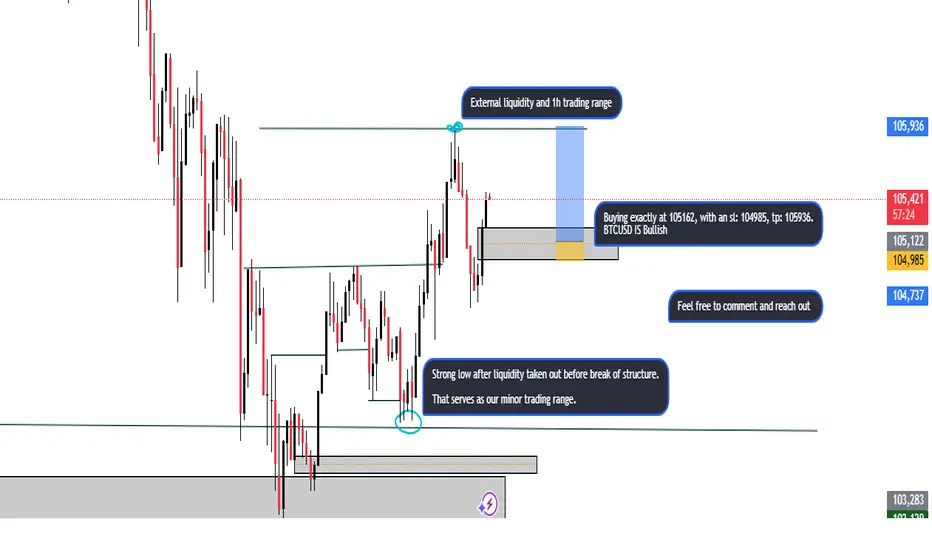
I am buying btc when it gets to my zoneWaiting for market to break structure, then afterwards the market should go and mitigate my umitigated POI marked out .
I will long with a candle stick confirmation from the 15mins, either bullish engulfing pattern from my POI.
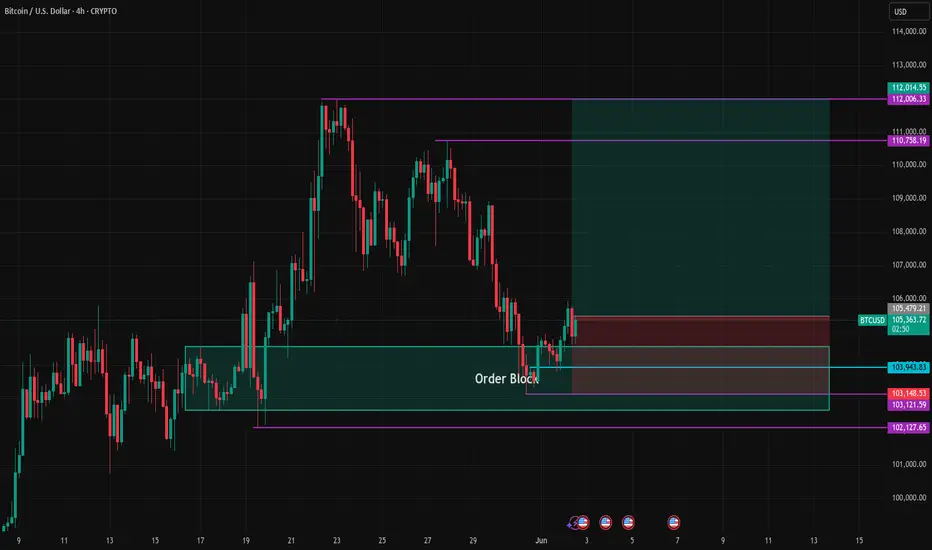
BTC Bullish Reversal from 4H Order Block – Targeting $112
Bitcoin has shown a strong bullish reaction from a well-defined 4H demand zone (Order Block), signalling potential for a trend reversal. The recent rejection from the $103.1K–$103.9K support aligns with a high-probability order block area, where price found buyers and pushed upward.
The setup targets the previous major swing high near $112K, with an intermediate resistance at $110.7K. Stop loss is placed just below the order block at $103.1K, maintaining a favorable risk-to-reward ratio.
Key Levels:
Entry: ~$105.4K
Stop Loss: ~$103.1K
Targets: $110.7K / $112K
BTCUSD Analysis Today: Technical and On-Chain !In this video, I will share my BTCUSD analysis by providing my complete technical and on-chain insights, so you can watch it to improve your crypto trading skillset. The video is structured in 4 parts, first I will be performing my complete technical analysis, then I will be moving to the on-chain data analysis, then I will be moving to the liquidation maps analysis and lastly, I will be putting together these 3 different types of analysis.

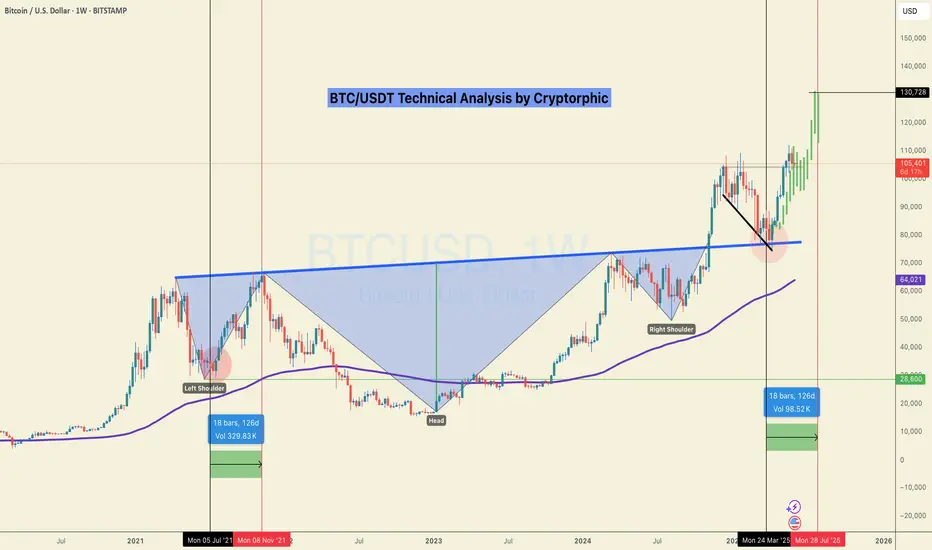
#BTC/USDT It's not over yet! Eying at 130K +ALTCOIN CHEAT SHEET!The last time I shared this chart was on April 14th, when Bitcoin was trading around $84,000 — right when panic was setting in across the market.
The message back then was simple: don’t panic, it’s just a retest.
And here we are again, revisiting the same sentiment with a new chart!
There are a lot of “double top” charts circulating in the space right now, but let me be clear: it’s not over yet.
Before jumping to conclusions, go through this chart and analysis to understand the full picture.
Bitcoin closed the week at $105,705 — certainly higher than most expected just a few days ago.
This marks the first red weekly candle after seven consecutive green closes, which is normal in the context of a healthy uptrend. We're still midway toward the broader target, so there’s no reason to panic or shift into disbelief.
Yes, we may see further corrections in BTC over the coming days or week, potentially down to $98K, and in a less likely scenario, even $ 92K. But this time, Ethereum is showing signs of strength and is likely to outperform Bitcoin, creating high-quality entry opportunities across the altcoin market. In other words, this phase is not a threat, it's an opportunity. BTC is still destined to hit $130k+ as per charts and other important metrics.
Here’s a typical market structure and reaction flow to help put things in perspective:
1. Bitcoin rallies — Altcoins underperform or get suppressed due to capital rotation into BTC.
2. Bitcoin corrects — Altcoins correct further as fear increases and dominance rises.
3. Bitcoin stabilises — Ethereum begins to gain strength, often leading the altcoin recovery.
4. ETH/BTC ratio increases — Ethereum holds up better while many altcoins continue to lag.
5. Bitcoin breaks ATH — This triggers a gradual recovery in altcoins.
6. BTC dominance peaks — Altcoins start gaining serious momentum.
7. Capital rotates from BTC and ETH into altcoins — Sectors tied to the current narrative (like meme coins this cycle, and Metaverse/NFTs in the last one) begin to lead.
8. Altcoin season begins — Utility and mid-cap tokens follow, often delivering strong returns in the final phase.
This pattern has repeated across cycles. Currently, we appear to be in the transition between Bitcoin stabilising and Ethereum gaining dominance — typically the stage that precedes a strong altcoin rally.
Now is not the time to assume the move is over. Stay objective, monitor capital rotation closely, and prepare for what comes next.
If your views resonate with mine, or if this post adds any value to you, please boost with a like and share your views in the comments.
Thank you
#PEACE