BTC ShortBTC has shown some short-term bullish signs, with a corrective bounce from the demand zone around 116,000–115,000, indicating a temporary reaction from buyers. However, this move appears to be a retracement rather than a full reversal, as the overall structure remains bearish.
Price is currently pushing into a previously broken intraday supply zone and approaching the 50% equilibrium level near 119,000, which aligns with a potential lower high forming. As long as BTC stays below this key level and fails to break market structure to the upside, the bias remains bearish.
We still believe BTC is likely to come back down to retest the recent lows, possibly revisiting the 116,000 zone to sweep more liquidity before any meaningful reversal can occur.
As always, proper risk management is essential. Wait for confirmation before entering trades and protect your capital in these volatile conditions.
BTCUSD.P trade ideas
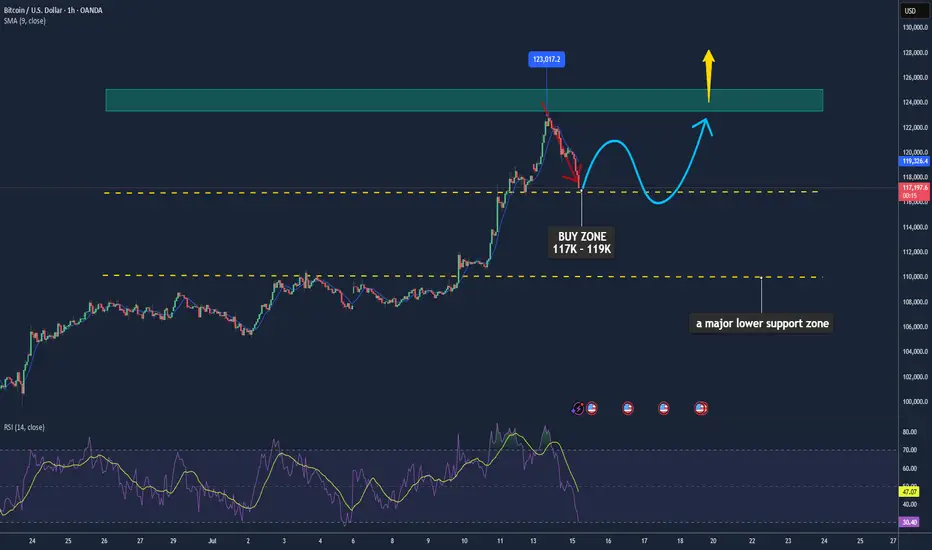
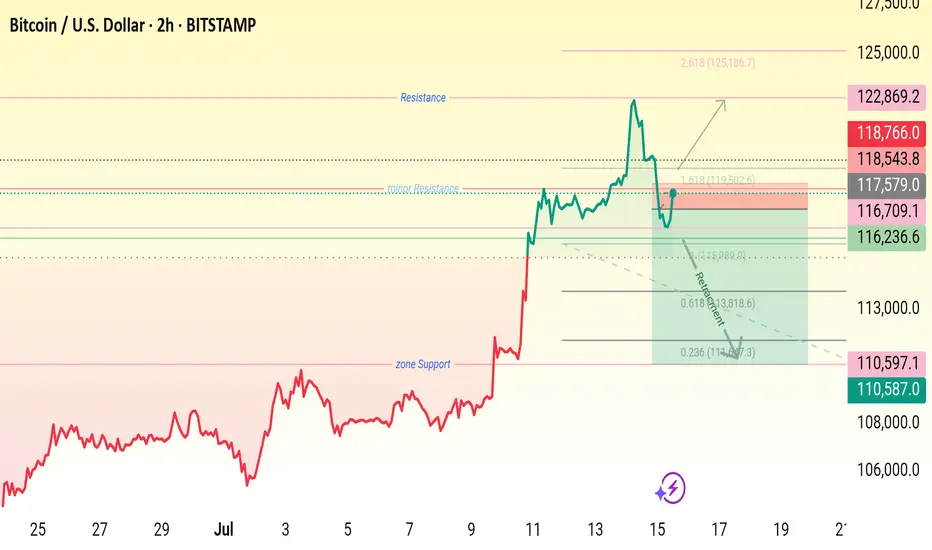
Bitcoin May Pause After Recent Highs📊 Market Move:
Bitcoin (BTC) recently touched an intraday high of ~$122.8K after hitting new all-time highs, supported by a weaker USD, strong institutional inflows, and favorable U.S. regulatory developments (e.g., GENIUS Stablecoin Act, CLARITY Act, and Trump’s executive orders). However, rising volatility (DVOL) and a rebounding USD are signaling a possible short-term correction.
📉 Technical Analysis:
• Key Resistance: ~$123K–$125K
• Nearest Support: ~$117K (with $110K as a major lower support zone)
• EMA: Price is currently above the 9-day EMA → short-term trend remains bullish.
• Candlestick / Volume / Momentum:
• A cup-and-handle formation has emerged, typically a bullish continuation pattern, suggesting a possible 14% rally to ~$134.5K.
• Momentum is still strong; RSI is elevated but not yet overbought (14-day stochastic RSI at ~79.4%).
📌 Outlook:
Bitcoin may consolidate or experience a mild pullback in the short term around the $123K level, especially if the USD continues to strengthen or volatility spikes. However, a clean breakout above $125K could trigger a further rally toward the $134K–$146K range.
💡 Suggested Trading Strategy: (Spot only – no leverage)
🔻 SELL Bitcoin/USD at: $123K–125K
🎯 TP: $117K
❌ SL: $126.5K
🔺 BUY Bitcoin/USD at: $117K–119K
🎯 TP: $123K–125K
❌ SL: $115K
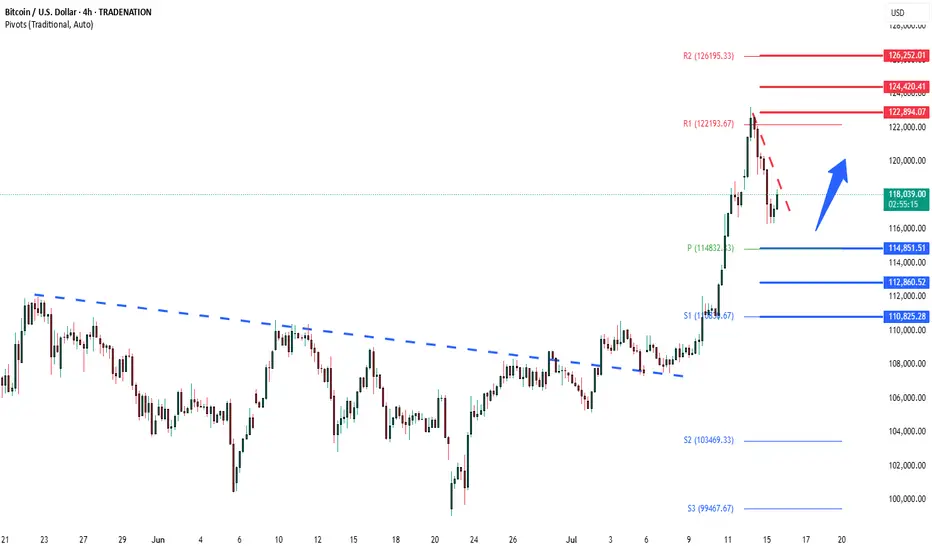
BTCUSD overbought correction supported at 114,850The BTCUSD remains in a bullish trend, with recent price action showing signs of a corrective pullback within the broader uptrend.
Support Zone: 114,850 – a key level from previous consolidation. Price is currently testing or approaching this level.
A bullish rebound from 114,850 would confirm ongoing upside momentum, with potential targets at:
122,900 – initial resistance
124,420 – psychological and structural level
126,250 – extended resistance on the longer-term chart
Bearish Scenario:
A confirmed break and daily close below 114,850 would weaken the bullish outlook and suggest deeper downside risk toward:
112,860 – minor support
110,825 – stronger support and potential demand zone
Outlook:
Bullish bias remains intact while the BTCUSD holds above 114,850. A sustained break below this level could shift momentum to the downside in the short term.
This communication is for informational purposes only and should not be viewed as any form of recommendation as to a particular course of action or as investment advice. It is not intended as an offer or solicitation for the purchase or sale of any financial instrument or as an official confirmation of any transaction. Opinions, estimates and assumptions expressed herein are made as of the date of this communication and are subject to change without notice. This communication has been prepared based upon information, including market prices, data and other information, believed to be reliable; however, Trade Nation does not warrant its completeness or accuracy. All market prices and market data contained in or attached to this communication are indicative and subject to change without notice.
BTC: Buy idea: Bearish ChannelOn BTC we are in a bearish channel situation with a succession of numerous red candles. In such circumstances, we would have a high probability of seeing the market go up. This rise will be impressive if the resistance line is broken forcefully by a large green candle and followed by a large green volume. Good luck everyone!!!
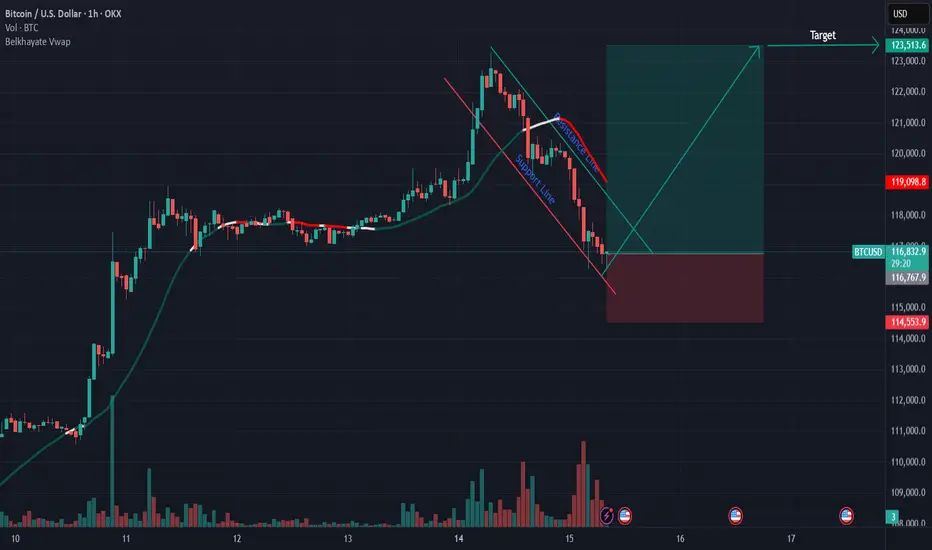
Btc key levels,
Wait for price rejection .
•Entry Zone: 115,900 – 116,700
• Stop Loss: Below 110,587
🎯 Target 1: 118,543
🎯 Target 2: 122,869
• Extension Target: 125,186 (1.618 Fib)
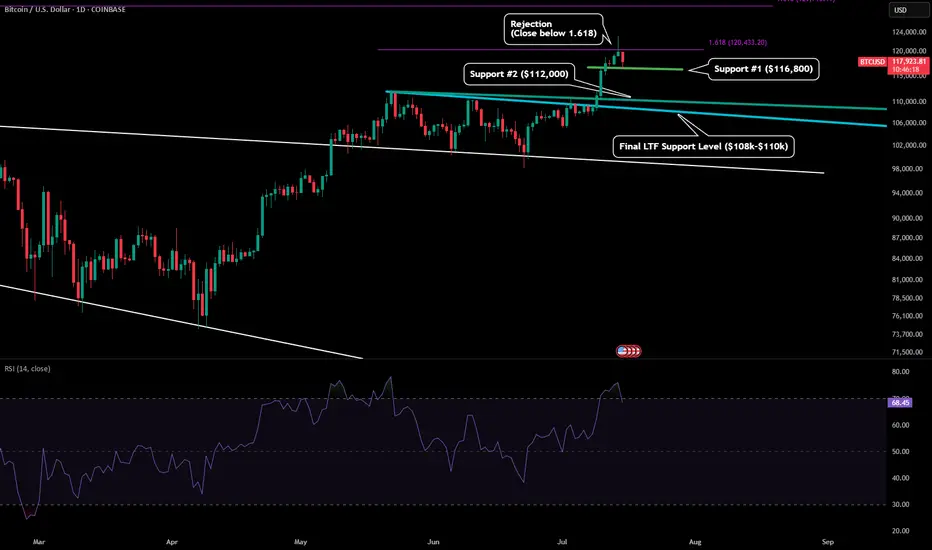
BTC - LTF Retracement TargetsPlease refer to our previous post:
After identifying our first target right around $120.4k we are seeing the first signs of a cooloff. Until we get a daily candle close above this level price is likely to flush some leverage. The main move to $140k area is still likely to happen, but if we see a retracement in the short term here are the LTF levels to watch.
Support level #1 has been established with most of the candle bodies around $116.8k. If we lose that level then price is likely to test our previous ATH.
Support level #2 would be a test of our previous ATH around $112k or our teal trendline that connects the wick tops.
The final support level would be our macro old ATH right around $108-$110k. There is also a trendline there (which depending on what time it could be tested) would also be right in line with those price targets.
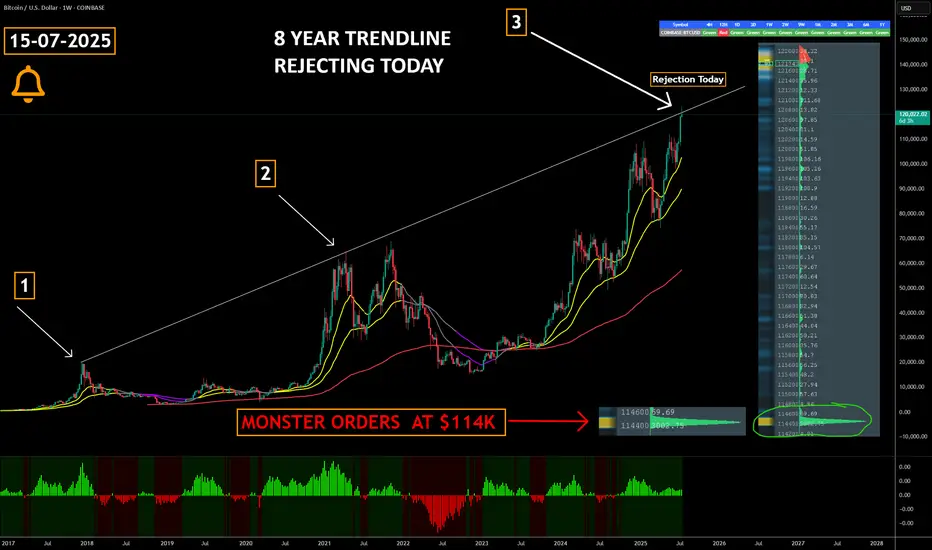
Did Bitcoin Just TOP OUT ??????
COINBASE:BTCUSD has just collided with an 8-year rising trendline that capped the market’s last two cyclical peaks—historically, this level has triggered multi-month corrections and Bear Markets.
Triple-test significance : a third touch of a long-term trendline ➜ heightened odds of a reaction; failure to break cleanly often confirms a major top.
Watch for confirmation signals —weekly bearish RSI divergence, waning volume, or rejection wicks can validate a reversal scenario.
Breakout = regime change : a decisive close and hold above the line flips it to support, opening the door to fresh price discovery and potential parabolic upside.
Large Orders at $114k create a visible demand wall in the order book, signalling that whales / institutions are ready to absorb a dip and accumulate at that level.
Risk-management alert : consider tightening stops, reducing leverage, or hedging until trendline fate is resolved.
The buy pressure has been relentless but this is always worth paying attention to
Marty Boots | 17-Year Trader — smash that , hit LIKE & SUBSCRIBE, and share your views in the comments below so we can make better trades & grow together!
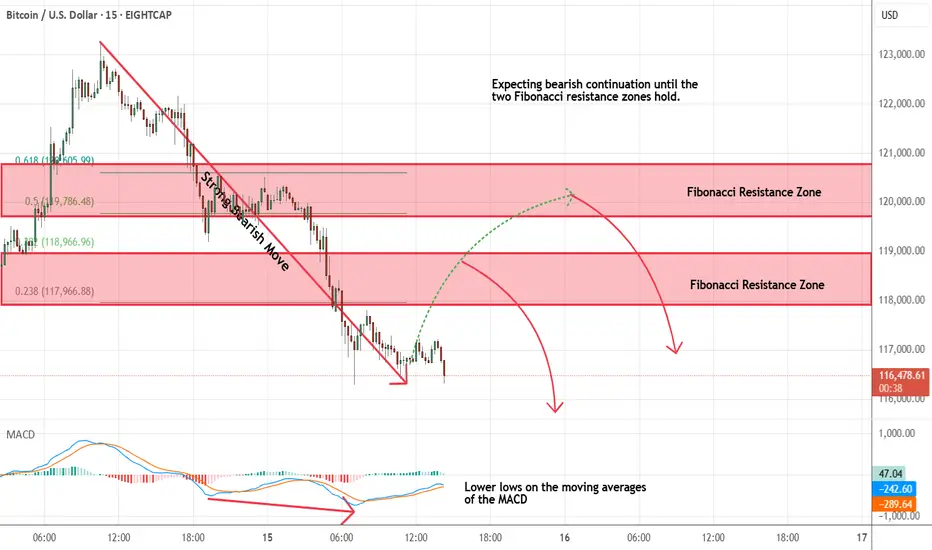
Bitcoin - Looking To Sell Pullbacks In The Short TermM15 - Strong bearish move.
Lower lows on the moving averages of the MACD.
No opposite signs.
Currently it looks like a pullback is happening.
Expecting bearish continuation until the two Fibonacci resistance zones hold.
If you enjoy this idea, don’t forget to LIKE 👍, FOLLOW ✅, SHARE 🙌, and COMMENT ✍! Drop your thoughts and charts below to keep the discussion going. Your support helps keep this content free and reach more people! 🚀
--------------------------------------------------------------------------------------------------------------------
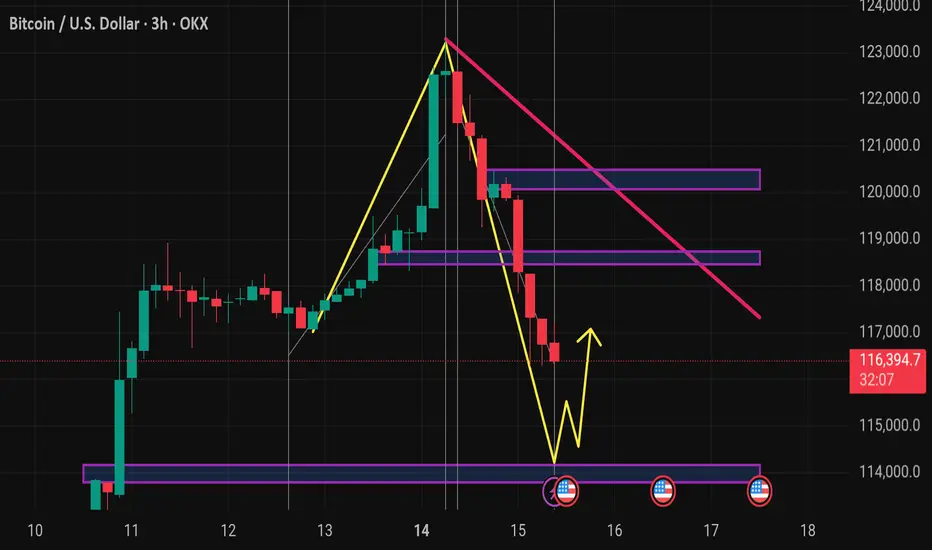
Btcusd techinical analysis.This chart displays the Bitcoin (BTC/USD) 3-hour price action with several technical indicators and patterns annotated. Here's a breakdown of what it shows:
Key Observations:
1. Price Action:
BTC is currently priced around $116,386, showing a -2.93% drop.
A strong downtrend has formed after a significant upward move, possibly forming a bearish ABCD pattern.
2. Harmonic Pattern:
The chart appears to reflect a completed harmonic retracement, with a deep retracement (near 0.88 Fibonacci level).
This suggests a potential reversal or bounce zone.
3. Support & Resistance Zones:
Several purple horizontal boxes indicate key support and resistance zones.
The current price is approaching a major support zone near $114,000–$115,000, which has been tested previously (visible on the left side).
4. Trend Lines:
A pink downward trend line suggests ongoing bearish momentum.
Price may need to break above this line to confirm a reversal.
5. Yellow Zig-Zag Path:
Indicates a possible bullish reversal scenario, predicting a bounce off the lower support zone followed by a move upward.
6. Event Markers:
Red circular icons (with flags) near the support zone hint at upcoming fundamental news/events that may influence price action.
---
Interpretation:
Short-term bias: Bearish until strong support holds (~$114,000–$115,000).
Possible trade setup: Watch for bullish reversal signals at support (candlestick patterns, RSI divergence, etc.) before entering long.
**Risk
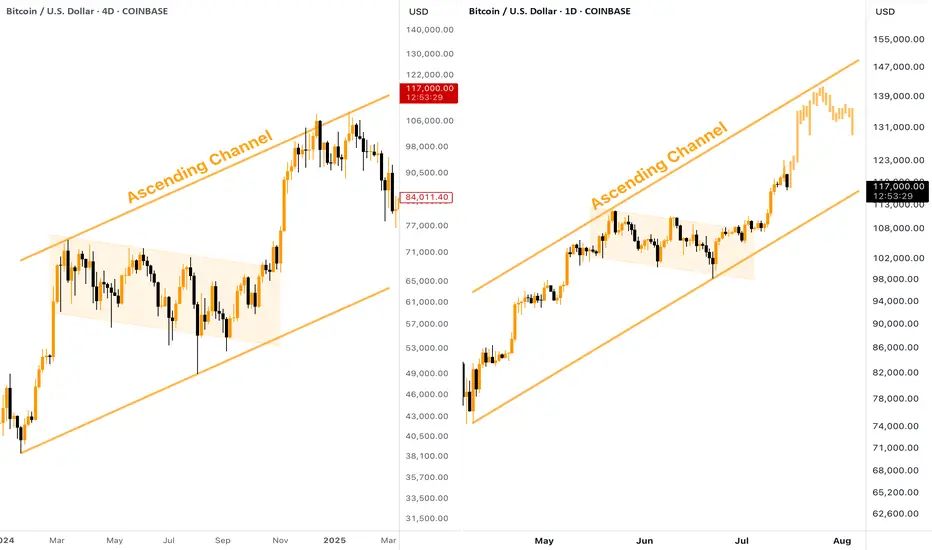
[BITCOIN] - Where is Potential TOP (ATH) of the Bull Cycle?Many people wondering where is the potential TOP of the current Bitcoin Bull Run? Besides setting a Fibo Retracement, we can take a look at the past. The current situation on CRYPTOCAP:BTC chart reminds me of what we've seen in the end of 2024, here is why:
Big ascending channel, price perfectly moves inside without breaking borders
Descending consolidation inside the bull flag
Strong breakout and pump towards the resistance of the channel
👉 According to this pattern, the target for the current Bitcoin upward move should be located in the $140,000 zone. Keep this in mind when planning your trades.
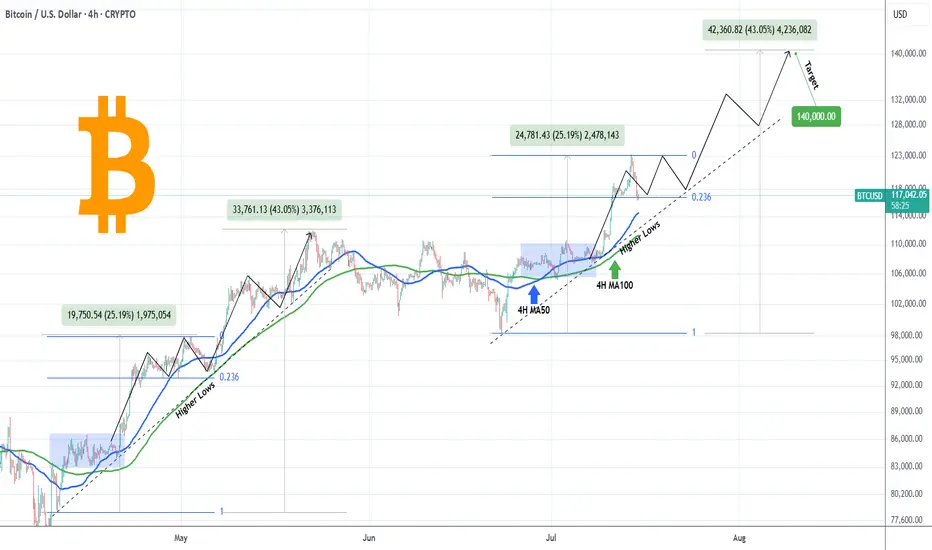
BITCOIN Will it go lower?Bitcoin (BTCUSD) pulled back rather aggressively yesterday after marginally breaking above $123000 and making a new All Time High (ATH).
We've mentioned before the similarities of this Bullish Leg to the April - May structure and so far the current pull-back having already touched the 0.236 Fibonacci retracement level, resembles the late April pull-back.
However, besides the 0.236 Fib, that pull-back also hit its 4H MA50 and rebounded, so that's a condition that hasn't been fulfilled. If it does, we are potentially looking for a Low around the $115k mark. Notice also how both fractals are supported by a Higher Lows trend-line exactly on their respective 4H MA100 (green trend-line) levels.
If BTC continues to replicate this pattern, we expect to see $140000 (+43.05% from the bottom) by early August.
Will the Support levels hold and push it that high? Feel free to let us know in the comments section below!
-------------------------------------------------------------------------------
** Please LIKE 👍, FOLLOW ✅, SHARE 🙌 and COMMENT ✍ if you enjoy this idea! Also share your ideas and charts in the comments section below! This is best way to keep it relevant, support us, keep the content here free and allow the idea to reach as many people as possible. **
-------------------------------------------------------------------------------
💸💸💸💸💸💸
👇 👇 👇 👇 👇 👇
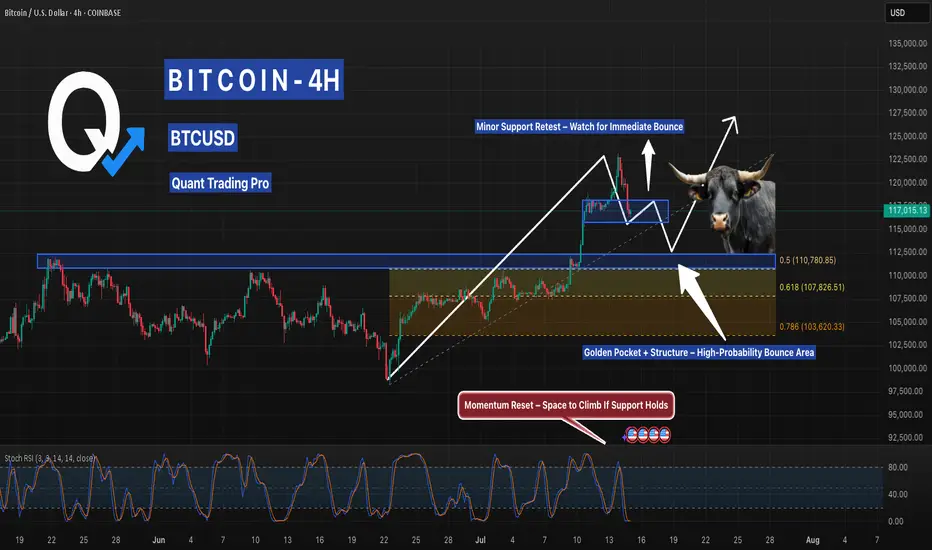
Bitcoin Cooling Off… But the Bulls Aren’t Done YetAfter a sharp run-up, Bitcoin is pulling back into the first support zone just above prior resistance. If this level fails, the 0.5–0.618 Fib area aligned with structure (110K–107K) is the key zone to watch. Bullish momentum could reload from either zone if buyers step in.
This is the zone where smart entries form — not exits. Let price confirm, then strike with precision.
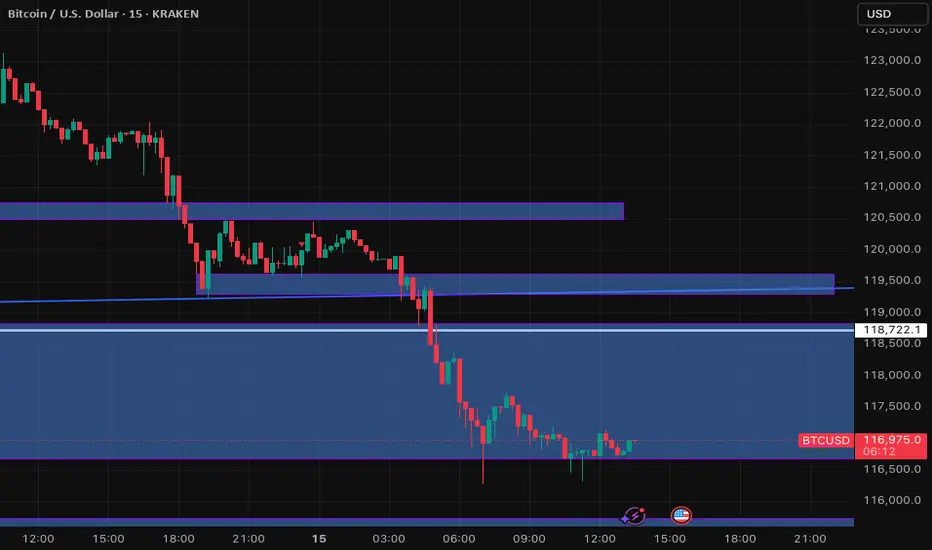
BTC/USD: Multi-Timeframe Breakdown & Retest of Key Demand ZoneThis multi-timeframe analysis for BTC/USD highlights a significant bearish breakdown from prior support levels and a rising trendline. Price has entered and is currently consolidating within a major demand zone around 116,675 - 118,828.8. The analysis focuses on the current price action at this critical support, looking for either a confirmed bounce for a retest of broken resistance, or a decisive breakdown for further downside. Key observations include the strong bearish impulse, the breakdown of a long-term trendline, and the current consolidation at a multi-timeframe demand area. The upcoming 4-hour candle close/open at 16:30 (after 4hr) is a critical time for potential volatility and confirmation of direction.
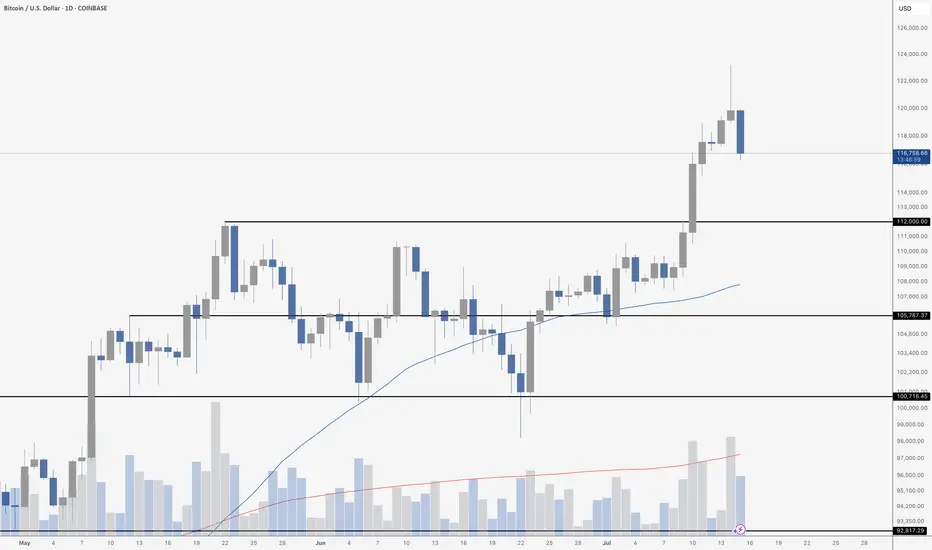
Bitcoin Blow-Off Top?Bitcoin’s daily chart is flashing caution after a sharp reversal candle on Monday was followed by downside continuation today. Yesterday’s session printed an unmistakably ugly candle – a long upper wick signaling rejection at the highs near $120K, with a close well off the top of the range. Crucially, that candle came on elevated volume, adding weight to the move and suggesting a possible blow-off top in the short term.
Today’s follow-through confirms that sellers are taking the reins, at least for now. Price is currently sitting around $116,800 after dropping over 2.5%, with the next major support zone near $112,000 – a level that previously capped price throughout early June before the breakout. If that fails, the 50-day MA and horizontal support around $105,800 should act as the next line of defense.
Volume has remained elevated, showing that this pullback has real participation – not just apathy or a lack of buyers. Bulls need to see price stabilize above $112K and reclaim lost ground quickly, or risk a deeper retrace after such an aggressive upside move.
For now, momentum has clearly stalled, and the risk of a more meaningful correction is on the table.
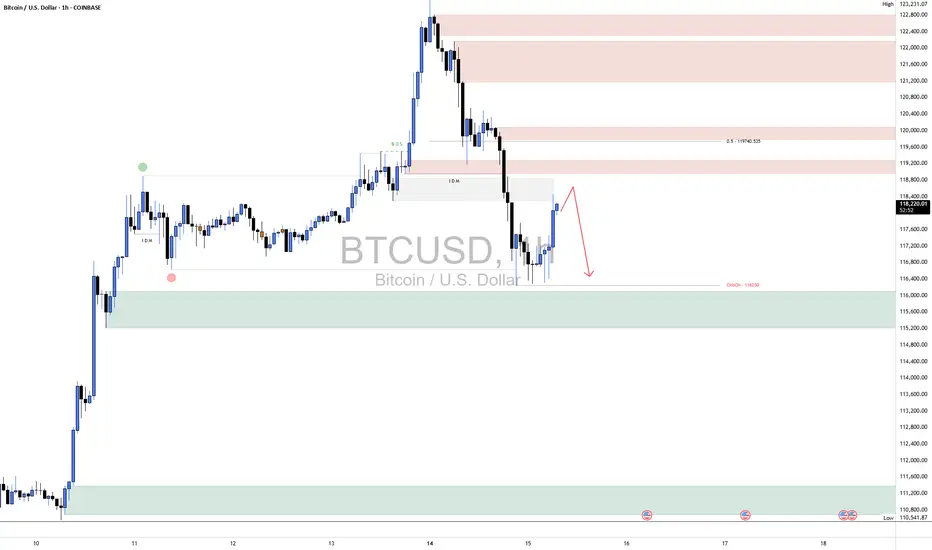
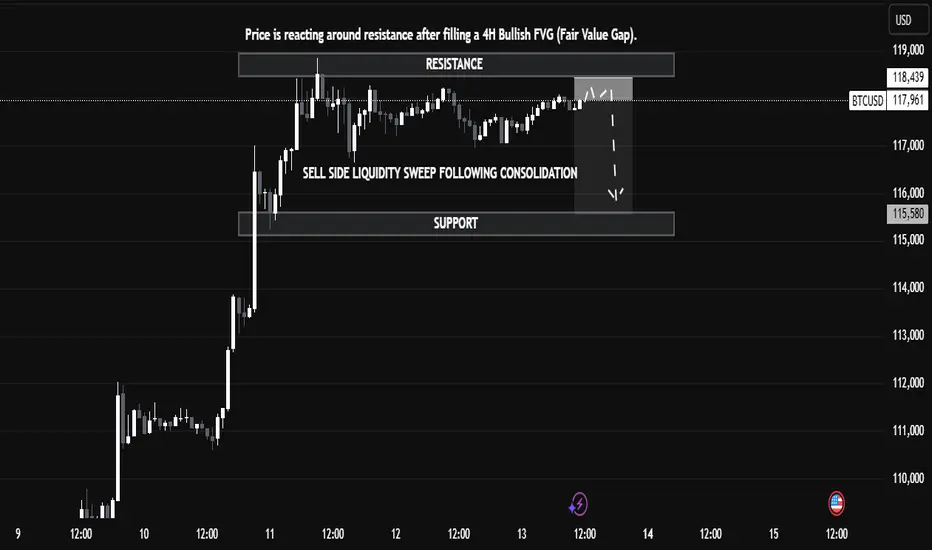
BTC/USD Technical Analysis — Educational BreakdownBTC/USD Technical Analysis — Educational Breakdown (July 13, 2025)
🔍 Market Context
Bitcoin (BTC/USD) is currently trading around $117,913, exhibiting a clear reaction from a well-defined resistance zone between $118,439 and $119,000. This resistance aligns with a previously unfilled 4H Bullish Fair Value Gap (FVG) — a price inefficiency left behind during a strong bullish move — which has now been filled, triggering a pause and reaction in bullish momentum.
🧠 Key Concepts Explained
📘 1. Fair Value Gap (FVG)
In Institutional Price Delivery models (often used in Smart Money Concepts), a Fair Value Gap represents an imbalance in price action — usually between the wicks of candles where price moved too quickly, leaving inefficient trading zones. Price often retraces to these areas before resuming its direction. Here, BTC has filled the 4H Bullish FVG, which acts as a magnet for price and a potential reversal point once filled.
📘 2. Liquidity Sweep
The chart highlights a Sell-Side Liquidity Sweep — this occurs when price dips below a key short-term low or consolidation range to trigger stop-losses and collect liquidity before making its next move. This move is typically engineered by larger market participants to capture orders before deciding on true directional intent.
📘 3. Resistance and Support
Resistance ($118,439 – $119,000): This area is acting as a supply zone where sellers are stepping in after price filled the FVG.
Support ($115,580): This level has previously provided demand and also holds liquidity (stop-losses from long positions), making it a probable target if bearish pressure follows through.
📈 Potential Trade Insight (Educational)
⚠️ This is not financial advice but an educational scenario based on the current technical setup.
Bearish Setup: If price rejects from resistance and forms a lower high, a short entry targeting the support zone at $115,580 could be considered, using a stop above $119,000.
Bullish Invalidator: A break and hold above $119,000 would suggest bullish continuation, potentially targeting higher time frame imbalances or resistance.
📚 Summary & Takeaway for Learners
This chart presents an excellent case study in understanding how institutional concepts like FVGs, liquidity sweeps, and key supply/demand zones interact in real price action. Traders can learn the following from this setup:
Price doesn’t move randomly — it often targets liquidity and imbalances.
Patience is key — waiting for confirmation at known reaction zones can improve trade accuracy.
Market context matters — a filled FVG at resistance combined with a liquidity sweep gives confluence to a bearish outlook.
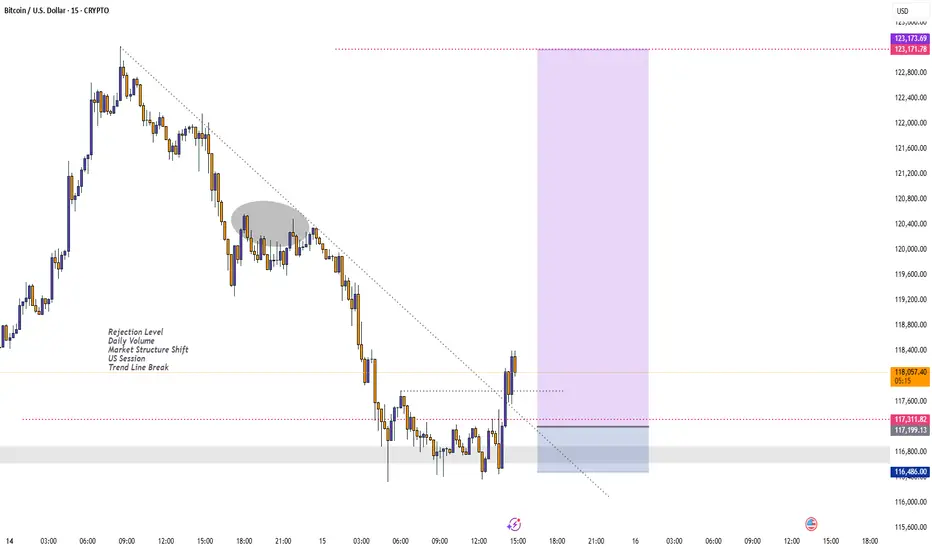
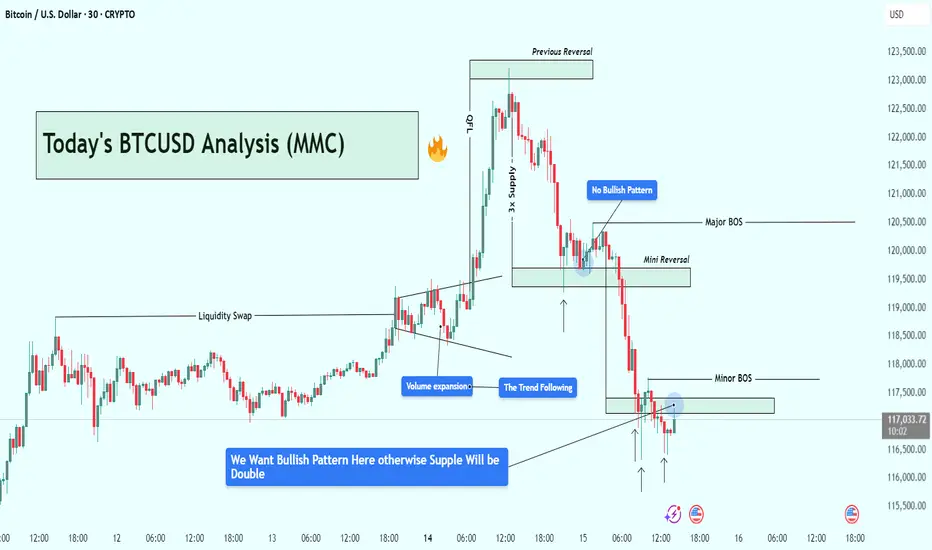
BTCUSD Analysis : Bitcoin Trend Shifted/Bullish Pattern + Target🧭 Overview:
Bitcoin’s recent price action has delivered a textbook sequence of institutional liquidity play, volume-driven breakout, and supply zone rejection. After rallying on increasing volume, BTC tapped into a significant 3x Supply Zone—which also served as a previous reversal point—and was swiftly rejected. The market is now trading around a key decision zone where traders must stay alert for a confirmed bullish reversal, or risk getting caught in further downside.
🔍 Step-by-Step Technical Breakdown:
🔸 Liquidity Grab + Volume Expansion
The move began with a liquidity sweep, as BTC pushed above recent highs, hunting stop-losses and inducing breakout traders. This kind of price manipulation is typical of smart money accumulation/distribution zones.
Immediately following that, we observed a volume expansion—a strong signal that institutional players had stepped in, propelling BTC upward with conviction. This expansion pushed price sharply into the 3x Supply Zone, a critical zone of interest from a previous bearish reversal.
🔸 3x Supply Zone – The Turning Point
Once price entered the 3x Supply Zone, bearish pressure resumed. No bullish continuation pattern appeared on the second attempt into this zone—confirming that sellers were defending it aggressively. This area has now been validated as a strong supply barrier, capable of initiating trend reversals.
🔸 Major BOS – Structural Shift Confirmed
Price broke below key support around $120,500, which marked a Major Break of Structure (BOS). This BOS is crucial—it represents a shift from a bullish to bearish market structure and is often the signal that retail longs are trapped.
This BOS was followed by a mini reversal zone, but again, no bullish confirmation appeared there—highlighting market weakness.
🔸 Minor BOS & Trendline Breakdown
Further downside action led to a Minor BOS near $117,800, reinforcing the bearish sentiment. Additionally, the ascending trendline—which had supported BTC’s rally—was decisively broken and retested from below. This confirms a shift in momentum, now favoring sellers.
📍 Current Price Action – Critical Decision Zone
BTC is currently hovering around $117,000, right at a potential demand zone. While there was a brief bullish reaction, the market hasn’t formed a valid bullish reversal pattern yet.
There’s a clear message from the chart:
“We want a bullish pattern here—otherwise, support will break and supply will double.”
In simple terms, unless bulls step in with structure (higher low, engulfing candle, etc.), sellers will likely take over, and price may test deeper support levels.
🎯 What to Watch Next:
✅ Bullish Case:
If BTC forms a strong reversal pattern (e.g., double bottom, bullish engulfing, or inverse head & shoulders), we can expect a short-term recovery back to:
Target 1: $118,500
Target 2: $120,000–$120,500
❌ Bearish Case:
Failure to hold this zone and no clear bullish pattern = likely continuation to the downside, potentially targeting:
$116,000
Even $114,500 in extended moves
🧠 Trading Insights (Educational):
Volume + Structure = Edge
Don’t rely solely on candlestick signals—combine them with structural breaks and volume to get confluence.
Supply Zones Aren’t Just Rectangles
The 3x Supply Zone was powerful because it had historical context, volume convergence, and psychological resistance. These layered factors make zones more reliable.
BOS Isn’t a Trendline Break
BOS means real structural shift. In this case, lower highs and lower lows confirmed the change.
💡 Final Thoughts:
BTC is at a make-or-break level. The recent rejection at the 3x supply zone has shifted the momentum, and buyers must prove their strength now—or risk watching the price unravel further.
Stay patient, wait for structure, and never fight momentum.
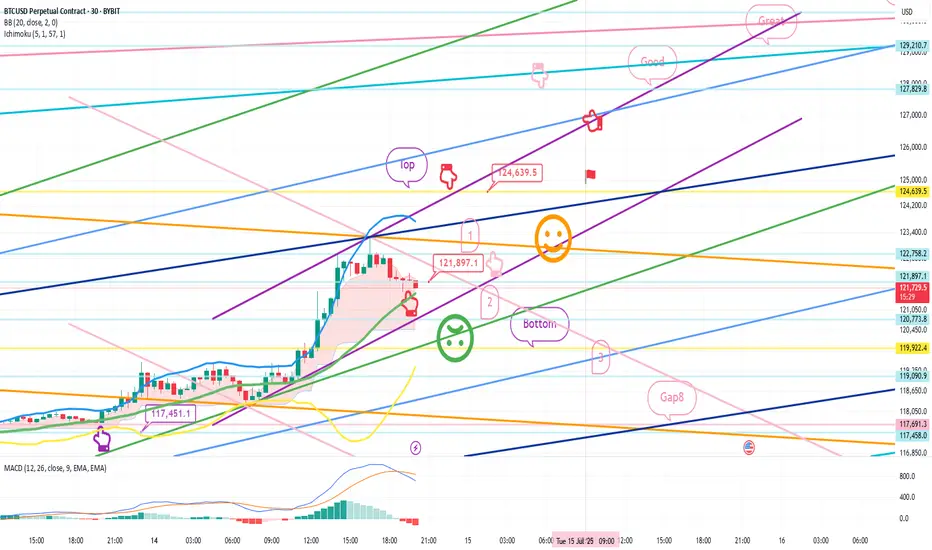
July 14 Bitcoin Bybit chart analysisHello
It's a Bitcoin Guide.
If you "follow"
You can receive real-time movement paths and comment notifications on major sections.
If my analysis was helpful,
Please click the booster button at the bottom.
This is a Bitcoin 30-minute chart.
There is no separate Nasdaq indicator announcement.
Nasdaq upper gap reversal condition and
Bitcoin is moving sideways after a sharp rebound until the afternoon.
I created today's strategy based on the vertical decline condition based on the 5-minute trend reversal in Tether Dominance.
On the lower left, I connected the long position entry section of 117,451.1 dollars that I entered on the 11th.
* In the case of the red finger movement path,
This is a one-way long position
current position chase purchase strategy.
1. Chasing purchase at 121,897.1 dollars / Stop loss price when the green support line is broken
2. 124,639.5 dollars long position 1st target -> Good, Great in order of target price
Since I left a simulation in the middle,
I think it would be good to use it for re-entry after liquidating the long position.
The movement within the 1st section at the top and the 2nd section at the bottom
is an extreme sideways movement, and from a long position,
if it succeeds in rebounding within the 2nd section, it becomes a strong upward condition.
From the 3rd section breakout today,
the low point is broken in the newly created weekly and daily chart candles this week,
so please note that the upward trend may be delayed.
The next support line is the Gap8 section created last week.
Up to this point, I ask that you simply refer to and utilize my analysis
and I hope that you operate safely with principle trading and stop loss prices.
Thank you.
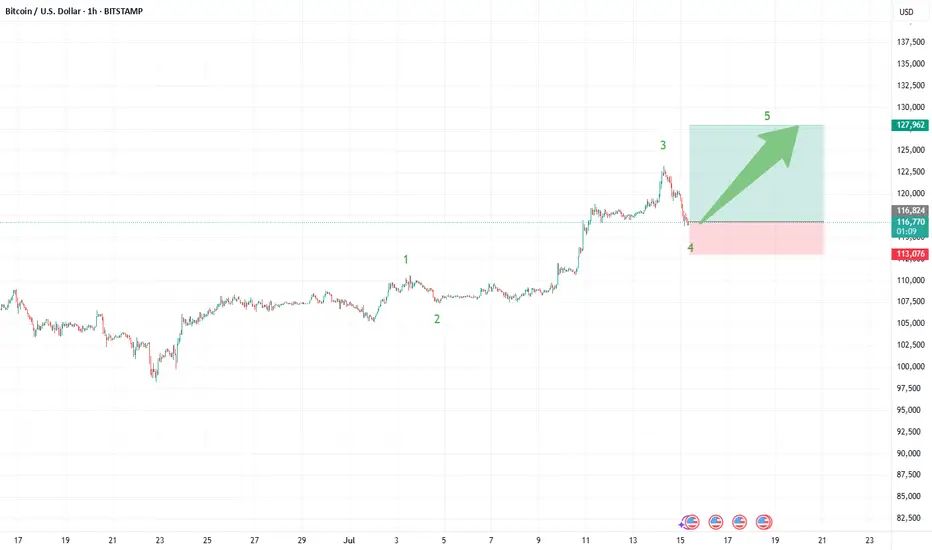
Bitcoin (BTCUSDT): Trade Wave 5—Next Stop $127,000?Bitcoin’s current structure is lining up for a classic Elliott Wave fifth wave scenario, and the setup could offer a high-reward trade as we look for a measured push toward the $127,000 area. Here’s what’s standing out in the recent price action:
What the Current Structure Shows (Primary Scenario)
Wave 4 Correction Complete: After peaking in wave iii near $124,000, BTC pulled back and has potentially completed a wave iv correction. Price respected the Fibonacci retracement zones bouncing near the 38.2% retracement at $117,116.
Preparing for Wave 5: With support confirmed, price action is stabilizing and looks primed for a final motive push—wave 5—to the upside. The target projection for wave 5 is around $127,000, in line with both the 61.8% extension of the previous swing and the common equality projection for wave 5 vs. wave 1 when wave 3 is extended.
Why the Count Is Labeled This Way
The advance from early July kicked off with impulsive movement, subdividing cleanly into smaller waves that align with classic Elliott structure.
Wave iii is the clear standout—steep, extended, and carrying most of the move’s energy, which checks the box for a strong third wave.
The cluster of Fibonacci and previous resistance/support near $127,000 offers strong technical confluence for the next objective.
Trade Setup: Riding Wave 5 to $127,000
Entry Zone: Consider longs on breakouts above the current consolidation, ideally after confirmation of support holding near $117,100–$116,000.
Stop Loss: Place stops just below $113,300 (the 61.8% retracement), or tighter for risk management depending on your position size and timeframe.
Target: $127,000—where wave 5 projects to equal the length of wave 1 and aligns with multiple Fibonacci targets.
What to Watch Next (Confirmation or Invalidation)
Confirmation: An impulsive move above the interim high at $120,000–$121,000 with strong volume would confirm wave 5 is underway and that bulls have regained control.
Invalidation: A break below $110,500 would invalidate this setup and suggest a more complex correction is taking shape.
Final Steps: Monitor for impulsive character in the rally—wave 5s can sometimes truncate, so don’t get complacent at resistance.
Alternate Count
If price fails to hold support and breaks down, BTC could still be in an extended or complex fourth-wave correction—possibly a running flat or triangle—before wave 5 eventually resumes.
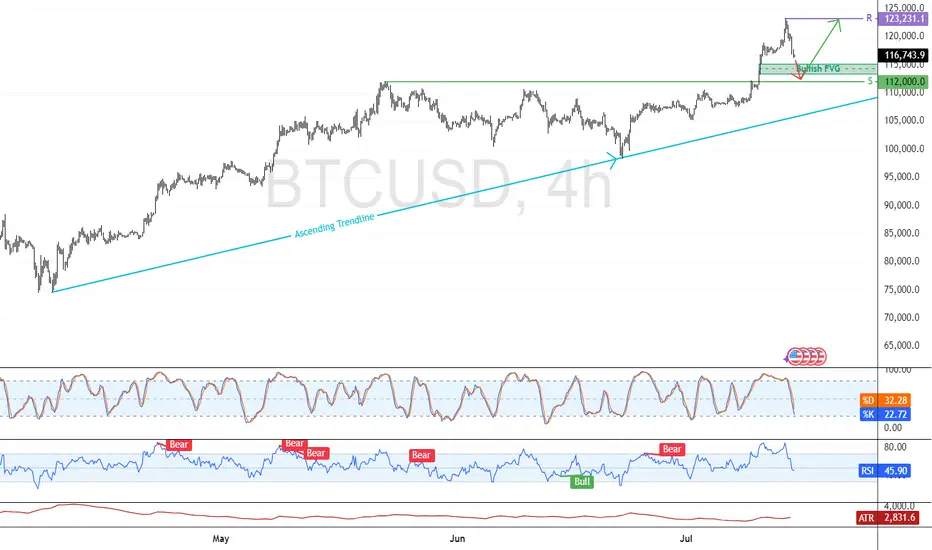
Bitcoin: Support at $112K Holds Key to Bullish ContinuationFenzoFx—Bitcoin is bullish, trading above $112,000.0 after forming a new all-time high at $123,231.0. The current dip may offer a strong reentry if $112,000.0 holds as support, aligning with a bullish fair value gap.
Price remains above the ascending trendline, reinforcing the bullish outlook. If momentum continues and BTC breaks past $123,231.0, the next target could be $130,000.0.
A fall below the trendline would invalidate the bullish setup.
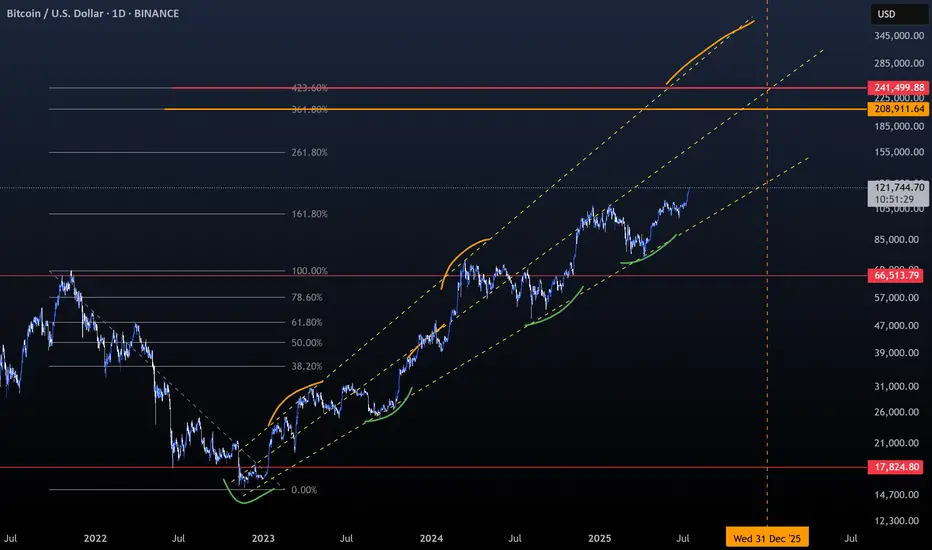
Bitcoin Early, Not LateA simple graphic with all annotations included :
- Trend.
- Fibonnacci.
- Middle Line.
- Support and Bounces.
- Resistances and dips.
- Everyone gets Bitcoin at the price they deserve.
- Not a price Prediction, keep things simple.
Happy Tr4Ding !
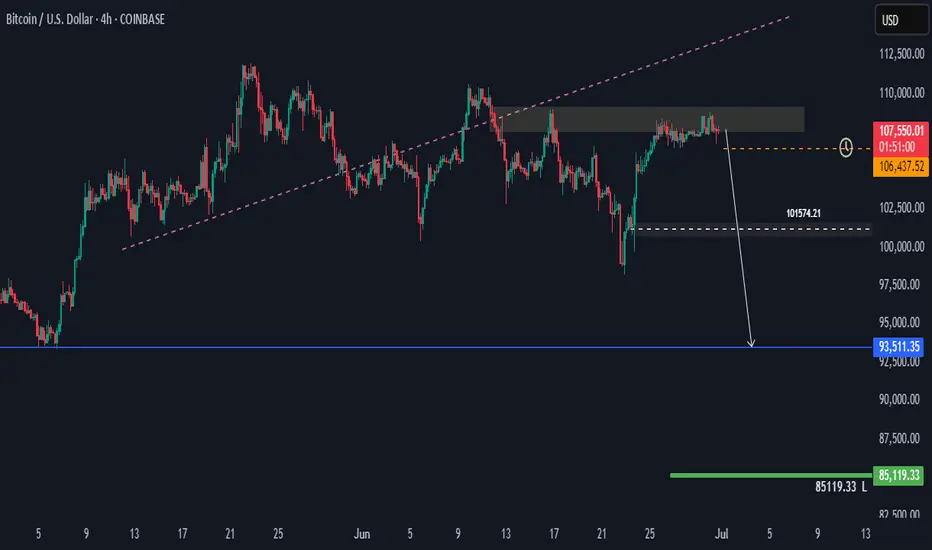
BTCUSD H4 Potential DropHi there,
BTCUSD H4: As long as the 85,119.33 level holds, the overall trend remains bullish in a larger scope.
Currently, the price is trading below the diagonal dotted trendline. The further it stays below this trendline, the stronger the bears' position.
The level of 101,574.21 is open for a bias towards 93,511.35.
Happy Trading,
K.
Not trading advice.
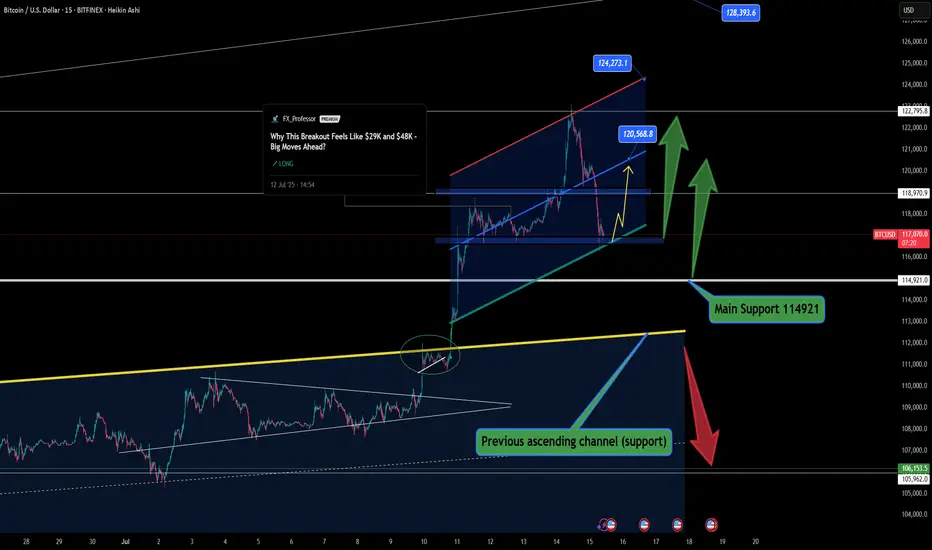
BTC Rebounds From Channel Support With Critical Levels In Focus BTC Rebounds From Channel Support With Critical Levels In Focus 🟢📉
Structure remains firmly bullish, and price action is still unfolding within our previous analysis. After the breakout above the yellow trendline, BTC has entered a new ascending channel, and we’re now testing the lower boundary of this rising structure.
The main support sits at 114,921, the level from which the breakout occurred—an essential zone that may or may not be revisited. Based on market behavior and momentum, I currently do not expect this level to be retested, but it's one that must always be respected.
🟩 A deeper correction could lead us toward the previous ascending channel support near 112,400. This would be the last resort for bulls to hold structure intact.
⚠️ A break below 112K changes the narrative completely. That would mean we’re stepping into a potential trend reversal zone—so the market could be setting up for something more significant if that unfolds.
That said, my expectation leans toward a rebound from current levels. The sell-off may have flushed out late long entries, creating space for renewed bullish momentum. Let’s follow the levels and trade what we see—not what we feel.
One Love,
The FXPROFESSOR 💙
Disclosure: I am happy to be part of the Trade Nation's Influencer program and receive a monthly fee for using their TradingView charts in my analysis. Awesome broker, where the trader really comes first! 🌟🤝📈