BTC The chart displays Bitcoin (BTC/USD) on the 1-hour timeframeThe chart displays Bitcoin (BTC/USD) on the 1-hour timeframe with clear horizontal support and resistance levels. A potential bullish harmonic pattern (likely a Bullish ABCD or Bat pattern) has formed, completing near the 117,200 support zone. Price is consolidating within a descending wedge, indicating potential reversal or breakout. Watch for a bounce from support or breakout above the wedge for bullish confirmation.
BTCUSD.P trade ideas

Altcoins and BTC: Macro Structures, Key Levels, and What’s NextIn this Sunday's market crypto-market analysis, I'm sharing trend structures and key support zones for the total altcoin market cap (excluding BTC and ETH), as well as for ETH, XRP, BNB, SOL, HYPE, and BTC. I also outline my main scenarios for market movement through the end of August and the rest of the year.
Key takeaways:
- Impulsive structures are shifting to diagonal structures — less stable and growth cycle is likly approaching the final phase of this market cycle.
- As long as prices hold above key macro support zones, the uptrend structure remains intact.
- I don’t rule out another sell-off early this week, deeper into support zones, followed by a potential rebound through late August, then a phase of consolidation (ideally staying above the current correction lows from the July top), and one final rally to new highs starting mid-autumn and continuing toward year-end.
-I expect ETH, XRP, and BNB to be the primary beneficiaries of the next wave of growth.
Total Altcoin Market Cap (Excluding BTC & ETH)
Support zone: 955-913B
Target resistance zone: 1.19-1.26T
BITSTAMP:ETHUSD
Support zone: 3400–3200 (possible extension to 3000)
Target resistance zone: 4300–5100+
BINANCE:XRPUSDT
Support zone: 2.7–2.5
Target resistance zone: 5.2+
BINANCE:SOLUSDT
Support zone: 170–150
Target resistance zone: 250–300
CRYPTO:HYPEHUSD
Support zone: 33–30
Target resistance zone: 60–72
BINANCE:BNBUSD
Support zone: 510–530
Target resistance zone: 960–1000
BTC Dominance
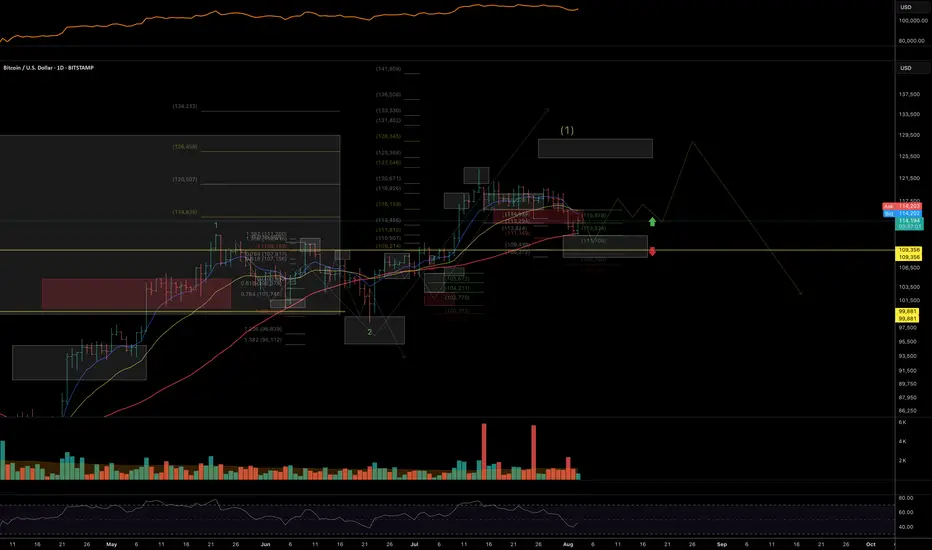
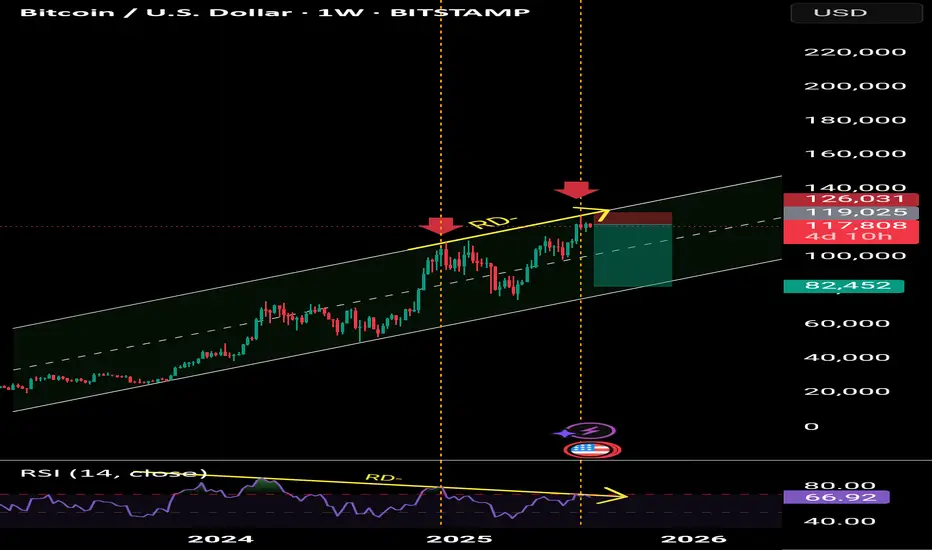
BITSTAMP:BTCUSD
Support zone: 111–109K
Target resistance zone: 125–130/135K
If you’d like me to cover a specific coin, leave a comment — I’ll include it in future updates or prepare a short video breakdown.
Thanks for your attention, and I wish everyone a strong start to the week and well-grounded investment decisions!

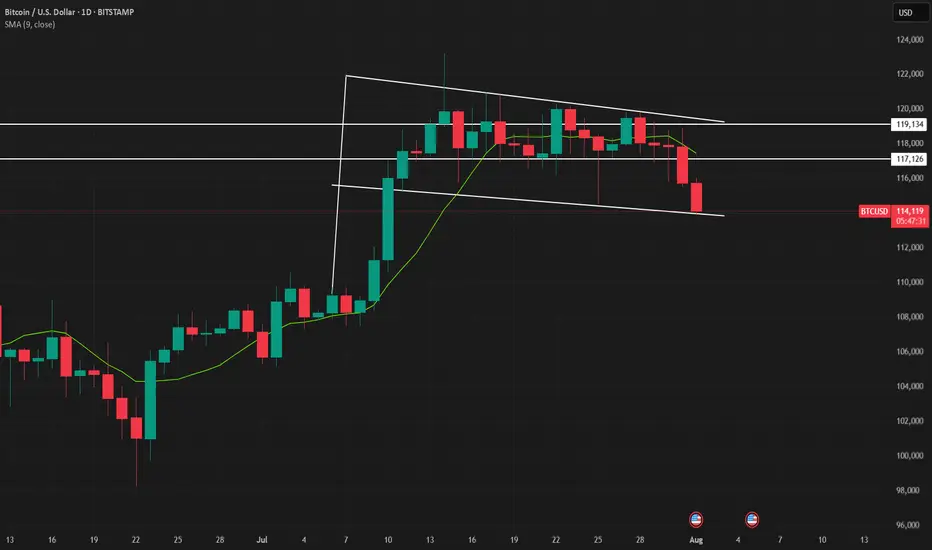
Bitcoin Bull Flag - will it collapse?Bitcoin is currently in a bull flag.
Will it hold — or collapse?
The weekly close will decide.
🔹 If BTC closes above the bull flag support: Possible continuation of the rally.
🔻 If BTC closes below the flag: Expect a deeper correction.
Stay sharp. The weekly close is key IMO.
No FA. DYOR! For educational purpose only.
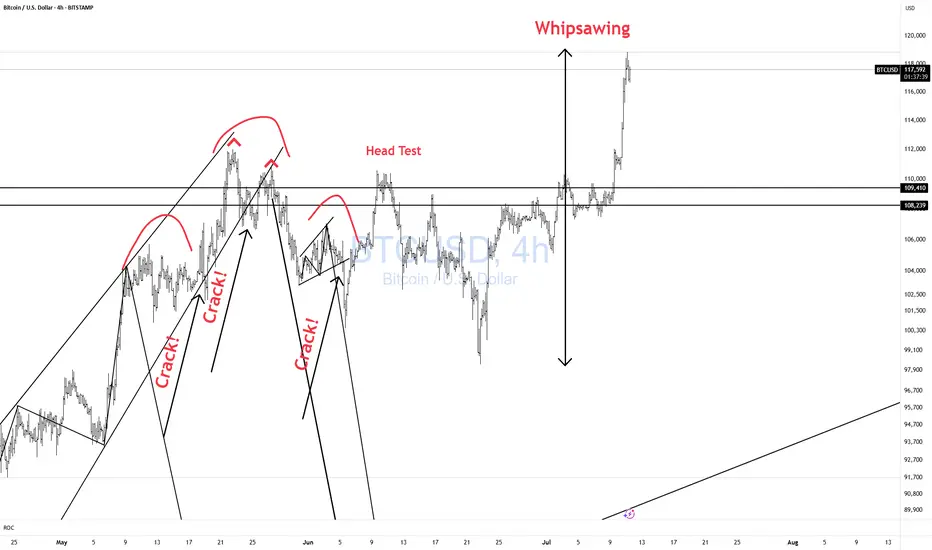
BTCUSD Whipsawing! CAUTION!Bulls CAUTION! Price is whipsawing all over the place.
Better to be out of the market wishing you were in than in wishing you were out!! Don't chase!!
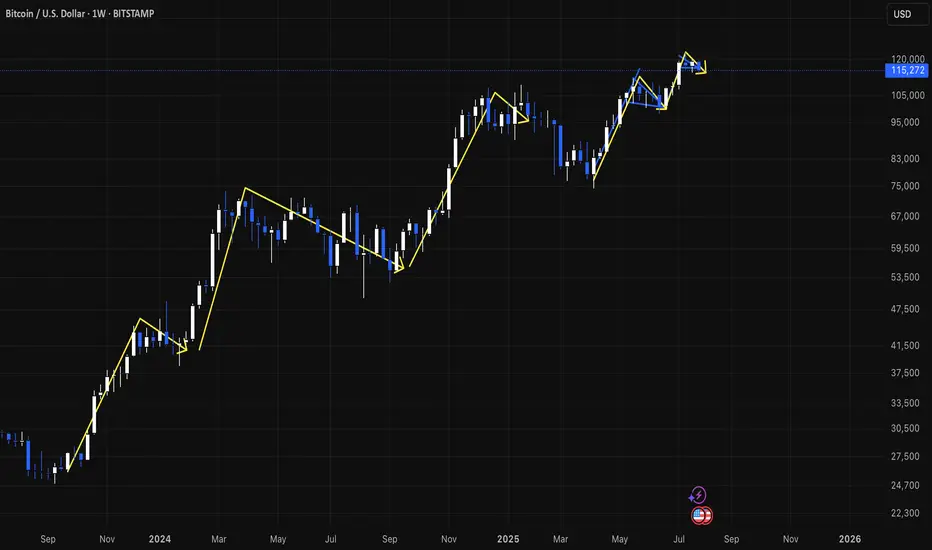
btc consolidation and downentire bull market has been big impulse move up then consolidation and slightly more down than would be expected with typical bull flag
Bitcoin Forming a New Range?After all of the ups and downs over the past few days, I zoom out to a higher time frame to get a grasp of what's really happening. With three hours or so left in the day it looks most likely that the formation of a new range is in the works. I'm looking for two options over the next few hours, one being that it gets right back into the previous range and is all just a wick on the weekly chart which caused three days of panic for absolutely no reason. This would probably be hilarious but also the less likely outcome!

Inflection Zone, Do or Die levelI've drawn up a couple of major pivot points that I expect BITSTAMP:BTCUSD to consolidate at before continuing either up or down.
The market is in my opinion currently feeling a little bit confused and not quite fearful yet but a little bit doubtful anyway. The melt up has been real, and for some painful, as directional movement is at most only half of what matters. So this injection of volatility is welcomed at least by me, and I've been fairly exposed to growth stocks in my port lately.
Based on fibonacci phi channels and other confluences of support locations, it looks like we've turned a corner and are on the way down, but I'd be surprised if we breached 107k and as shown, if that did happen, there is a LOT of underlying supply.
I don't know where we go from here but I wanted to point out this level highlighted in light blue, as its historically been a major line in the sand for BTC.

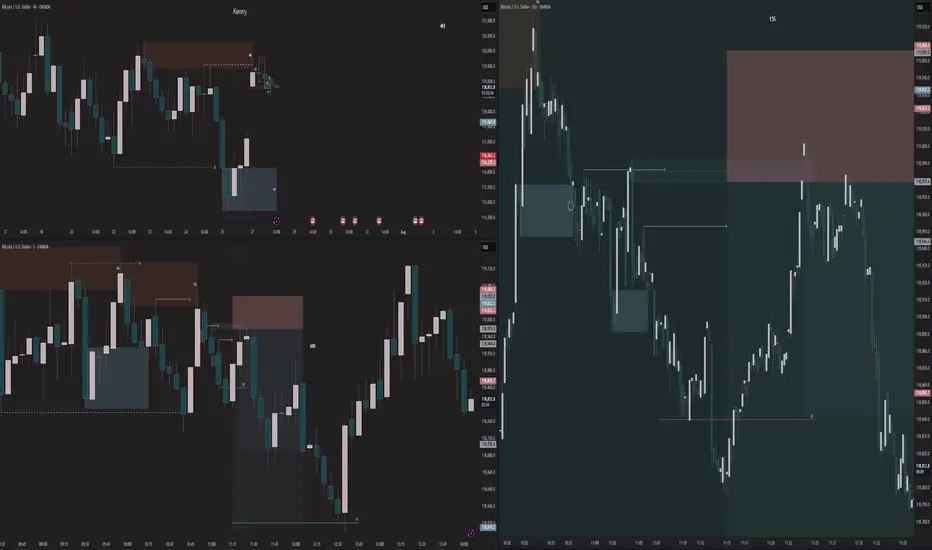
BTCUSD SHORTBTCUSD 6RR short | 15s entry | 5m confirmation | 4H trend bias
Caught the shift as 5m structure broke, creating a flip liquidity grab for the zone above — making it even stronger.
4H wasn’t clean, but the imbalance below gave full reason for lower prices — and that’s exactly what birthed the short.
Zero emotion. Risk defined.
Just posting what works.
BTC PERPETUAL TRADE ,Short from $113,700
BTC PERPETUAL TRADE
SELL SETUP
Short from $113,700
Currently $113,700
Stoploss $116,800
Targeting $111,600 or Down
(Trading plan BTC go up to $115K
will add more shorts)
Follow the notes for updates
In the event of an early exit,
this analysis will be updated.
Its not a Financial advice

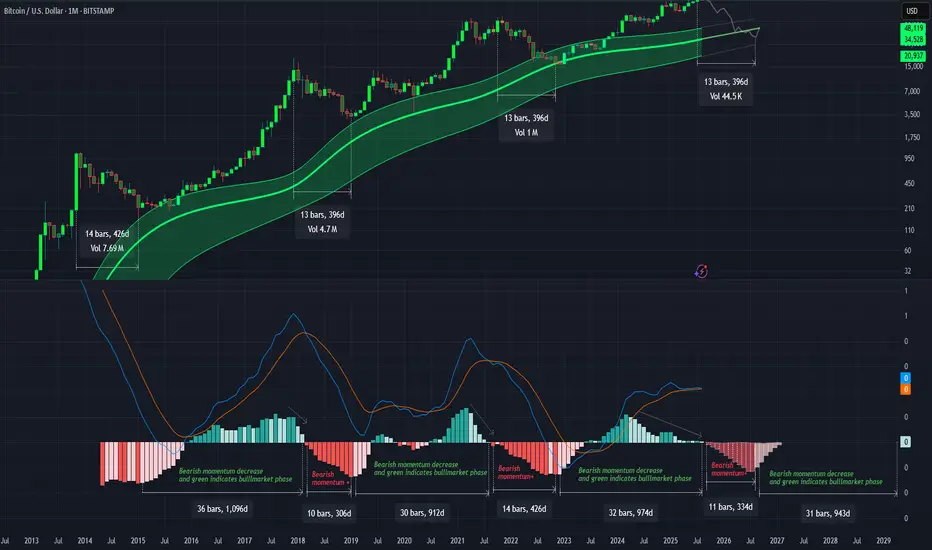
Gaussian and the LMACD deep dive!As you can see LMACD is showing signs of exhaustion. Histogram has been compressing or decreasing in momentum while the price has been climbing up. This divergence wont last for too long and a change in the trend seem very likely. BTC might be entering in the bear market pretty soon and you might start seeing the histogram turning red and increasing in bearish momentum before changing the trend once we approach to the core of the Gaussian or even bellow this time. Breaking bellow the core would mean range bellow 40k as bear market bottom.
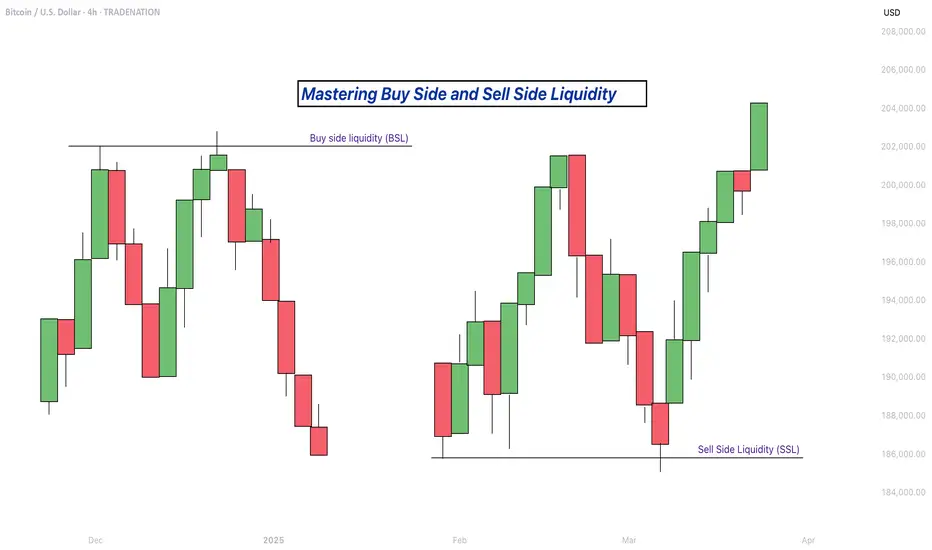
Mastering Buy Side and Sell Side Liquidity - How to trade it!In trading, understanding liquidity is one of the keys to predicting where the market might go next. The Inner Circle Trader (ICT) method teaches traders how to recognize where big players like banks and institutions are likely to enter or exit trades. Two important ideas in ICT trading are buy side liquidity and sell side liquidity. Once you understand what these terms mean and how to spot them on a chart, you can start using them to find better trading opportunities.
What will be discussed?
- What is Buy Side Liquidity?
- What is Sell Side Liquidity?
- How do you see Buy and Sell Side Liquidity?
- Examples
- How to trade BSL and SLL Liquidity?
What is Buy Side Liquidity
Buy side liquidity is found above market highs. It refers to all the stop loss orders from people who are holding short positions. When the market is going down, some traders sell (or go short) and place their stop losses above recent highs to protect themselves. These stop losses are actually buy orders because closing a short position requires buying. Big institutions know this, so they push price upward to trigger those stop losses and grab that liquidity. That’s why you’ll often see the market spike above a recent high before reversing. That spike is the market grabbing buy side liquidity.
What is Sell Side Liquidity
Sell side liquidity is the opposite. It’s found below recent lows. This is where traders who are buying (going long) place their stop losses. If someone buys a market, they’ll usually put a stop loss just below a previous low. That stop loss is a sell order. Smart money looks at these areas as pools of sell side liquidity. So when the market moves down quickly and breaks a recent low, it’s likely collecting those sell stop orders. After that, you’ll often see a reversal because the liquidity has been taken.
How do you see Buy and Sell Side Liquidity?
You can spot buy side and sell side liquidity by looking at the chart and identifying recent highs and lows where many traders might have placed stop losses. These are usually obvious swing highs and swing lows. If you look at a chart and see a clean high where price previously reversed, that’s likely where traders are placing stops. That makes it a target for buy side liquidity. Same for a recent low, if it’s a clean level where people might have bought in the past, that low probably holds sell side liquidity. The more obvious the level looks, the more likely it’s full of stops and therefore a liquidity target.
Examples
How to trade BSL and SLL Liquidity?
Trading liquidity means watching for the market to run above a recent high (to take buy side liquidity) or below a recent low (to take sell side liquidity), and then looking for signs of reversal. Once liquidity has been taken, the market often changes direction.
When you’re trading the ICT concept of liquidity, the key is not just spotting where liquidity lies, but also knowing when price is likely to reverse after that liquidity has been taken. Reversals don’t happen randomly, they leave clues on the chart. Here’s how you can recognize those signs in a simple way:
1. Market Structure Break
This is one of the clearest signs of a reversal. Let’s say the market grabs sell side liquidity by breaking below a recent low. If price then quickly starts moving up and breaks above the last lower high, that’s a break in structure. It shows that sellers are losing control and buyers are stepping in. It’s the first confirmation that the direction might be changing.
2. Rejection Wicks or Strong Candles
After price runs into liquidity (above a high or below a low), watch the candlesticks closely. If you see a long wick rejecting the level, or a strong candle in the opposite direction right after the liquidity grab, that’s a clue. It means price went there, collected the orders, and got rejected fast. That rejection shows the market might be reversing.
3. Fair Value Gaps (FVGs)
Fair value gaps are small “windows” left in price when it moves quickly in one direction. After liquidity is taken and price starts reversing, it often leaves an FVG behind. If price pulls back into that gap and holds, that can be a great entry point. FVGs act like magnets and support zones in ICT.
4. Displacement
Displacement is a strong, impulsive move that breaks structure. It usually happens right after liquidity is taken. If price moves very fast in the opposite direction after hitting a liquidity level, that’s a good sign smart money is behind the move and it’s not just random noise. That strong push is a hint that a new trend might be forming.
5. Change in Character (CHOCH)
This is a shift in how the market behaves. For example, price might be making lower highs and lower lows (a bearish trend), but after liquidity is taken, it suddenly starts making higher highs and higher lows. That change in character tells you the trend might be reversing.
-------------------------
Disclosure: I am part of Trade Nation's Influencer program and receive a monthly fee for using their TradingView charts in my analysis.
Thanks for your support. If you enjoyed this analysis, make sure to follow me so you don't miss the next one. And if you found it helpful, feel free to drop a like 👍 and leave a comment 💬, I’d love to hear your thoughts!
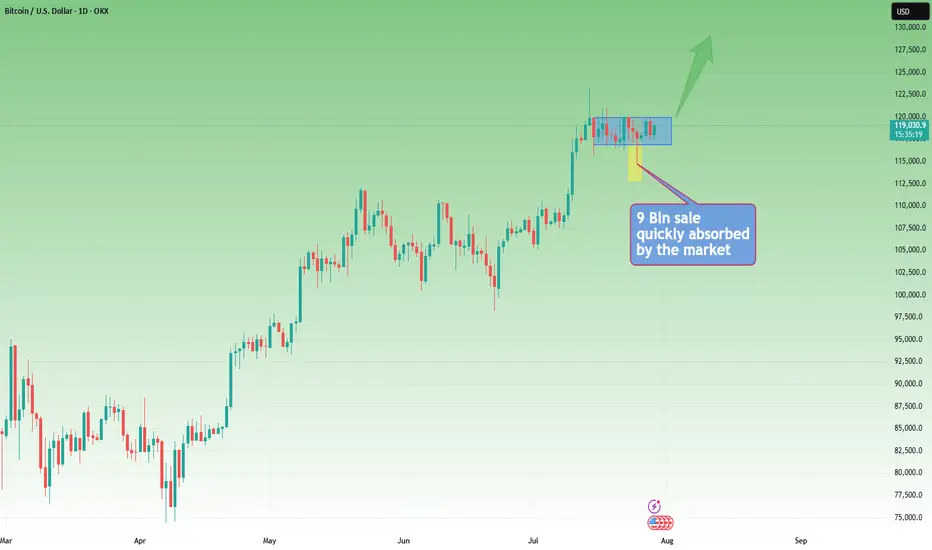
Bitcoin Passes Stress TestOn July 25, 2025, Galaxy Digital executed one of the largest Bitcoin sales ever recorded: 80,000 BTC, valued at approximately $9 billion , on behalf of a Satoshi-era investor.
Despite the size, the market absorbed the flow with minimal volatility—Bitcoin dipped from around $119,000 to $115,000, then rebounded above $119,000.
Liquidity Maturity in Motion
Analysts called the trade a significant demonstration of market maturity, noting that 80,000 BTC was absorbed in days with barely a market blip.
Crypto infrastructure has also evolved: algorithmic liquidity providers, institutional desks, and OTC channels handled the load without triggering cascading funding rate hikes or forced liquidations.
Ongoing Risks
Event-Driven Stress: During macro shocks or sharp sell-offs, liquidity may thin, and the same level of absorption might not persist.
OTC vs Exchange: This large sale was managed mostly off-exchange. A similar-sized on-exchange dump could still trigger stop-run cascades.
Retail Complacency Risk: The stability seen now can be deceptive, as retail may misinterpret low volatility as a safe leverage zone, only to be caught off-guard.
Projections:
Watching the 23.6% fib retracement level in line with the $116,600 price level. Anticipate the resistance level of $120,000 to be retested.
If price breaks above $120,000, we could see a significant move toward $130,000
The $9B BTC sale went through without materially impacting price is considered a milestone in crypto market evolution. It reflects institutional-grade liquidity and sentiment maturity.

Rectangle Consolidation + Bull Trend = BTC Setup for ATHYesterday, Bitcoin dipped and recovered again, following last week's sharp spike down, triggered by the $9B Galaxy Digital sale on behalf of a Satoshi-era investor.
________________________________________
🧠 Why is this important?
Despite being one of the largest BTC sales in history, the move only caused a temporary spike down.
That’s a clear sign of market strength and strong interest on dips.
________________________________________
📉📈 Current Technical Context:
• If we ignore the spike, price is consolidating in a tight rectangle
• That’s typically a continuation pattern
• The broader trend remains strongly bullish
📌 Put all of that together, and we have at least 3 reasons to expect upside continuation
________________________________________
🎯 Key Levels:
• Break + daily close above $120K → likely leads to a new ATH and a potential test of $130K
• Invalidation only comes with a break below $114K
________________________________________
Conclusion:
BTC just absorbed a massive $9B sell without blinking.
As long as $114K holds, I'm bullish and expecting continuation.
Next leg could (and I hope it will) be explosive. 🚀
Bitcoin sell short Bitcoin has negative divergence on the weekly timeframe and is suffering. The target is $82,000. It is now the channel ceiling. The market is heavily bearish.
Bitcoin Tp:82000
😘😘😘
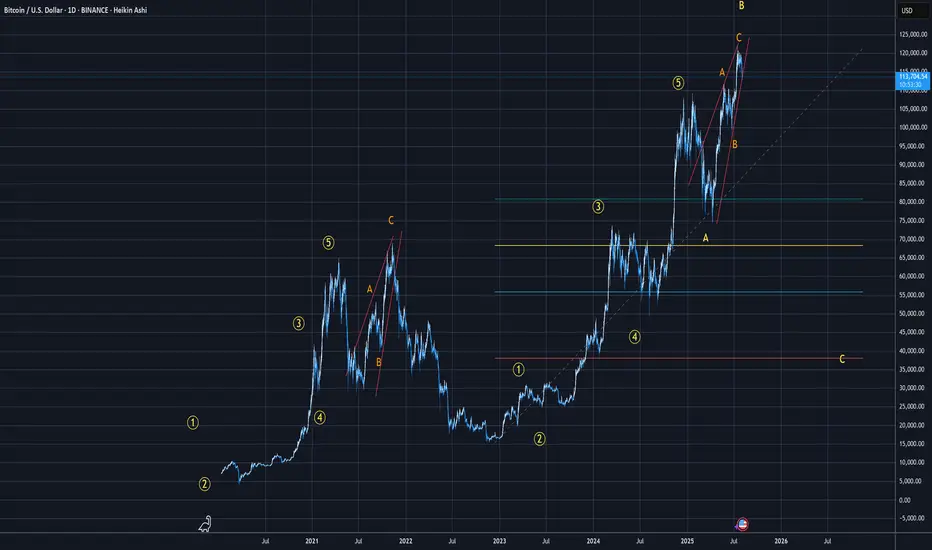
is BTC dead again ?I was really bullish until wave 4 didnt really bounce between the 38 and 50
suddenly very bearish
BTC - 12H Break Likely TodayAs we continue to follow BTC's LTF pattern it is likely to either breakout or breakdown today. FOMC happens in about 4 hour from now which is likely to lead to volatility.
As you can see from the chart, BTC's price has been perfectly aligned within this 12H symmetrical triangle (white dotted lines). This is validated by the many touchpoints of support and resistance (green and red arrows).
Once we see a 12H candle close above or below this pattern it could lead us to our measured move price target (yellow ray).

BITCOIN LONG FROM SUPPORT|
✅BITCOIN has retested a key support level of 112k
And as the coin is already making a bullish rebound
A move up to retest the supply level above at 115k is likely
LONG🚀
✅Like and subscribe to never miss a new idea!✅
Disclosure: I am part of Trade Nation's Influencer program and receive a monthly fee for using their TradingView charts in my analysis.

Strong Bearish move possible from these levels.Adjusted Trendlines
We have slightly adjusted the trendlines, as Bitcoin appears to hesitate in choosing its next move. We still estimate a 70–80% probability of a significant decline from current levels.
There is a small chance that liquidity above the all-time high (around $124K) may still be required, but I remain skeptical of that scenario.
The XRP 1.5-1.6usd target remains valid. However, it remains challenging to pinpoint the exact moment when altcoins will begin to outperform Bitcoin, and thats just what happened recently, If we break below 2.75usd with strength then a move towards 1.6usd is almost certain.

Weekly setup for BTCLast week i was waiting for a short confirmation on Bitcoin, a confirmation that has never arrived. But setups are made for this: we wait the right moment to join the market, based on a cold analysis. Considering that the support area looks still strong, i will now wait for a retracement till the key level at $116.550. Around this level i will look for a rejection to enter long, targeting the resistance zone at $119.000

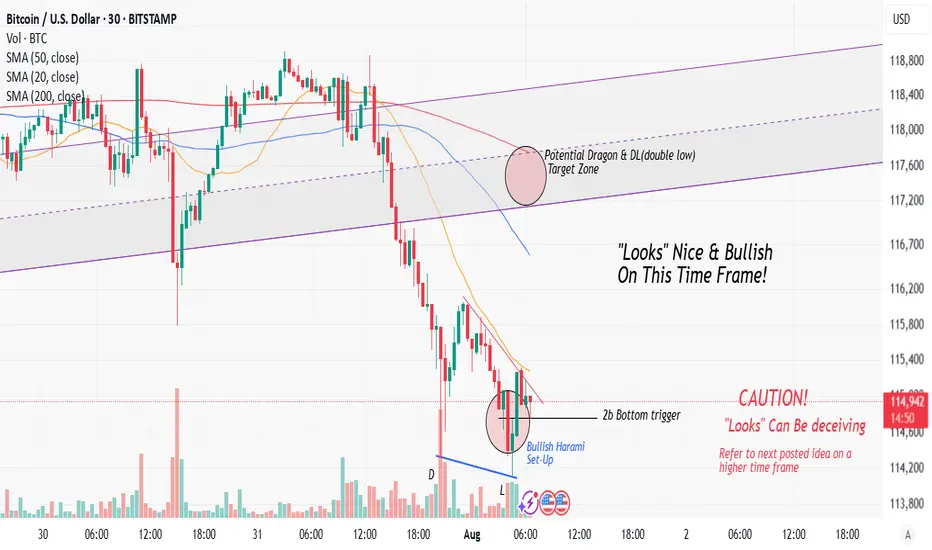
Nice Bitcoin Bullish Set Up On The Hourly I noticed something that may look interesting on the hourly time frame. So here's a little heads up!
BITCOIN Bullish setupBTCUSD bullish setup
Entry - 113090
Stop Loss - 112717
Target - 114260
Risk Reward - 1:3.14

#BTCUSD Short term buying LevelsBINANCE:BTCUSD Short term looks bullish and heading towards 132000$, Any panic is a buy at equal legs
