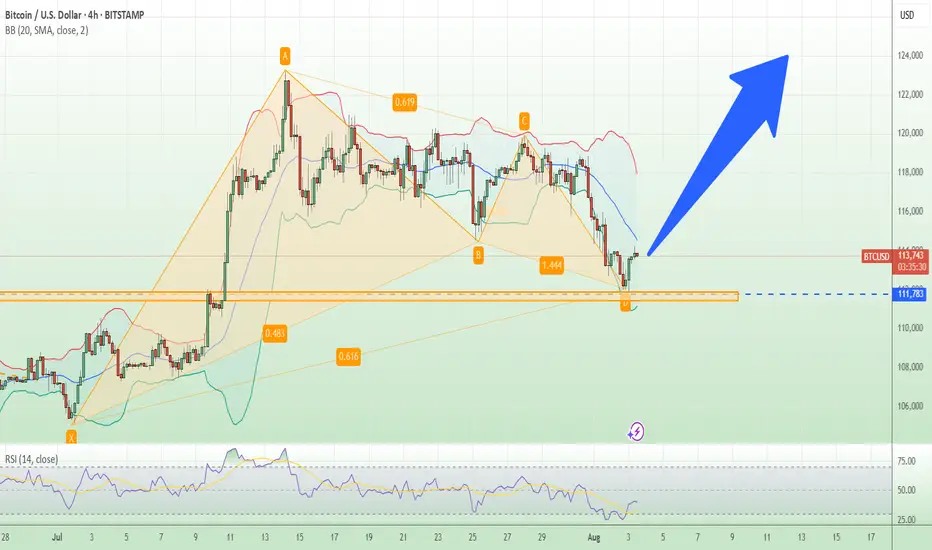
Let's buy BTCUSD on correction!I found interesting opportunity in BTCUSD right now.
It has been moving in consolidation channel after recorded its all time high.
Based on Elliot Wave count, the price right now is making it's wave 4.
The next possible target is 120-125k.
CHEEEERRRSSS..!!!
BTCUSD.P trade ideas
BTCUSD broke below 115,000.00 on week labor dataBTCUSD broke below 115,000.00 on week labor data
On August 1, after worse-than-expected NFP report data came out, bitcoin dropped below important level of 115,000.00 and SMA200 on 4-h chart. Technically, this means the start of a mid-term bearish market in the asset. Bitcoin often follows the same path as high-risk assets, such as tech stocks, particularly during times of economic uncertainty. The July 2025 U.S. jobs report, which showed only 73,000 new jobs added, below the expected 100,000, and a downward revision of June's figure from 147,000 to 14,000, fueled fears of a recession. This caused a broader market sell-off. In just 12 hours, $110 billion was withdrawn from spot crypto markets, with $630 million in liquidations, primarily affecting long positions.
Currently the price is testing the 115,000.00 level. The next decline towards 110,000.00 support level is expected.

Bitcoin - The cycle is just starting!⚔️Bitcoin ( CRYPTO:BTCUSD ) just created new highs:
🔎Analysis summary:
Bitcoin is currently - especially with the new all time high breakout - just perfectly following previous cycle behavior. Since there is no real resistance above current price, apart from psychological levels, I do expect a substantial rally back to the upper channel resistance trendline.
📝Levels to watch:
$300.000
🙏🏻#LONGTERMVISION
Philip - Swing Trader

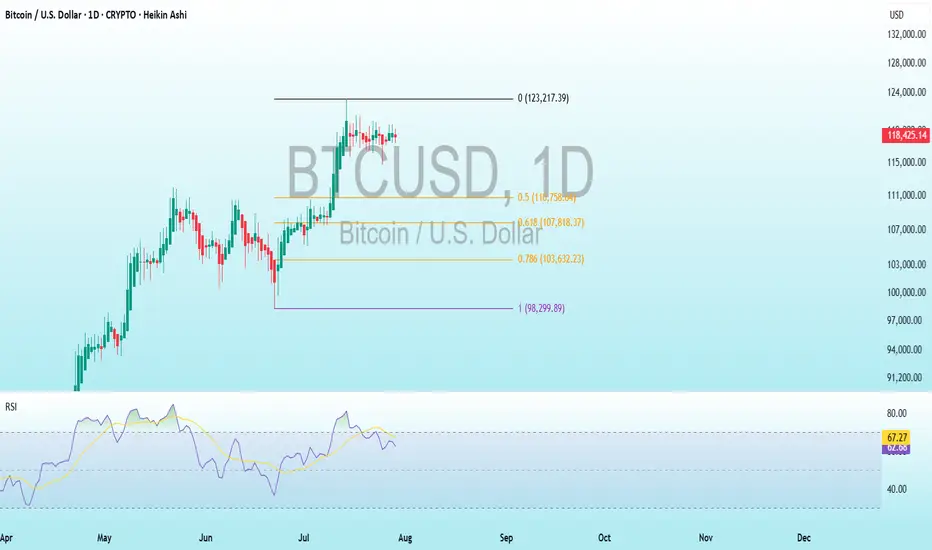
BTC Bearish DivergenceBINANCE:BTCUSDT
Rezistance Levels: 123,217.39.
Support: 98,299.89
Trade Setup:
Target 1: 110,758.64 (0.50 Fibonnaci Golden Zone).
Target 2: 107,818.37 (0.618 Fibonnaci Golden Zone).
Target 3: 103,632.23 (0.786 Fibonnaci Golden Zone).
Target 3: 98,299.89 (1 Fibonnaci).
Stop Loss: 123,217.39 (above recent high, ~25% above current price).
RSI Analysis: The RSI shows a bullish divergence (price making lower lows while RSI makes higher lows), suggesting potential upward momentum. Current RSI is around 62.80, nearing overbought territory (>70), so caution is advised.
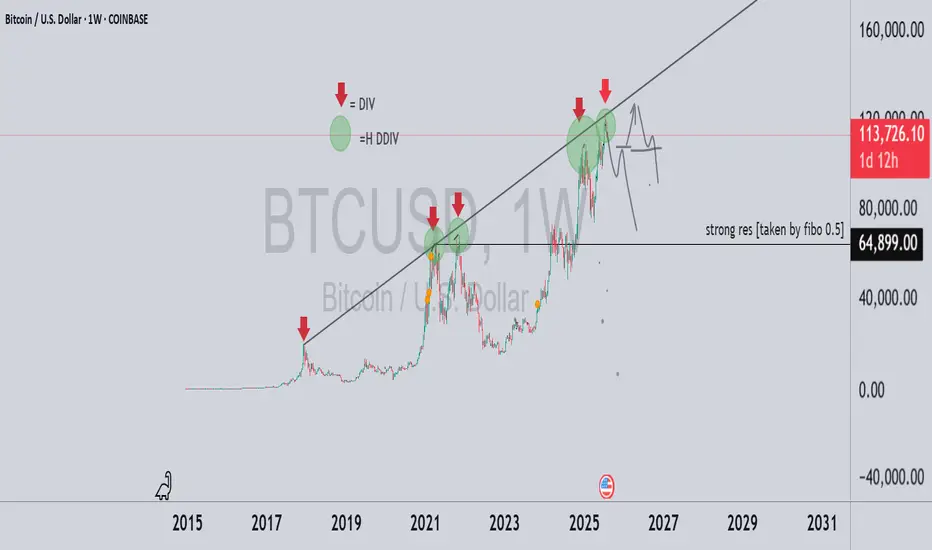
to 65K soon BTC/USD – Historical Cycle Analysis & Mid-Term Outlook (1W)
Exchange: Coinbase
Timeframe: Weekly (1W)
Key Observations:
Long-Term Trendline Resistance
The black ascending trendline has historically acted as a major resistance zone since 2017.
Every touch of this line in the past has been followed by a significant correction.
Bearish Divergences (DIV / HDIV)
Red arrows indicate historical bearish divergences on RSI/MACD.
Each divergence marked a local or macro top before a sharp retracement.
Major Historical Resistance – $64,899
Derived from 0.5 Fibonacci retracement of the primary cycle.
Served as a key ceiling during previous cycles before new all-time highs.
Bitcoin Cycle Behavior
BTC historically forms parabolic tops followed by deep corrections.
The current cycle (2024–2025) mirrors 2017 and 2021 structures, suggesting we may be approaching a macro inflection point.
Mid-Term Scenario
Price near the trendline (~$120K) implies high risk of volatility and correction.
Primary support zone: ~$65K (historical + Fibonacci confluence).
Likely scenario: range-bound movement between $65K–$120K before any sustainable breakout or new parabolic leg.
BTCUSD: Local Bullish Bias! Long!
My dear friends,
Today we will analyse BTCUSD together☺️
The market is at an inflection zone and price has now reached an area around 114,020 where previous reversals or breakouts have occurred.And a price reaction that we are seeing on multiple timeframes here could signal the next move up so we can enter on confirmation, and target the next key level of 114,821.Stop-loss is recommended beyond the inflection zone.
❤️Sending you lots of Love and Hugs❤️

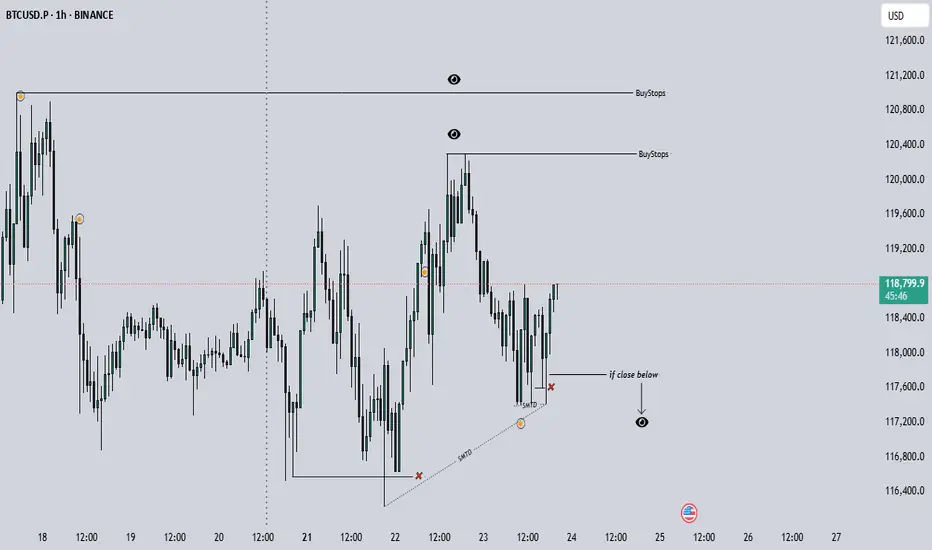
Bitcoin longs | Unemployment claims + PMI news release.Im looking for a distribution to 120289.8 & 120983.3 tomorrow whit 8.30 - 9.45 news release.
Invalidation point for the idea is a close below 117733.2
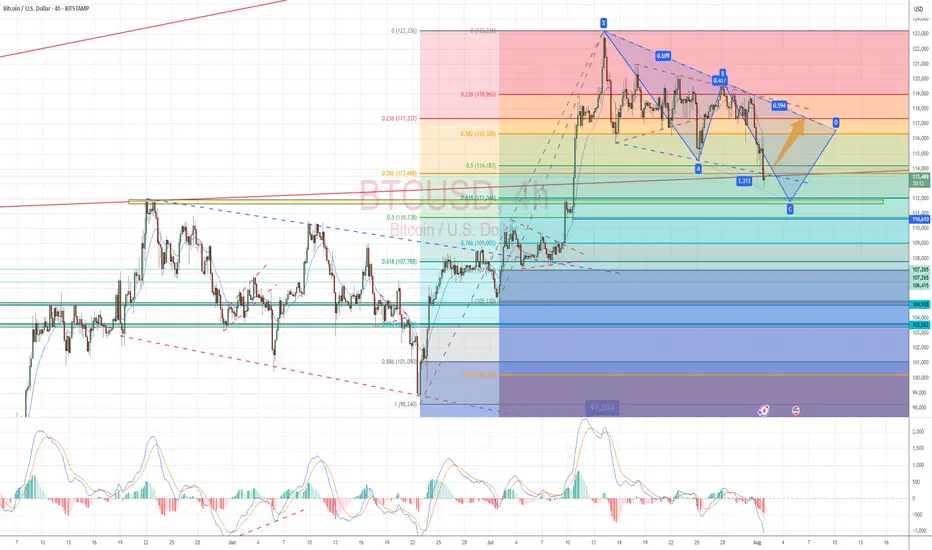
BTCUSD - Right to the point!In the last post (see the Linked Chart), I showed why BTCUSD would fall, and I also pointed out where the first price level for a possible pause might be.
On Friday, that level was reached, and the market seems to be turning *on the dot*. Will we now see higher prices again, or even a new all-time high? Let’s take a closer look:
The “confluence” point is marked by the white fork and the yellow modified Schiff fork. This point lies exactly on the 1/4 line. And this line often indicates temporary levels where at least a pause in the movement can be expected.
When we look at what Bitcoin did at this price level in mid-June, it seems likely that it will rise again. The overall pattern, from the centerline to the 1/4 line, looks extremely similar (see the A-B-C Wave Pattern)!
And yet, I’m not entirely convinced by the picture. Because this was the second time we reached the centerline.
For the brave, this wouldn’t be a bad entry point—or an opportunity to increase the position after this pullback. A possible stop for traders could be placed just below the current low, with targets at the centerline of course.
But why not just lean back, enjoy the profits, and switch into observation mode for now…
I will also make a video that explains the details and connections more clearly.
Happy Monday and stay patient to fight the FOMO! §8-)

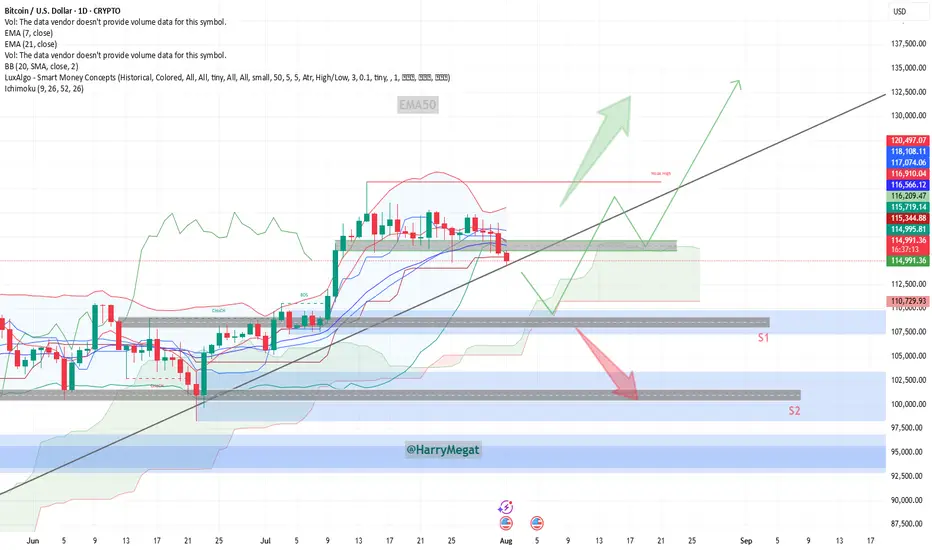
Analysis BTC/USD Daily ChartAnalysis BTC/USD Daily Chart
**Chart Overview (Daily Timeframe)**
**Current Price**: \~\$114,937
**EMA 7**: \$116,896 (short-term)
**EMA 21**: \$116,561 (medium-term)
**Trendline**: Price is testing the long-term ascending trendline
**Key Zones:**
* **Support 1 (S1)**: \~\$110,000
* **Support 2 (S2)**: \~\$102,000
* **Immediate Resistance Zone**: \~\$116,000–\$120,000
**Bullish Scenario**
**Conditions**:
* Price **holds above the ascending trendline**
* A strong **bounce from current level (\~\$115K)** or a reclaim above **\$116K**
**Buy Setup**:
* **Entry**: \$115,000–\$116,000 (if bounce confirmed)
* **Stop-loss**: Below \$114,000 or the ascending trendline
* **Targets**:
* TP1: \$120,000
* TP2: \$125,000
* TP3: \$132,000+
**Confirmation**:
* Bullish candle formation near the trendline
* Reclaim of EMAs (especially EMA 7)
**Bearish Scenario**
**Conditions**:
* Price **breaks below the ascending trendline** and **closes below \$114K**
* Rejection from \$116K zone with a strong red candle
**Sell Setup**:
* **Entry**: Below \$114,000 (on confirmed breakdown)
* **Stop-loss**: Above \$116,000
* **Targets**:
* TP1: \$110,000 (S1)
* TP2: \$105,000
* TP3: \$102,000 (S2)
**Invalidation**:
* Quick recovery above \$114.5K and trendline reclaim = possible fakeout
**Bias**
**Neutral to Bullish**, as price is **at trendline support**.
Watch closely for **price reaction at current levels** for the next directional trade.
BITCOIN BULLYING Bitcoin hit take profit previously and now I will be looking at another buy within this trend and price action combined with patterns
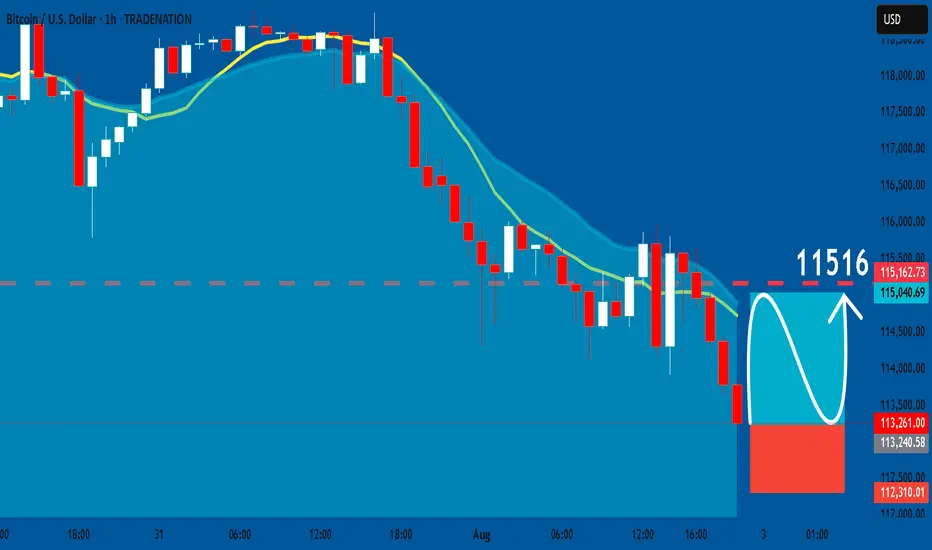
BTCUSD: Long Signal with Entry/SL/TP
BTCUSD
- Classic bullish formation
- Our team expects growth
SUGGESTED TRADE:
Swing Trade
Buy BTCUSD
Entry Level - 11326
Sl - 11231
Tp - 11516
Our Risk - 1%
Start protection of your profits from lower levels
Disclosure: I am part of Trade Nation's Influencer program and receive a monthly fee for using their TradingView charts in my analysis.
❤️ Please, support our work with like & comment! ❤️
Bitcoin at $110,000?After reaching its last ATH, Bitcoin practically went into a coma. Now, with the strengthening of the dollar, it's undergoing a correction — and if that correction deepens, there's a possibility it could drop to \$110,000. We'll have to see whether it finds support around the \$112,000 level or not.
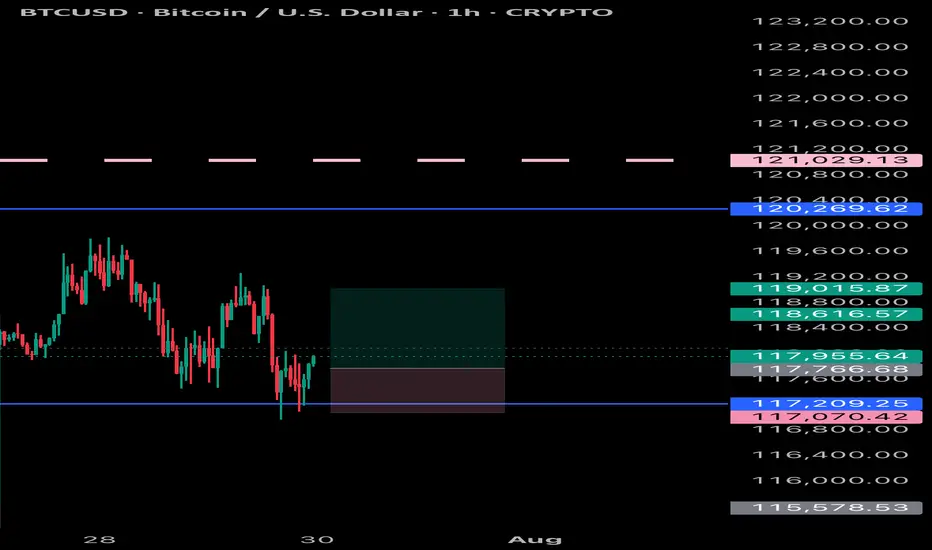
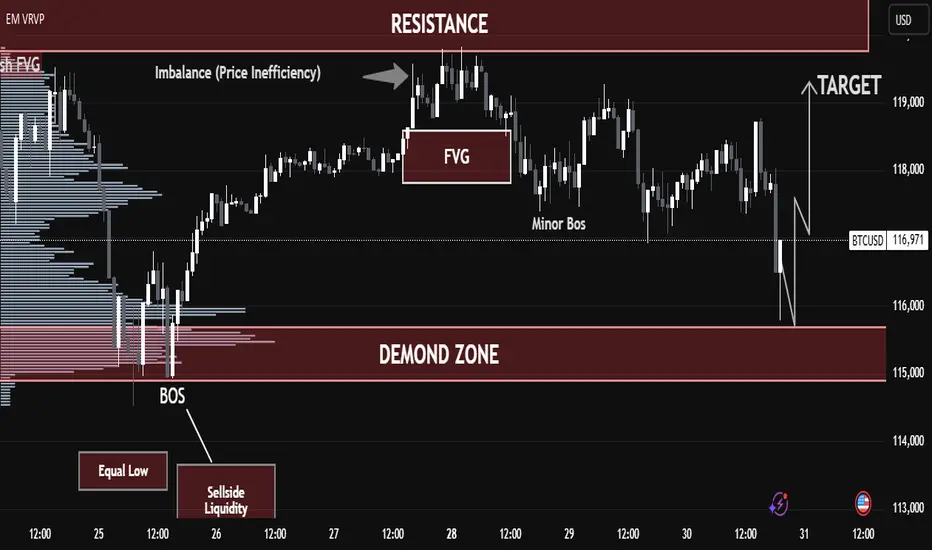
BTC/USD – Strong Buy Opportunity from Demand Zone BTC/USD – Strong Buy Opportunity from Demand Zone
🟢 Technical Outlook:
Bitcoin (BTC/USD) has tapped into a well-defined Demand Zone near 115,000–116,000, showing early signs of a potential bullish reversal. This level aligns with key liquidity zones, smart money concepts, and price inefficiencies — offering high-probability long setups.
🧠 Key Technical Highlights:
🔻 Equal Lows + Sell-Side Liquidity:
Market swept equal lows, grabbing liquidity below support — a common institutional setup before a bullish push.
✅ Break of Structure (BOS):
A prior BOS indicates a shift from bearish to bullish structure after liquidity collection.
📉 Fair Value Gap (FVG):
Price created and respected an FVG after the BOS, validating bullish intent.
📊 Imbalance Filled:
A prior price inefficiency has now been filled, completing a clean move from imbalance back into structure.
📈 Target Zone: 119,000 USD
Marked as the logical next stop — sitting near prior resistance and a liquidity zone.
🎓 Educational Insight:
This is a textbook Smart Money Concept scenario:
Sell-side liquidity sweep
Demand zone tap
Imbalance rebalancing
Shift in market structure
It shows how institutions often engineer liquidity grabs before a large directional move.
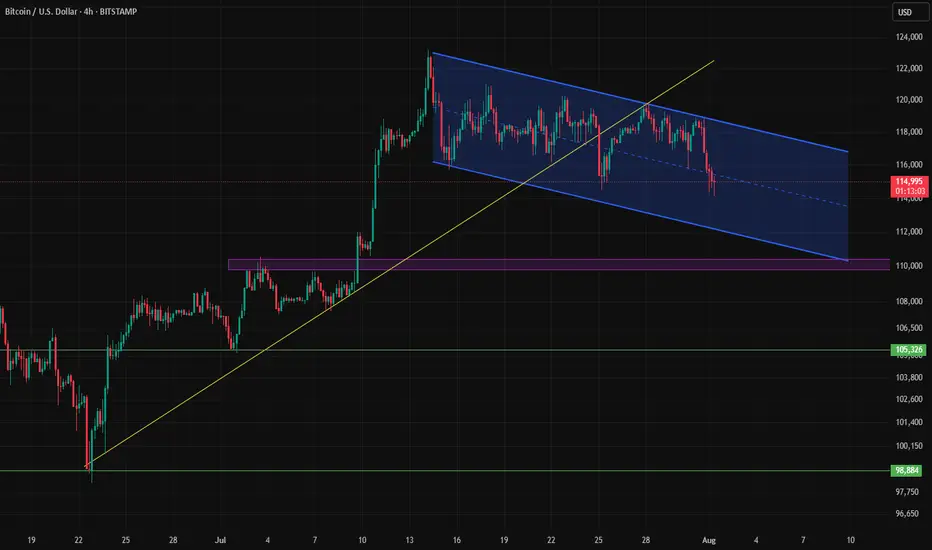
BTCUSD CORRECTIONBTCUSD just met strong supply at 120 K, showing clear distribution from large sellers, yet price still respects the primary rising trendline. Below, absorption blocks cluster at 110 K–105 K where bids keep stepping in.
Targets:
• Upside — 125 K if the trendline holds and 120 K is reclaimed.
• Downside — 110 K on a break of trend support.
#BTCUSD #globaltrade #investment #investing #stockmarket #wealth #realestate #markets #economy #finance #money #forex #trading #price #business #currency #blockchain #crypto #cryptocurrency #airdrop #btc #ethereum #ico #altcoin #cryptonews #Bitcoin #ipo

BTCUSD BUY 109270On the daily chart, BTCUSD is experiencing a pullback from its highs, with short-term bears taking advantage. Currently, attention can be paid to the support level near 109270, which is a potential buy level for a bullish bat pattern and is within the previous demand zone.

Bitcoin Found Support at $112kAfter making a new all-time high at $123,000, Bitcoin fell back down to test the previous high at $112,000 as expected in the previous post. In technical analysis, previous resistance tends to become support and for now we are seeing that $112k level hold as support with price bouncing up off it today and is trading back above $114k. We currently have the 50-day price average(50sma) right at that $112k level adding extra support for price as well.
As for the lower price indicators:
The PPO is showing the green PPO line holding above the 0 level which indicates that long-term momentum remains bullish. For short-term price momentum to turn bullish we would need to see the green PPO line cross back above the purple signal line.
The ADX indicator shows the purple -DI line rolling over after rising, and the green +DI line is beginning to rise indicating that the bear strength is weakening, and the bull strength is increasing. For long-term bull strength, we would need to see the green +DI line cross back above the purple -DI line, and for the background histogram bars to rise.
The TDI indicator shows the green RDI line holding above the 40 level which keeps the long-term bull trend intact. Generally, you want to see the RSI line trending between 40-80 as a sign of trend strength during a bull market. The green RSI line is also crossing back above the lower Bollinger Band after briefly crossing below it during the decline. In general, price will continue to decline when the RSI is below the lower BBand so getting back above that level is nice to see here. Next we would want to see the green RSI line move back above it's purple signal line, and back into the upper half of the Bollinger Bands.
I bought the dip into the $112k-$113k level as I expect this level to hold as support going forward. Next up, we're likely going to see a re-test of resistance at the new all-time high of $123k. From there, I'm still expecting a test of the 1.618 fibonacci extension at $135k.

Bitcoin Dominance & The Fall of AltcoinsBitcoin has sold off sharply in recent session.
Allowing alt coins to capture small percentages of bitcoins liquidity which resulted in epic bullish moves.
Now that Bitcoin is retesting a major moving average (50 MA) we might see BTC recapture some of that crypto dominance.
Other alt coins are well off of their 50 day moving average making them a riskier buy.
When BTC dominance starts to take leadership we often see alt coins and the total market cap sell off.
Bitcoin dominance is hitting a multi year trendline and looks poised to capture some of the alt liquidity.
We still think BTC can sell off and go lower, but on a relative basis it should hold up better than other alt coins & Ethereum.
There are some key nuances that are building and shaping up for a very similar topping formation that occurred in 2021.

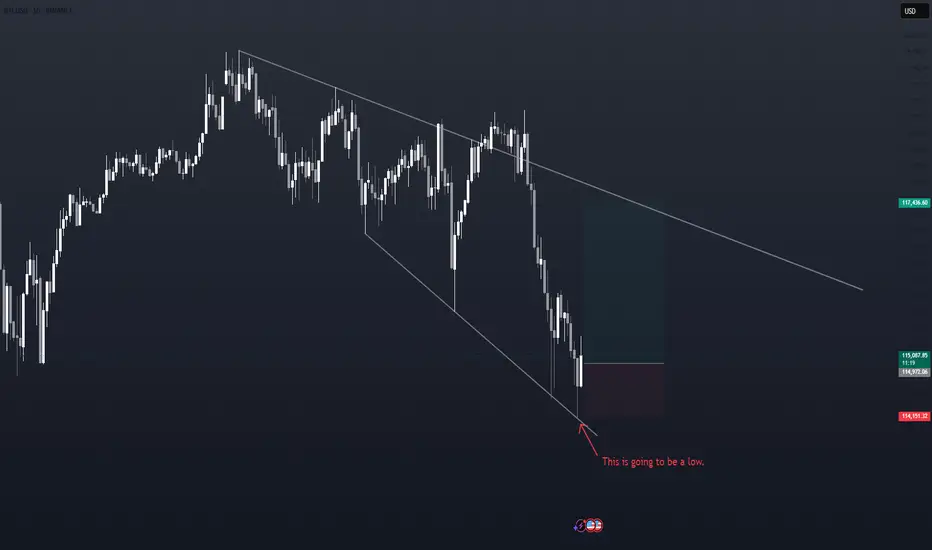
Bitcoin DumpsBitcoin is putting in a textbook retest here. Price bounced cleanly off support at $112,000 – a key horizontal level that also lines up perfectly with the rising 50-day moving average. That’s classic technical behavior. The bounce looks good on the surface, but it came on low weekend volume, which always warrants a bit of caution. There’s not much conviction behind the move yet.
Looking under the hood, the RSI still hasn’t reached oversold levels, even after a pretty sharp drop from the highs. That’s notable, especially since we saw a clear bearish divergence at the top – price made a higher high, but RSI made a lower high, signaling momentum was already fading. Until we get a stronger reaction and volume pickup, this might just be a pause before another leg down.

Very important Economic Calendar 28.07–01.08: FOMC, BTC, tariffsThis Week (July 28 – August 1) — the final week of the month is packed with key events.
Save this post and forward it to 3 friends 😉
📋 High volatility ahead — as the Fed’s key "threelemma" (inflation, labor market, tariffs) comes into focus.
Several important macro releases are scheduled — each one matters on its own, but combined, they can move markets sharply.
🗓 Monday (July 28)
▪️ 12:30 UTC – QRA (Part 1): upcoming US Treasury borrowing needs
▪️ 16:00 UTC – 2Y & 5Y bond auctions – key indicator of market expectations ahead of FOMC
🔗 Strong demand = stronger rate cut expectations
🗓 Tuesday (July 29)
▪️ 12:30 UTC – US GDP (Q2 estimate)
▪️ 16:00 UTC – 7Y bond auction
🗓 Wednesday (July 30)
▪️ 12:15 UTC – ADP employment report – early signal ahead of NFP
▪️ 12:30 UTC – QRA (Part 2): breakdown of Treasury borrowing
▪️ 18:00 UTC – FOMC rate decision (no change expected – 4.5%) + Powell’s press conference
🗓 Thursday (July 31)
▪️ 12:30 UTC – PCE inflation (June) – Fed’s favorite inflation gauge
🗓 Friday (August 1)
▪️ 12:30 UTC – Nonfarm Payrolls (employment)
▪️ 13:00 UTC – ISM Manufacturing Index (July)
▪️ 13:00 UTC – Univ. of Michigan Consumer Sentiment Index
▪️ All day – July auto sales data
🚨 LIBERATION DAY 2.0
Potentially the most impactful event of the week: the Trump administration will begin sending “tariff letters” to ~200 countries.
This marks the end of the temporary tariff relief (April 8 – August 1).
Markets expect a new wave of global trade tension — timing is still uncertain.
💡 Summary:
Every day brings a new potential driver.
Markets are nervous and highly reactive — sharp moves are likely...
CRYPTOCAP:BTC is currently being held above $117K, but Wednesday and Friday bring high risk of "news bombs".

Bitcoin Outlook – Early August🟩 1M Timeframe (Monthly Overview)
The August monthly candle has just begun forming, so it’s too early to draw solid conclusions. While there’s selling pressure visible, it’s not yet a confirmed reversal on the higher timeframe.
🟨 1W Timeframe (Weekly View)
On the weekly chart, structure leans bearish. If momentum continues, a mid-term downside target of $105,000 remains in play.
🟧 1D Timeframe (Daily Perspective)
The daily chart shows some buying interest around $108,500, suggesting a possible short-term rebound.
However, if price fails to hold above this level, it may drop to retest the $105,000 zone.
A break below that would open the door for a move toward $102,000.
⸻
🧭 Key Notes:
1. If the bearish view is to remain valid, price must not break above $120,000.
A higher high would indicate potential trend continuation on the bullish side.
2. Rebounds are possible along the way.
Opening a short position in the current zone is viable, but a tight stop-loss around $114,500 ± $500 is advised.
This level is a lower high on the 4H timeframe — a critical pivot that, if held, confirms bearish continuation.
But if price breaks above it, the downtrend scenario weakens, and traders may wait for a re-entry closer to the $120,000 resistance zone.
⸻
🧠 Summary & Strategy:
• Monthly: too early to call
• Weekly: bearish bias, targeting $105,000
• Daily: watch $108,500 for short-term support
• Downside levels: $105,000 → $102,000
• No new high above $120,000 if bears are to stay in control
• Short entries okay here; SL ~ $114,500 ± $500
• Wait to re-short at $120,000 if invalidated

BTCUSD Possible senarioas long as the price is above this suport BTCUSD is bullish and if price drops below these support then short term bearish may be possible. let us see. currently price is rejecting from fib 0.5 of recent swing

Bitcoin trading planSupport area 112000
Bullish Gartley Pattern
4 hours Reversal signal
can try to buy