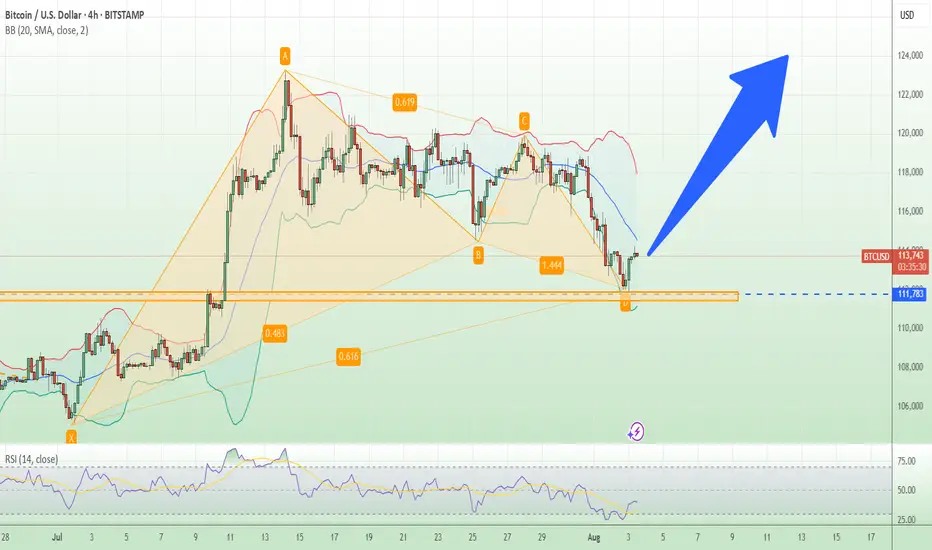
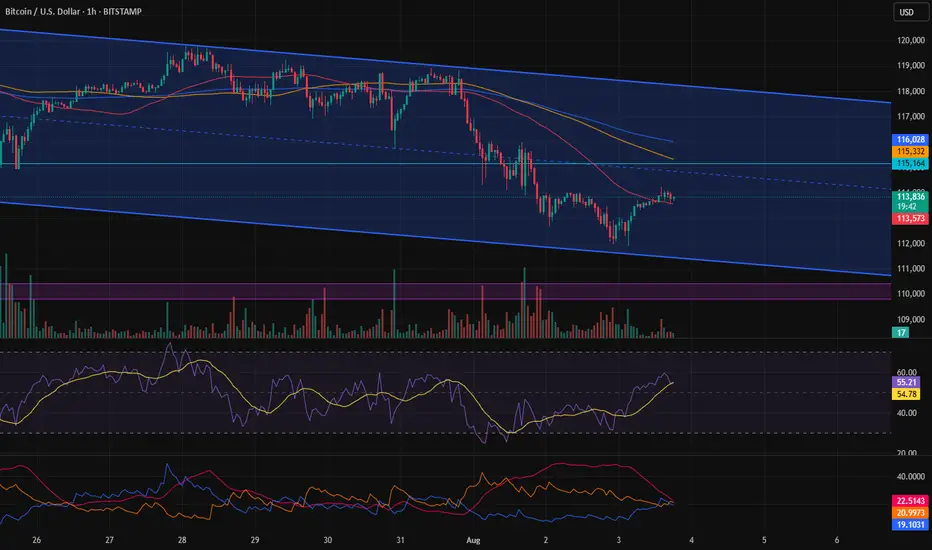
Bitcoin DumpsBitcoin is putting in a textbook retest here. Price bounced cleanly off support at $112,000 – a key horizontal level that also lines up perfectly with the rising 50-day moving average. That’s classic technical behavior. The bounce looks good on the surface, but it came on low weekend volume, which always warrants a bit of caution. There’s not much conviction behind the move yet.
Looking under the hood, the RSI still hasn’t reached oversold levels, even after a pretty sharp drop from the highs. That’s notable, especially since we saw a clear bearish divergence at the top – price made a higher high, but RSI made a lower high, signaling momentum was already fading. Until we get a stronger reaction and volume pickup, this might just be a pause before another leg down.
BTCUSD.P trade ideas

Bitcoin Outlook – Early August🟩 1M Timeframe (Monthly Overview)
The August monthly candle has just begun forming, so it’s too early to draw solid conclusions. While there’s selling pressure visible, it’s not yet a confirmed reversal on the higher timeframe.
🟨 1W Timeframe (Weekly View)
On the weekly chart, structure leans bearish. If momentum continues, a mid-term downside target of $105,000 remains in play.
🟧 1D Timeframe (Daily Perspective)
The daily chart shows some buying interest around $108,500, suggesting a possible short-term rebound.
However, if price fails to hold above this level, it may drop to retest the $105,000 zone.
A break below that would open the door for a move toward $102,000.
⸻
🧭 Key Notes:
1. If the bearish view is to remain valid, price must not break above $120,000.
A higher high would indicate potential trend continuation on the bullish side.
2. Rebounds are possible along the way.
Opening a short position in the current zone is viable, but a tight stop-loss around $114,500 ± $500 is advised.
This level is a lower high on the 4H timeframe — a critical pivot that, if held, confirms bearish continuation.
But if price breaks above it, the downtrend scenario weakens, and traders may wait for a re-entry closer to the $120,000 resistance zone.
⸻
🧠 Summary & Strategy:
• Monthly: too early to call
• Weekly: bearish bias, targeting $105,000
• Daily: watch $108,500 for short-term support
• Downside levels: $105,000 → $102,000
• No new high above $120,000 if bears are to stay in control
• Short entries okay here; SL ~ $114,500 ± $500
• Wait to re-short at $120,000 if invalidated

BTCUSD Possible senarioas long as the price is above this suport BTCUSD is bullish and if price drops below these support then short term bearish may be possible. let us see. currently price is rejecting from fib 0.5 of recent swing

Bitcoin trading planSupport area 112000
Bullish Gartley Pattern
4 hours Reversal signal
can try to buy
Watching for intraday BTC bounce firstMorning folks,
So, neither NFP data nor technical picture helped BTC to stay above 117. While US Treasury is started drain liquidity and borrow (they need 1 Trln this month), sending ~ 150 Bln to its TGA account with the Fed - BTC got hurt.
Now price stands at vital area - previous tops. If BTC will drop under 110K, collapse could start. Let's hope that this will not happen...
Meantime, we're at 112-113K support. We already talked about it before. Here we have reversal bar and bullish engulfing pattern, so maybe we could get a bit higher pullback on intraday chart. 113.8 and 113.1K support areas on 1H TF might be considered for long entry. Invalidation point for this plan is the low of engulfing pattern.
Buy BTCUSD Focus on the $117,500–119,000 levels: a breakout upwards could mean the beginning of growth, a breakout downwards — a strong correction.
Follow the actions of institutional players, flows into ETFs, and political and regulatory news.
Manage risk: BTC remains a volatile asset, the possibility of large peaks and falls remains.
BTC highs in, new lows coming soon?~$122.5k was the top of the range. Now we'll need to go test the lows before we can continue higher.
Alts are clearly not confirming a trend change .
Many still bearish on HTFs (including ETH), I think the reason is because Bitcoin goes lower before we see a continued run and that will drag down alts with it. I think people holding alts here with hopes for new highs (in the near future) are about to have their hopes crushed, that also goes for people long crypto miners.
I don't think the real run starts until end of 2025 or 2026.
Time will tell.
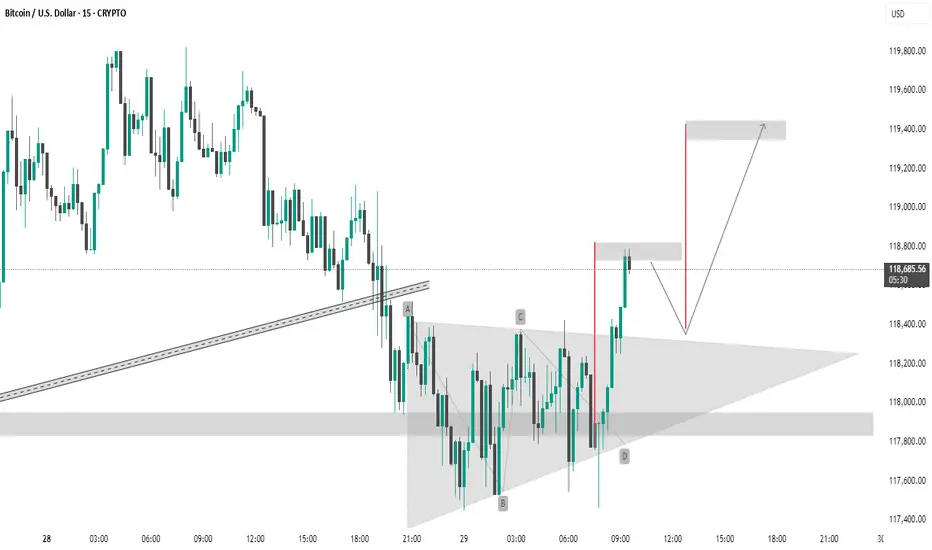
BTC #This Bitcoin (BTC/USD) 15-minute chartThis Bitcoin (BTC/USD) 15-minute chart shows a symmetrical triangle breakout. The pattern labeled A-B-C-D indicates consolidation within the triangle, followed by a bullish breakout. The price has broken above the upper trendline and is approaching the resistance zone around 118,800–119,400 USD. The chart suggests two scenarios:
Immediate breakout to the 119,400 resistance.
Short-term pullback to retest the breakout zone (~118,600), followed by a continuation to 119,400.
The setup implies a bullish bias with a potential upside target around 119,400 USD.
thanking you
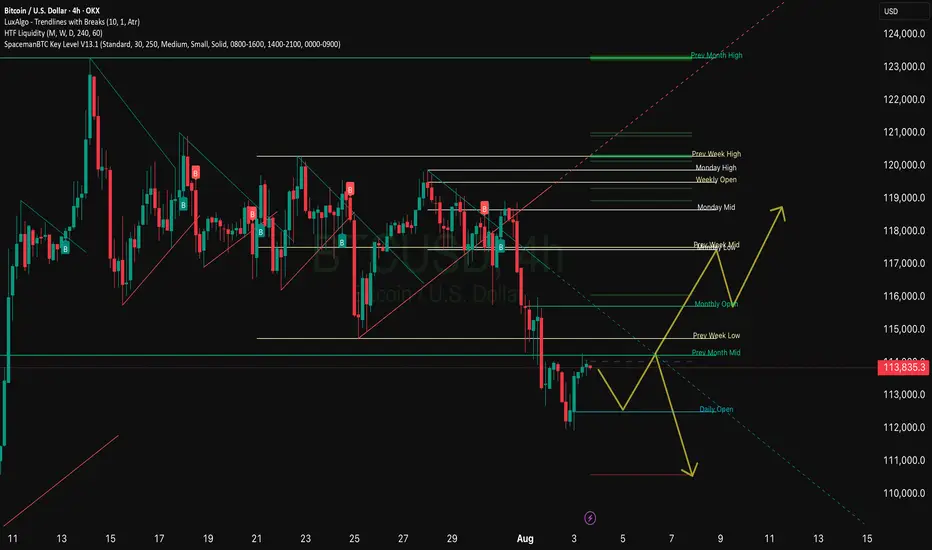
BTCUSD The Week Ahead Key Support and Resistance Levels
Resistance Level 1: 119,000
Resistance Level 2: 121,030
Resistance Level 3: 122,862
Support Level 1: 111,683
Support Level 2: 110,450
Support Level 3: 108,720
This communication is for informational purposes only and should not be viewed as any form of recommendation as to a particular course of action or as investment advice. It is not intended as an offer or solicitation for the purchase or sale of any financial instrument or as an official confirmation of any transaction. Opinions, estimates and assumptions expressed herein are made as of the date of this communication and are subject to change without notice. This communication has been prepared based upon information, including market prices, data and other information, believed to be reliable; however, Trade Nation does not warrant its completeness or accuracy. All market prices and market data contained in or attached to this communication are indicative and subject to change without notice.

BTCUSD IdeaWe are waiting for our asset to reach our action zone, and based on the reaction, we’ll decide on our next moves.ALWAYS WAIT FOR A CONFIRMATION TO SEE IF THE PRICE VALIDATES THE ZONE.and you what is your vision of the EURUSD its interests me! i wait you in the commentary
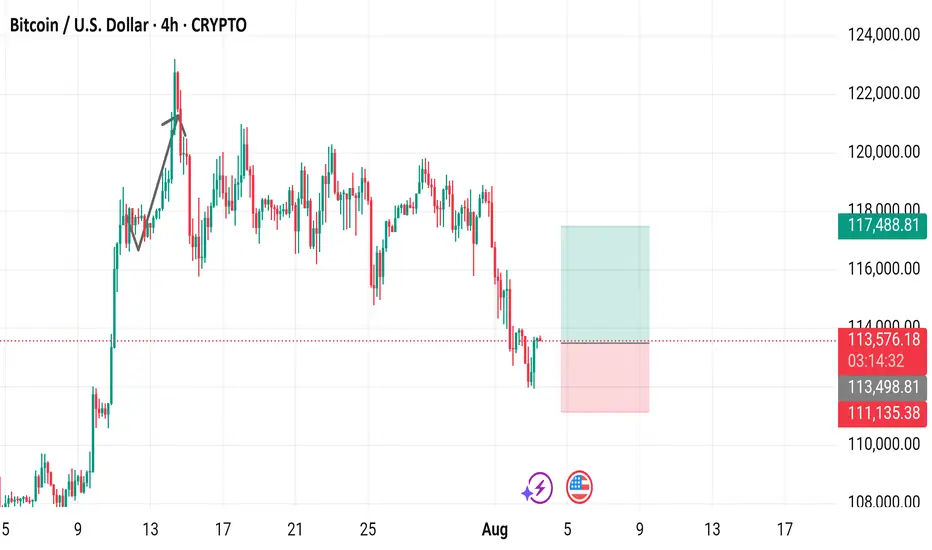
Bitcoin / U.S. Dollar 4-Hour Chart (BTCUSD)4-hour chart displays the price movement of Bitcoin (BTC) against the U.S. Dollar (USD) from late July to August 3, 2025. The current price is $113,570.31, with a 24-hour change of +$1,064.77 (+0.95%). The chart shows a recent upward trend followed by a sharp decline, with key levels marked at $113,570.31 (buy/sell price) and $111,135.38 (support level). The trading volume and price range are highlighted, with a notable drop below the $113,570.31 level as of 03:16:00 on the chart.
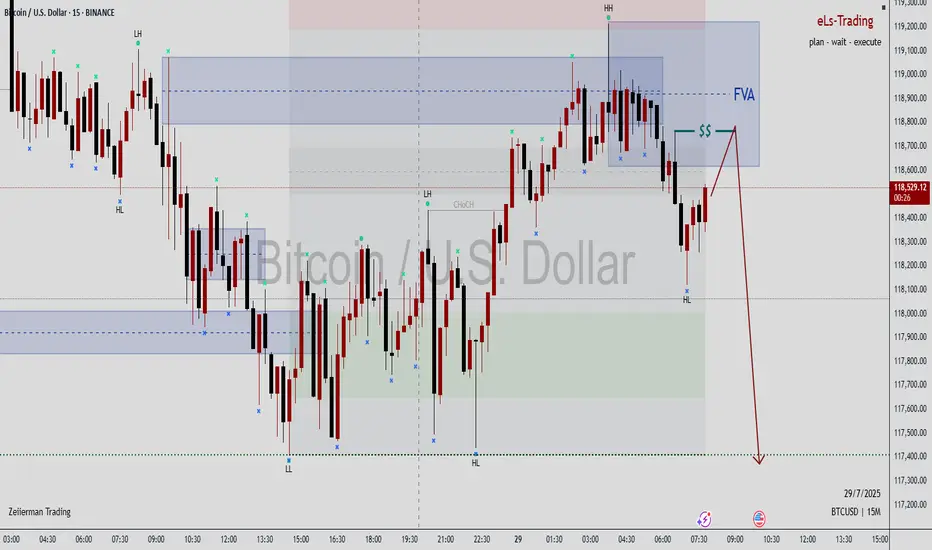
The price re-entered the supply and showed signs of rejectionPrice is reacting from a supply zone marked in grey, suggesting potential short (sell) opportunity.
A clear Change of Character (ChoCH) is visible, indicating a possible shift from bullish to bearish structure.

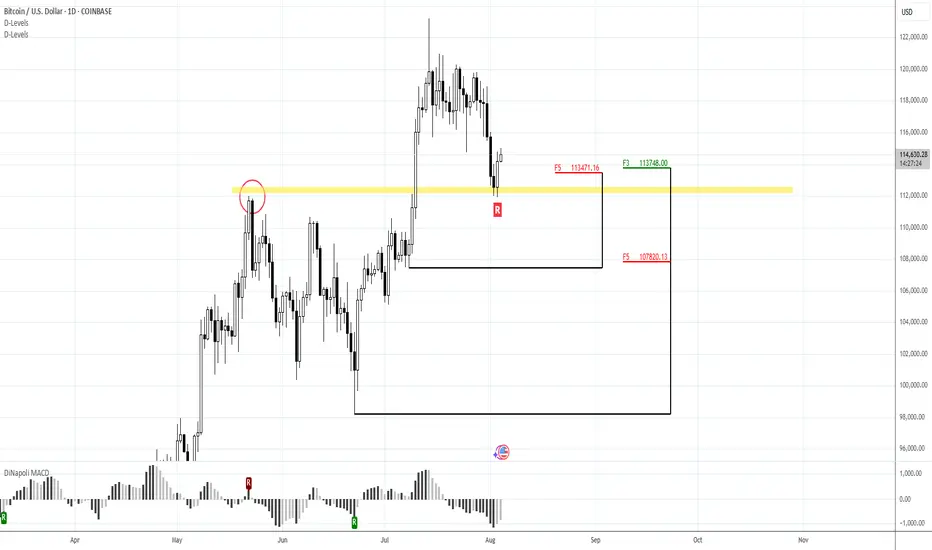
BTCUSD - Follow Up AnalysisTaking a look at the daily chart, price action did come down as previously expected in my last article.
Now we're heading into an area of strong support and I expect to see some sideways action until something significant happens next.
How I'm trading this price action?
I believe price action may continue to bounce around from the current price of 113,600 down to 110,000 for at least the next few days. With that said I'm implementing my range trading strategy. The range trading strategy also known as the Bitcoin Scalper scalps on the 1 and 5min timeframe creating sort of like a grid style approach but it's based on candlestick momentum. Since it trades off momentum, it's able to detect breakouts and know when to switch from the ranging strategy to the breakout strategy.


Btc long term targetsOnce Btc & alt coins bottom, the Btc pump to $130K- $140+ is possible.
I would expect a retrace at that point, which would conveniently
bring Btc down to fill a CME gap at $92K (right within the Fib retracement
ratios I would expect). This is just an idea, but wouldn't it be interesting.
Note: This pattern is a fractal

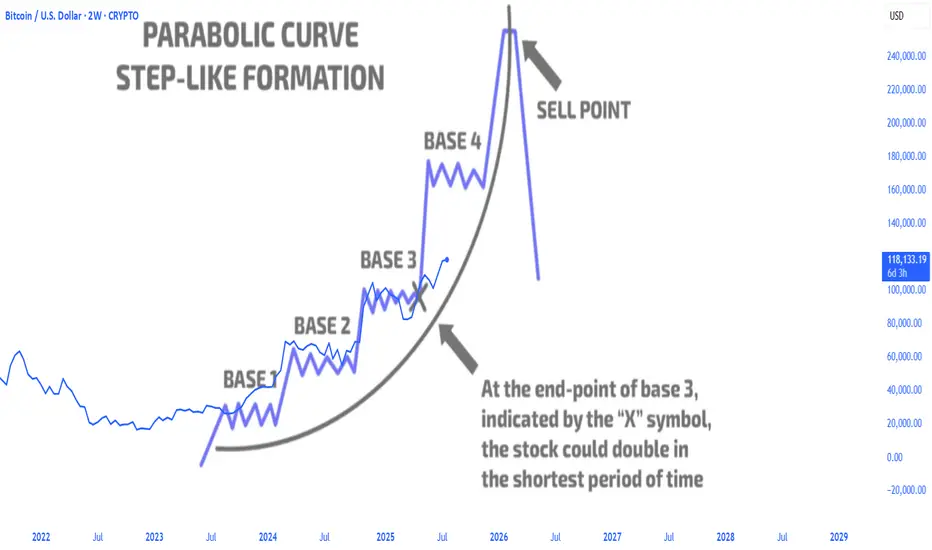
btc parabolic curvebitcoin parabolic curve pattern exits the base3 accumulation area and continues to rise sharply, with more to come
BTC Expansion BTC expansion after a low reading on BBWP. The stochastic RSI gives us an idea of the direction of the move.

End of the correction and continuation of the drop?Given the recent days of decline, it’s become much harder for Bitcoin to move up. It needs significant volume to break through the resistances ahead, and from a technical perspective, I don’t see that volume. I prefer a bearish scenario for now, as it could offer better short opportunities.
BTCUSD ideaWe are waiting for our asset to reach our action zone, and based on the reaction, we’ll decide on our next moves.ALWAYS WAIT FOR A CONFIRMATION TO SEE IF THE PRICE VALIDATES THE ZONE.and you what is your vision of the EURUSD its interests me! i wait you in the commentary

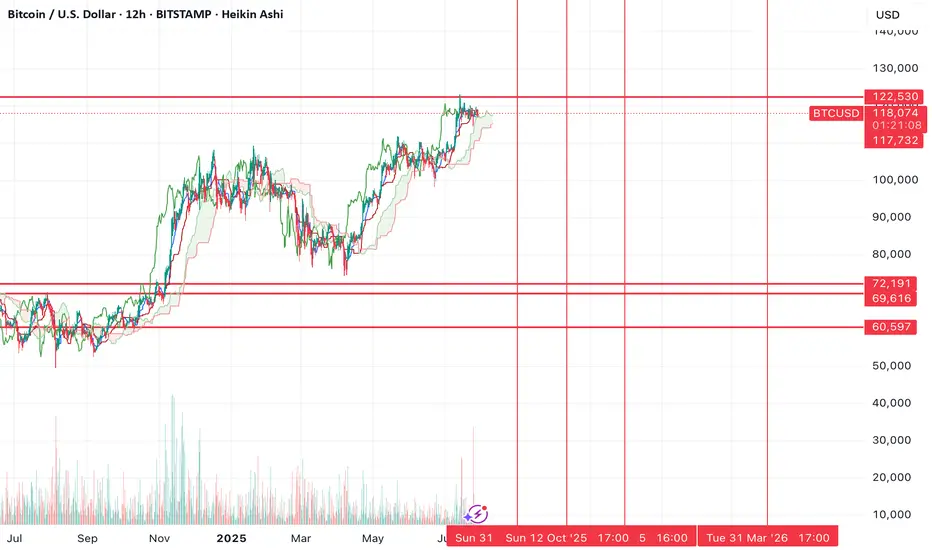
Bitcoin is experiencing a major collapse!BTC/USD – Historical Cycle Analysis & Mid-Term Outlook (1W)
Exchange: Coinbase
Timeframe: Weekly (1W)
Key Observations:
Long-Term Trendline Resistance
The black ascending trendline has historically acted as a major resistance zone since 2017.
Every touch of this line in the past has been followed by a significant correction.
Bearish Divergences (DIV / HDIV)
Red arrows indicate historical bearish divergences on RSI/MACD.
Each divergence marked a local or macro top before a sharp retracement.
Major Historical Resistance – $64,899
Derived from 0.5 Fibonacci retracement of the primary cycle.
Served as a key ceiling during previous cycles before new all-time highs.
Bitcoin Cycle Behavior
BTC historically forms parabolic tops followed by deep corrections.
The current cycle (2024–2025) mirrors 2017 and 2021 structures, suggesting we may be approaching a macro inflection point.
Mid-Term Scenario
Price near the trendline (~$120K) implies high risk of volatility and correction.
Primary support zone: ~$65K (historical + Fibonacci confluence).
Likely scenario: range-bound movement between $65K–$120K before any sustainable breakout or new parabolic leg.

Btcusd techinical analysis.Btcusd techinical analysis next move posibale at h1 time frame not finchinal advice.

Bitcoin Intraday Analysis 31-Jul-25Quick analysis on bitcoin, the main area of interest i will be monitoring are 110,500, 115k, 120K. Keeping in mind that we still have important economic data tomorrow (US Employment Data).
Disclaimer: easyMarkets Account on TradingView allows you to combine easyMarkets industry leading conditions, regulated trading and tight fixed spreads with TradingView's powerful social network for traders, advanced charting and analytics. Access no slippage on limit orders, tight fixed spreads, negative balance protection, no hidden fees or commission, and seamless integration.
Any opinions, news, research, analyses, prices, other information, or links to third-party sites contained on this website are provided on an "as-is" basis, are intended only to be informative, is not an advice nor a recommendation, nor research, or a record of our trading prices, or an offer of, or solicitation for a transaction in any financial instrument and thus should not be treated as such. The information provided does not involve any specific investment objectives, financial situation and needs of any specific person who may receive it. Please be aware, that past performance is not a reliable indicator of future performance and/or results. Past Performance or Forward-looking scenarios based upon the reasonable beliefs of the third-party provider are not a guarantee of future performance. Actual results may differ materially from those anticipated in forward-looking or past performance statements. easyMarkets makes no representation or warranty and assumes no liability as to the accuracy or completeness of the information provided, nor any loss arising from any investment based on a recommendation, forecast or any information supplied by any third-party.

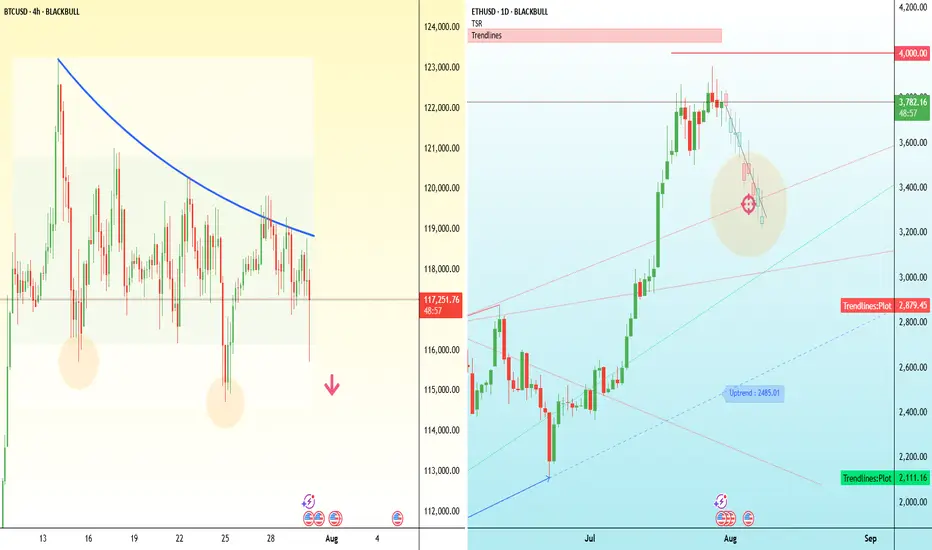
Major test for crypto bulls - BTC and ETH Bitcoin has dipped below $118,000, putting pressure on the bullish structure that’s held for the past two weeks.
The attempted breakout above $121,000 has failed, and price is now breaking down through the middle of the consolidation range, threatening short-term higher lows. On the 4H chart, this move resembles a failed breakout with a potential double-top near $121,000.
If Bitcoin can’t reclaim $116,000 quickly, the next downside levels to watch are $114,000 and $110,000.
Ethereum, meanwhile, has stalled just below $3,800 after a strong rally this month. Price action has flattened out over the past few days, with several failed attempts to push through that level. The key upside trigger remains $4,000.
But if $3,700 gives way, ETH may slide back to the $3,450–$3,300 region, where previous resistance and the rising trendline converge.