Bitcoin buy setupHi everyone.
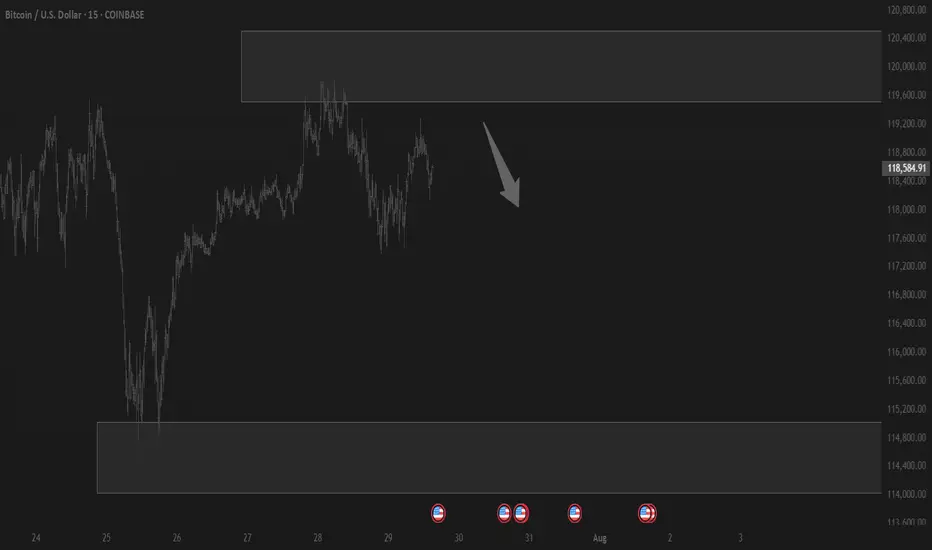
I think this area has a good potential to set an order and take at least 1% profit out of it..
Let's see how it reacts to this level...
Please consider the risk management.
Goodluck
BTCUSD.P trade ideas

BITC Analysis: Targeting 10% Upside with 1:4 Risk-RewardHi, here's my view on BITC. I believe it will move up by around 10% soon. The stop-loss is set at 2.5%, giving a risk-reward ratio of 1:4.
I'm doing this purely for learning purposes. Let’s see how it plays out. 🙂

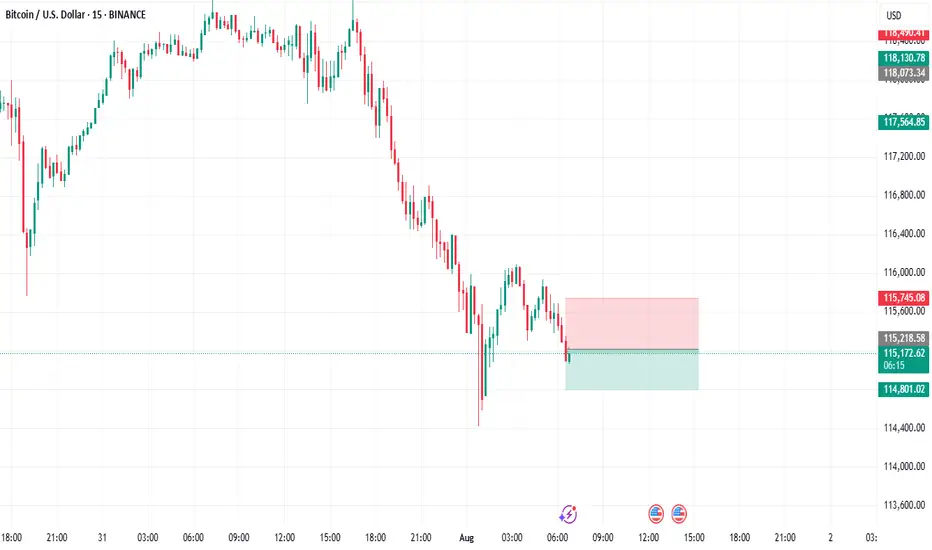
going lon after the close of 07:00 AM the price took the lequidite of a significant Low , and back to the range never close below
this low in 1H TF and 4H TF after we get HL or Swing high I enter buy

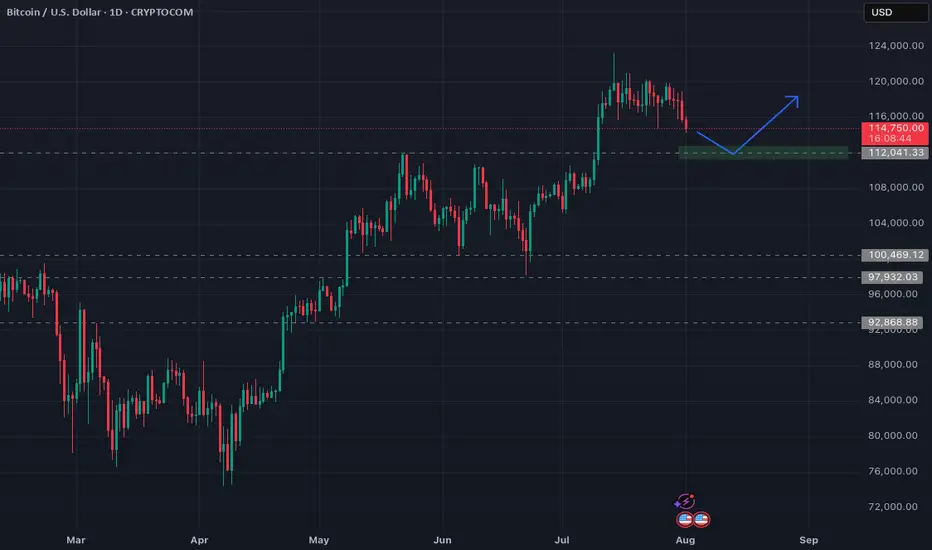
Bitcoin FOMC aftermath & plan aheadHi all,
As you may have noticed, Wednesday's FOMC meeting delivered a less-than-optimistic outlook. The absence of rate cuts, combined with uncertainty about potential cuts in September, triggered a downward move in the markets.
Bitcoin is currently trading 7% below its high from July 14th. I anticipate a relatively shallow downtrend and plan to add to my position around $112,000.
Major Warning: Bitcoin Breaches Key Support with Bearish SignalsBitcoin has officially broken down from its recent consolidation zone, closing below the critical 21 EMA on the daily chart. This move, combined with reversal signals on both the weekly and daily timeframes, suggests that downward pressure is intensifying.
In this video, I’ll walk you through:
• The candlestick patterns signaling reversal
• The significance of the 21 EMA breach
• Confirmed divergences from key indicators
• What this means for short-term and long-term price action
Whether you're holding Bitcoin or trading around it, this is a pivotal moment. The charts are speaking—are you listening?

Btc Short positing Strong sell 40 to 50 pips Btc Short positing Strong sell 40 to 50 pips .
If you wanted to learn about more fell free contrect me .
Bitcoin Structure in Stillness, Power in Silence, Just Control?⊣
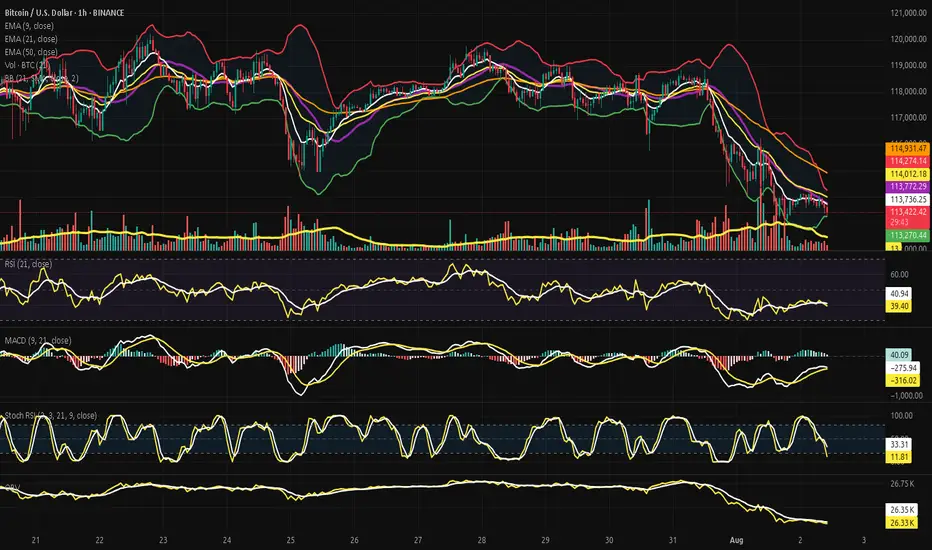
⟁ BTC/USD - BINANCE - (CHART: H1) - (Aug 02, 2025).
◇ Analysis Price: $113,869.77.
⊣
⨀ I. Temporal Axis - Strategic Interval - (1H):
▦ EMA9 - ($113,889.32):
∴ The price is trading just below the EMA9, which acts as immediate reactive resistance;
∴ The short-term slope remains negative, with no breakout signal;
∴ Buyers are unable to push the price above this threshold, indicating technical weakness.
✴️ Conclusion: Momentum remains capped; the EMA9 has not been reclaimed.
⊢
▦ EMA21 - ($113,896.52):
∴ The EMA21 stands as a tactical compression line in this range;
∴ The close proximity of EMA9 and EMA21 forms a technical knot - indecision zone;
∴ Past rejections in this region reinforce it as a powerful barrier.
✴️ Conclusion: Mid-range resistance holds; continuation is blocked unless breached with volume.
⊢
▦ EMA50 - ($114,128.22):
∴ EMA50 defines the current macro resistance on the 1H chart;
∴ The price has yet to test this level directly after the last drop;
∴ For structural recovery, this line must be broken cleanly with follow-through.
✴️ Conclusion: Primary obstacle on the path to reversal - decisive zone.
⊢
▦ BB (21 + EMA9) - Status: Compression:
∴ Bands are tightening around the price, signaling low volatility;
∴ Price action is contained within the central channel;
∴ Indicates upcoming volatility spike - direction still unknown.
✴️ Conclusion: Volatility compression is active; no directional bias confirmed.
⊢
▦ Volume + EMA21 - (3.84 BTC):
∴ Trading volume remains below the EMA21 period average;
∴ No surge of bullish commitment visible;
∴ Momentum lacks conviction without participation.
✴️ Conclusion: Absence of volume undermines the strength of any move.
⊢
▦ RSI (21, 9) - (42.37):
∴ RSI hovers in the lower neutral band - weak momentum;
∴ Slight upward curve suggests a modest rebound;
∴ No divergence or strength signal confirmed.
✴️ Conclusion: Minor relief rally underway - structurally weak.
⊢
▦ MACD (9, 21, 9) - (MACD: -238.89 / Signal: -340.58):
∴ Bullish crossover confirmed, histogram positive;
∴ Both lines remain in bearish territory - (below zero);
∴ Trend momentum is building but not strong enough to reverse.
✴️ Conclusion: Technical rebound in play - not a structural shift.
⊢
▦ Stoch RSI (3, 3, 21, 9) - (%K: 58.90 / %D: 52.70):
∴ Positive crossover established and advancing in neutral-upper zone;
∴ No overbought signal;
∴ Possibility of further upside if confirmed with price action.
✴️ Conclusion: Oscillator supports continuation - contingent on volume.
⊢
▦ OBV (21, BB2) - (26.35K):
∴ OBV remains flat, indicating market indecision;
∴ No divergence with price movement;
∴ No fresh buying pressure detected.
✴️ Conclusion: Neutral volume behavior - flow not favoring bulls.
⊢
🜎 Strategic Insight - Technical Oracle:
∴ The 1H chart of (BTC/USD) reveals a battlefield sealed in compression and anticipation.
The price is locked beneath converging exponential resistances (EMA9, EMA21, EMA50), forming a triple entrenchment zone. None have been broken - each rejection reinforces the stronghold;
∴ The Bollinger Bands constrict like a ritual binding. Volatility is silent - too silent - awaiting the spark. Yet no participant steps forward with force; volume remains suppressed, showing that neither side has declared war;
∴ Momentum oscillators (RSI, Stoch RSI) hint at an upward drift, but these are echoes, not proclamations;
∴ The MACD crossover is not a trumpet - it is a murmur in the underworld, below the zero line, concealed from the living trend;
∴ The OBV confirms it: no one is entering the field with conviction. This is not a battlefield - it is a waiting room;
✴️ And yet, amidst this silence, the Code speaks:
∴ If the zone between ($114.1K and $114.6K) is breached with volume and confirmation, this will mark the first true structural challenge to the prevailing descent. If it fails - the repique folds into another trap, devoured by gravity.
⊢
∫ II. On-Chain Intelligence - (Source: CryptoQuant):
▦ Exchange Inflow Total + EMA9 - (All Exchanges) - (6.2K BTC):
∴ The total Bitcoin flowing into centralized exchanges remains subdued, with no signs of aggressive sell-side pressure;
∴ The EMA9 confirms a flat, low-intensity behavior, distinct from capitulation spikes;
∴ The absence of major inflows during price compression implies a strategic wait state.
✴️ Conclusion: No incoming threat detected - institutions are not preparing to sell.
⊢
▦ Exchange Netflow Total + EMA9 - (All Exchanges) - (-644.5 BTC):
∴ Netflow remains negative, indicating Bitcoin is being withdrawn from exchanges rather than deposited;
∴ A negative netflow during a price downtrend reflects silent accumulation behavior or rotation into cold storage;
∴ The EMA9 shows a consistent drainage pattern, not episodic outflow.
✴️ Conclusion: This confirms defensive posture by large holders - supporting the technical compression.
⊢
▦ Spent Output Profit Ratio - (SOPR) + EMA9 - (1.003):
∴ The SOPR hovers just above 1.0, suggesting coins moved on-chain are being sold at or near cost basis;
∴ No signs of aggressive profit-taking or panic selling - rather, equilibrium behavior;
∴ The 9-period EMA confirms stability in this zone.
✴️ Conclusion: Market psychology is suspended - no one is winning or losing.
⊢
🜎 Strategic Insight - On-Chain Oracle:
∴ All on-chain signals reflect preparation without declaration;
∴ No pressure enters, and no blood leaves;
∴ The field is not empty - it is coiled;
∴ Withdrawals - (Netflow) - suggest protective accumulation;
∴ Low Inflow signals no new panic supply;
∴ SOPR near 1.0 says: (We're all waiting - and none are ahead);
∴ The technical compression in price is not betrayed by the chain;
∴ The silence is consistent;
∴ But silence is not peace - it is a veil.
✴️ Conclusion: If volume does not breach $114.6K - all remains a ghost echo beneath resistance.
If broken - the coil unwinds.
⊢
⧉ III. Contextvs Macro-Geopoliticvs - Interflux Economicvs - (Aug 02, 2025):
⟁ All movements of the market's breath are influenced not only by price, nor volume, but by the tides beyond the chart. Here begins the reading of the outer realm:
▦ EVENTVM I - (Wall Street Silent Accumulation) - (U.Today + Coindesk):
∴ Institutional actors are actively acquiring BTC and ETH through stealth operations - not OTC spikes, but ETF inflows and treasury balance shifts;
∴ Tom Lee (Bitmine/Fundstrat) confirms: Wall Street is not waiting for clarity, it is accumulating in silence;
∴ SEC’s Project Crypto and “in-kind” ETF mechanisms further reduce friction for institutional entry.
✴️ Conclusion: Price stagnation conceals power transfer - retail hesitates while funds consolidate control.
⊢
▦ EVENTVM II - (SEC’s “Project Crypto” Activation):
∴ Regulatory framing under “Project Crypto” unfolds in phases: transparency, compliance infrastructure, and institutional bridges;
∴ Despite its regulatory mask, the program facilitates liquidity channels into crypto markets;
∴ Legalized ETF's now serve as strategic vacuum points for Bitcoin supply.
✴️ Conclusion: What appears as regulation is in fact an alignment mechanism - structure over rebellion.
⊢
▦ EVENTVM III - (July ETF Flows (US) - $12.8B Inflow):
∴ U.S.-based crypto ETF's report record-breaking $12.8 billion inflows in July alone;
∴ Largest flows tracked in BlackRock, Fidelity, and VanEck vehicles - no signs of reversal;
∴ These flows occurred during price weakness, not during breakout - a signature of accumulation.
✴️ Conclusion: The public hesitates while custodians act - the veil of weakness conceals a new floor.
⊢
🜎 Strategic Interpretation - Macro Context:
∴ The charts compress. The flows retract;
∴ But the outer forces converge - Wall Street is no longer watching. It is acquiring;
∴ Through structure, silence, regulation, and engineering of access;
∴ This is no longer the market of peer-to-peer rebellion;
∴ This is the codification of power into institutional hands;
✴️ Conclusion: Price may appear static - but ownership is shifting.
⊢
𓂀 Stoic-Structural Interpretation:
∴ The chart does not lie. The data does not beg. The market does not care. Bitcoin remains trapped beneath resistance - not by force, but by inaction, by lack of intention, by silent contest;
∴ On-chain signals whisper: no one is selling in panic, no one is buying in euphoria;
∴ The macro realm reveals: the hands of power are moving beneath regulation, using silence as shield;
∴ Thus we see a paradox - the technical shell compresses, the on-chain bloodstream circulates without fever, the macro structure redefines.
⚖️ The Stoic mind recognizes this not as chaos, but as necessary stillness.
∴ The Arcane practitioner does not chase a move - he maps the pressure points and waits;
∴ He acts only when the veil thins;
∴ To act prematurely is to violate the structure;
∴ To wait blindly is to betray the will;
∴ The Stoic Arcane path demands this: know the boundary, seal the insight, then act - once - with clarity;
∴ At ($114.6K) the veil may part. If it does not - the silence continues.
⊢
✦ Structure Bearish.
▦ This is a bearish containment, not a breakdown.
∴ The market is not collapsing - it is being held below by absence of volume, of intention, of structural reversal;
∴ The EMA's are stacked above like iron gates;
∴ The price has failed to break $114.6K - the veil remains intact;
∴ On-chain data confirms neutrality, not optimism;
∴ Macro signals suggest accumulation by institutions - but not defense for the public.
⊢
🜎 Therefore:
∴ Technically Bearish - (structure not yet reversed);
∴ Tactically Neutral to Bearish - (fragile repique);
∴ Strategically in Transition Phase - (institutions buying beneath silence).
✴️ Conclusion: Until ($114.6K) is broken with conviction, the structure remains bearishly biased - wrapped in stillness.
⊢
⧉
· Cryptorvm Dominvs · MAGISTER ARCANVM · Vox Primordialis ·
⚜️ ⌬ - Silence precedes the next force. Structure is sacred - ⌬ ⚜️
⧉
⊢
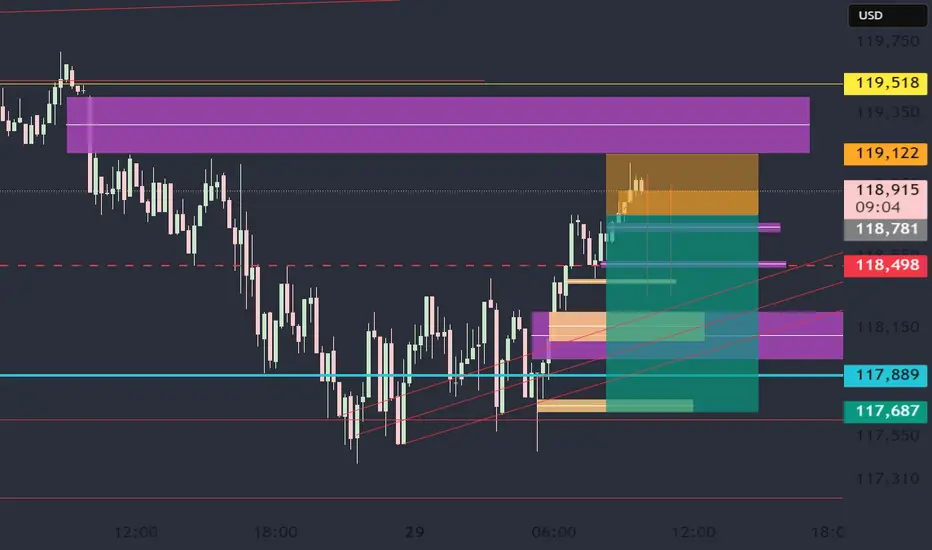
BTC whats next ? a reversal in LTF
* **Blue Zone** = Minor bullish support or reaction zone
* **Yellow Zone** = Major bullish order block / demand zone
* **Red Zone** = Bearish supply zone or resistance
---
### 🧠 **Scenario Planning:**
#### ✅ If price **holds above the blue zone**:
* Expect a **bullish continuation**
* Target: **Red zone** (potential resistance or reversal area)
* Could be a scalp long opportunity with SL below blue
#### ❌ If price **breaks below the blue zone**:
* Expect a **drop toward yellow zone**
* Yellow zone could act as **bullish OB** and reversal point
* Possible long opportunity at yellow, targeting red again
---
### ⚠️ Key Considerations:
* Wait for **reaction confirmation** at blue or yellow before entering
* If BTC forms **bullish engulfing or BOS at yellow**, that’s your entry trigger
* Volume and market structure confirmation will strengthen conviction

Bitcoin at Key Support: A Strategic Long OpportunityBitcoin has reached a significant support level, coinciding with the 50-day moving average around 112,000. The recent correction appears to have been absorbed by the market, and the broader uptrend remains intact.
This area presents an attractive opportunity for long entries, with a recommended stop-loss placed just below Friday’s low.
Target levels for the upward movement are projected at 117,000, 121,000, 123,300, and potentially higher.
Traders should monitor price action closely around this zone to confirm bullish momentum and manage risk accordingly.

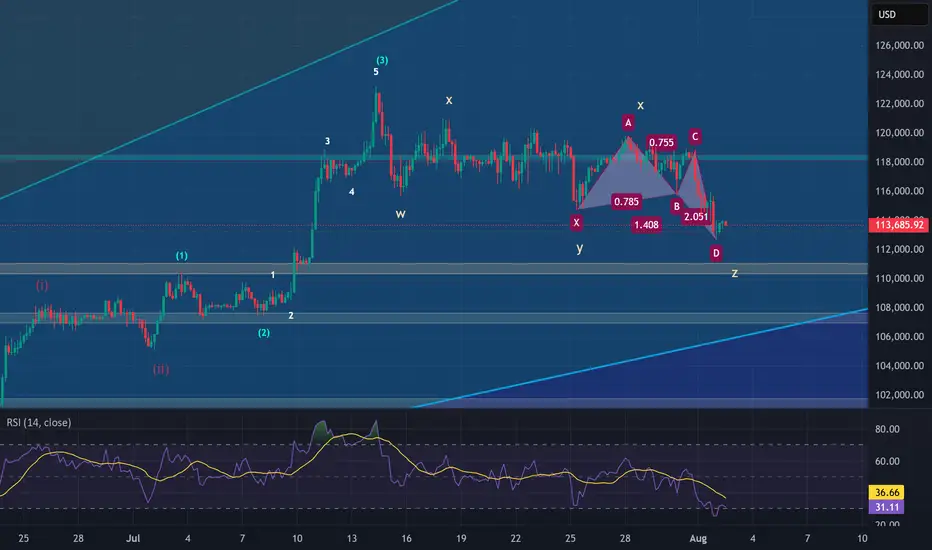
The End of BTC correction? BTC analysis 2/8/2025In my point of view, BTC has completed its correction and is now ready for a strong upward move, potentially targeting the $137,000–$139,000 range, based on the following factors:
1. Confirmation of the Butterfly Harmonic Pattern
The recent reversal occurred within the expected range of the Butterfly harmonic pattern. Typically, the XD leg in a Butterfly harmonic extends to 1.27, but in practice, this can stretch up to 1.414, which is commonly used as a flexible stop-loss zone. After testing the 1.27–1.414 range, a clear 5-wave impulse followed—testing a key trendline and making an attempt to break above the recent high. This sequence, followed by a corrective move, suggests that the broader correction may be complete.
2. Complex WXYXZ Correction Structure
In my previous analysis, I underestimated the duration and depth of the correction. The wave (4) (blue), which is part of the wave (iii), has taken considerable time—likely to allow wave (5) to extend sufficiently to break above the $130,000 level. This would support the assumption that wave (5) (purple) is the extended wave. The overall corrective structure appears highly complex, and can be counted as a W–X–Y–X–Z pattern, supported by the presence of multiple internal corrections within the wave components.
3. 0.618 Fibonacci Retracement of Wave (3)
Wave (4) has now reached the 0.618 Fibonacci retracement level of wave (3), which is significant. Historically, BTC’s corrections rarely retrace beyond the 0.87 level. This deep retracement suggests wave (4) is likely complete—unless price were to fall below that threshold, which would invalidate this assumption.
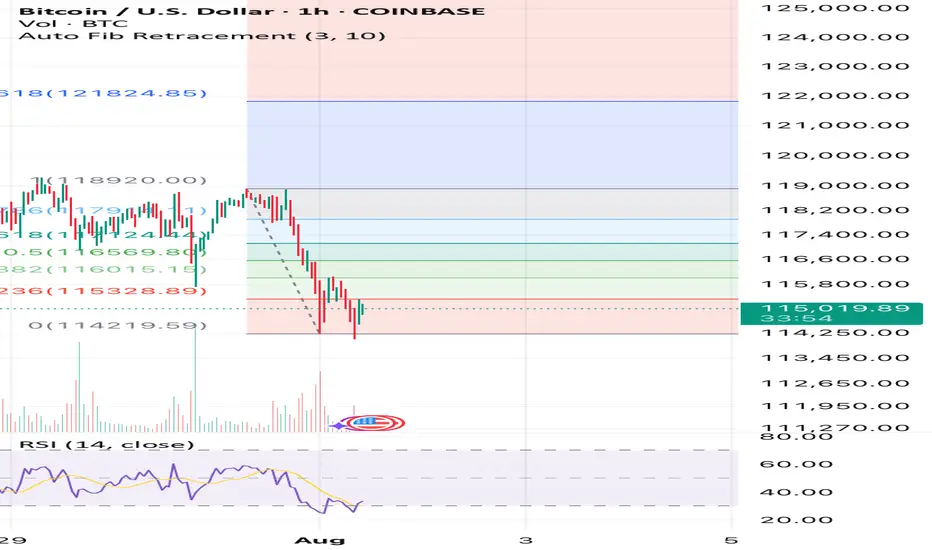
Bitcoin willIt hold if we stay above $115k ?? Fixing up last post I’ve deleted now as image was not good. Anyway simple RSI and Auto Fib Retrace with only general CRYPTOCAP:BTC market understanding backing this. This isn’t finacial advice at all. It’s pure speculation this post and anything related to it. I’m
Not a finacial advisor and I will not be held accountable for anyone’s actions that I didn’t do.
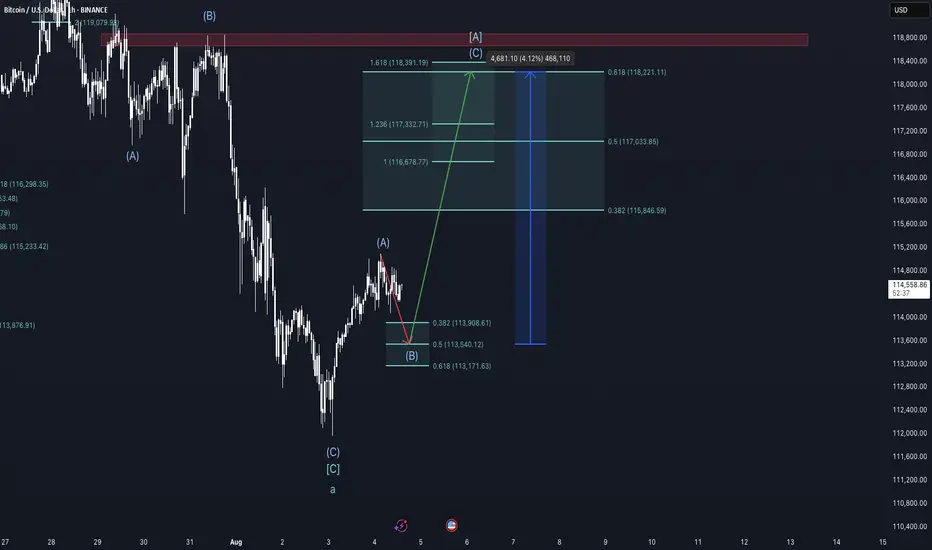
Bear trap on its way - Bitcoin Weekly Update August 4-10thThis week brings a series of macroeconomic and geopolitical developments that may influence global risk sentiment and, consequently, Bitcoin’s price trajectory.
On Monday, the U.S. releases Factory Orders, a key indicator of industrial demand. Surprises in this data can affect risk assets broadly, as they reflect business investment activity. Weak numbers would likely increase expectations of monetary easing, which tends to support Bitcoin.
On Tuesday, the spotlight turns to the ISM Non-Manufacturing PMI, a leading indicator for the U.S. services sector, which accounts for roughly 70% of GDP. A significant deviation from expectations—especially a decline—could reinforce rate-cut expectations and provide tailwinds for speculative assets like Bitcoin.
Thursday is a critical day, with the Bank of England's interest rate decision in focus. While direct effects on crypto are limited, a hawkish stance could weigh on global risk appetite if inflation concerns resurface. Also on Thursday, the U.S. releases its weekly Initial Jobless Claims—a timely barometer of labor market strength. A rising trend here would suggest economic cooling, strengthening the case for looser policy and potentially benefiting crypto.
However, the most geopolitically sensitive event this week is the reintroduction of country-specific reciprocal tariffs by the United States, taking effect on August 7. Affected countries include Canada (35%), Mexico (30%), and Brazil (50%). These measures could re-escalate trade tensions and trigger short-term market volatility. Retaliatory responses from these countries would likely fuel risk-off sentiment, pressuring assets across the board.
From a technical standpoint, Bitcoin remains within a multi-degree corrective structure according to the Elliott Wave framework. On the cycle degree, we are in a B-wave; on the primary degree, in an A-wave; on the intermediate degree, in a B-wave; and on the minor degree, in a C-wave. This implies that a short-term move lower is still expected, but once complete, a relief rally of approximately 4% could follow before the onset of a larger correction, likely Primary Wave B.
Chart structure suggests that Minor Wave C is in its late stages. Early signs of exhaustion, such as waning downside momentum or bullish reaction at key support zones, could offer clues of an approaching bottom. However, such a rebound should be viewed as temporary and not a trend reversal.
Taking a view between the lines on the on-chain data, the liquidity heatmap shows major liquidity around the red rectangle drawn into the chart, suggesting higher prices. Also, the rather low funding rate on futures suggest an exhausted downward trend and a trend reversal in the near future is likely.
Conclusion:
This week’s calendar offers several macroeconomic catalysts with the potential to move markets. U.S. economic data and tariff policy developments will likely shape near-term sentiment. Technically, Bitcoin remains in a corrective phase with limited downside left before a short-term recovery becomes more probable. Traders should stay alert for signs of a local bottom to position for a tactical bounce—but be cautious, as a larger correction likely looms beyond that.
This is no financial advice and for educational purposes only.
Bitcoin BullishAfter exiting a correction, the first impulse (Wave 1) appears. I expect a retracement of at least 50% of the Fibonacci.

BTC SELLGoing for 4h reversal, dayle timeframe has a low that should be broken and potental liquidity taken to move higher, currently its shrinking price twords a middle price.
Red trend lines are potental buy direction, if brakes below, we go lower, if does not, it can be a pivot for buys.
Yellow squears are 5min gaps
Puruple are higher timeframe gaps
Ultimetly looking at 4h to either open below lows(117k) or wick to dayle low(red straight lines)
BITCOIN 15-Min Chart – Key Support Retest with Bullish PotentialThis 15-minute BTCUSD chart shows Bitcoin retesting a strong support zone near $112,680 after a clear downward move. The price is currently reacting at a previous demand area, marked in blue, just above the session’s LOW. A possible bullish reversal setup is forming if the support holds, targeting the previous HIGH around $114,000 and a potential TP at $114,200. Traders may look for confirmation signals (e.g., bullish engulfing, order block reaction) before entering long positions.

Btcusd We are expecting a retracment back to the zone then a reversal candle stick on de zone then we sell

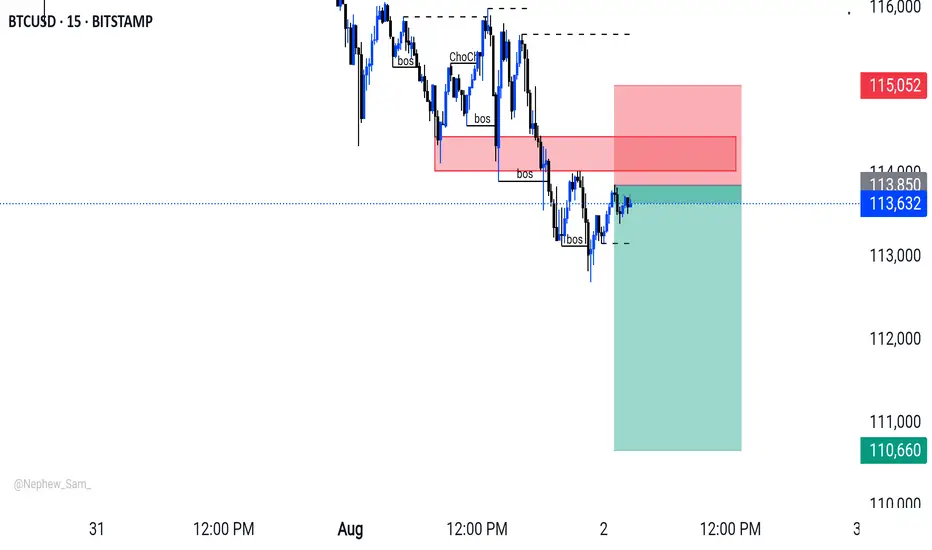
BTC Breaks Support – What's Next for Bitcoin?🧠 Bitcoin Technical Analysis – August 1st, 2025
📉 BTC/USD is under pressure, currently trading near $114,200, after dropping from the recent range highs. The chart shows a clear breakdown from a key consolidation zone between $114,000–\$115,500, marked as a crucial support zone.
🔍 Key Observations:
Major resistance remains at $123,000, where BTC topped mid-July.
A bullish trendline from early July has been broken — confirming momentum shift.
Local support sits at $111,800, a potential next landing zone if this breakdown continues.
The RSI (14) is now in oversold territory, below 30, signaling potential bounce or short-term relief — however, no bullish divergence is visible yet
---
🔎 Volume Spike & Momentum:
A noticeable volume spike has appeared alongside the breakdown, confirming strong selling pressure .
Short-term moving averages (e.g., 10 EMA) are now above price, adding to the b earish short-term bias.
🧭 Conclusion :
This region is critical for bulls — if BTC can reclaim the purple support box, it could invalidate the breakdown and trap aggressive shorts. Otherwise, \ $111,800 is the next area to watch for a reaction.
Let me know your thoughts below — Will this support hold or is \$110k next?
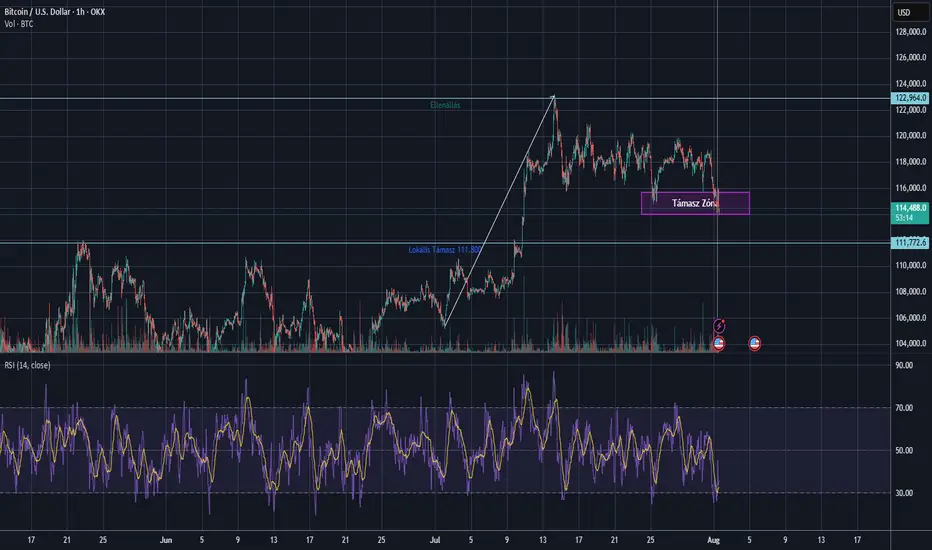
BTCUSD – Bullish Recovery Setup Forming Near Trendline Support🧠 Market Structure & Technical Breakdown
The BTCUSD 4H chart showcases a well-formed descending triangle or falling wedge structure with clearly respected major and minor descending trendlines. Currently, price action is testing a dynamic support zone, highlighted in green, which has been a strong reaction area in the past.
This area aligns with a bullish accumulation zone, from which buyers have previously stepped in to initiate impulsive moves. Given the confluence of diagonal support and horizontal price reactions, we may be on the verge of a bullish breakout opportunity.
📍 Key Zones & Trendlines
✅ Green Support Channel (Demand Zone): Acting as a key pivot for multiple recent rejections, this area (~114,000–113,000) is now being revisited again, offering potential buy interest.
📉 Minor Trendline: A short-term descending resistance around 120,000—likely the first barrier in case of a bounce.
📉 Major Trendline: A more extended dynamic resistance line connecting swing highs, currently intersecting near the 124,000 region.
🔄 Potential Price Scenarios
Primary Bullish Setup (MMC Plan):
Price bounces off the green demand zone.
Breaks above the minor trendline (~120K).
Pullback retest to confirm breakout.
Continuation toward the major breakout level (~124K and beyond).
Invalidation / Bearish Case:
A clean breakdown below 113,000 with strong bearish momentum would negate this setup, likely targeting the psychological support near 110,000.
🧠 MMC Mindset: Trade with Patience & Confluence
This is a classic accumulation-to-breakout scenario. Smart traders wait for confirmation—especially as BTC often exhibits false breakdowns before a major move. Monitor candle behavior, volume, and reaction to the minor trendline.
Let the market show signs of strength (like bullish engulfing, pin bars, or a breakout-retest) before committing to the upside. Avoid FOMO; the key is discipline and precision entry at structural break points.
✅ Trade Plan Summary:
Watch zone: 113,000–114,500 for bullish price action
Breakout level: Minor trendline (~120,000)
Target zone: 123,500–124,000 (Major resistance)
Stop-loss idea: Below 112,800 (Invalidation of structure)

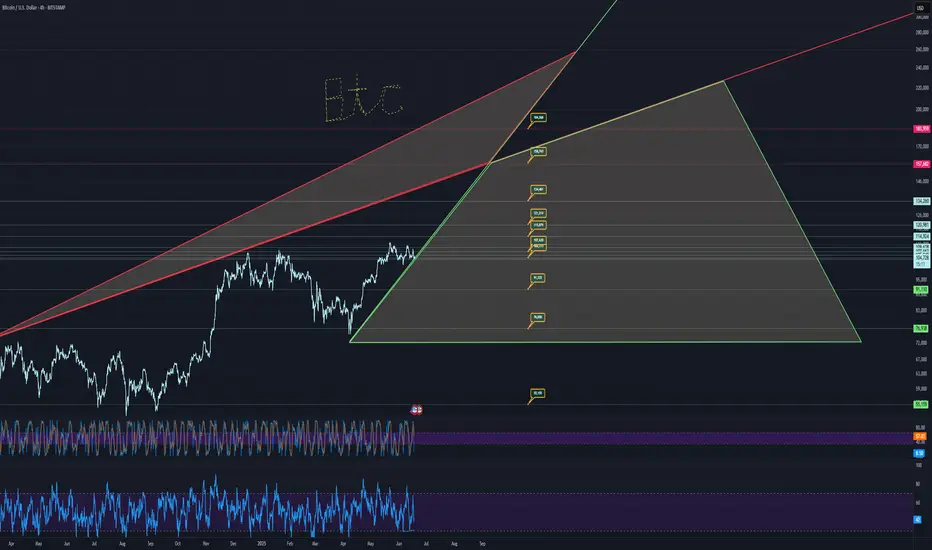
BTC USD 180K BIG HOW?Trends and price targets is how, but realistically, it looks like 134k in the short term.
Drop is wicked if it were to occur, takes price to literally 12k, which you want to go all in if that occurs.
55k is another drop zone.
Otherwise, it looks fairly bullish.
buy zone marked in green,
sell in red.
watch the trends
and price targets are pretty accurate usually.
good luck!!
Custom charts by request.
BITCOIN, GOLD ANALYSISQuickly we dive into analyzing our favorite pairs for the day we check and confirmed our directional biased which at the end of the day 1:2 is being targeted. BTC is is in a tricky spot but we will always follow the direction of the market to be more o the safer side.


Trading balanceTrading balance The price of the asset has rebounded from the balance zone. With the prospect of growth into the resistance zone.