BTC ROAD TO ALL TIME HIGHHere is my prediction on weekend is BTC is a great time to pump.
So taking long now, SL near current support around 100-120 pips is good enough
BTCUSD.PI trade ideas

BTCUSD – At a Make-or-Break LevelBTCUSD – At a Make-or-Break Level: Will Bitcoin Rebound or Slide Further?
Bitcoin continues to hover near a critical support level after last week's sharp drop. With rising macro uncertainty, shifting institutional flows, and growing interest in crypto regulation, BTCUSD is showing signs of a potential reversal — but traders should proceed with caution.
🌐 Macro Outlook – Debt Pressure, ETFs & Election Talk Fuel Uncertainty
US fiscal stress is building: Analysts warn that the United States could see interest payments exceed $1 trillion in 2025 — more than its defense or healthcare budget. This puts pressure on the Federal Reserve to consider fiscal tightening instead of rate cuts.
Spot Bitcoin ETF inflows are slowing: After a strong start in early 2024, institutional flows into spot BTC ETFs have cooled down recently. Hedge funds and asset managers are waiting for more clarity on economic policy.
Pro-crypto narratives gaining traction in US politics: With elections approaching, political figures are floating proposals to use Bitcoin as a strategic reserve asset and encourage crypto-based financial infrastructure.
Meanwhile, the US Dollar Index (DXY) remains volatile. A weaker dollar could support crypto, but stronger-than-expected inflation data may fuel further caution.
📉 Technical Analysis (BTCUSD – H1 to H4)
BTC is currently trading within a medium-term descending channel, and has recently tested the key support zone near 103,108.
A potential V-recovery pattern is forming. If buyers can hold this zone and break above 104,184, the price may target 106,047 and eventually 107,586.
However, EMA clusters (50–100–200) on the H1 chart are still pressing downward. A confirmed bullish reversal would require a breakout above 105,200 with strong volume.
✅ Suggested Trade Plan
🟢 BUY ZONE: 103,100 – 103,300
Entry: On price reaction with confirmation candlestick
SL: 102,600
TP: 104,184 → 106,047 → 107,586
🔴 SELL ZONE: 107,500 – 107,800
Entry: Only if price rejects resistance at upper channel
SL: 108,200
TP: 106,000 → 104,500
⚠️ Avoid aggressive shorting in the current range to reduce false breakout risk.
💬 Final Thoughts for Indian Traders
The current market is caught between macroeconomic caution and long-term crypto optimism. Bitcoin is holding near its lower range — a zone that historically triggers upward momentum.
For Indian traders, the key is to wait for clear structural confirmation and respect technical levels. Let price and macro alignment guide your decisions, not emotion or hype.
Plan the trade. Trade the plan. Protect your capital.

Bitcoin Could Hit as High as $400KWhen comparing our macro cycle to the 2017 cycle, we see the potential for a very parabolic run on Bitcoin. I believe Bitcoin could hit as high as $400K by 2029. This is because Bitcoin tends to follow the stock market, and I anticipate a major blow-off top coming for the stock market. I expect one more big parabolic run on the Dow Jones leading up to 2029, which would fuel Bitcoin’s rise to $400K.
The lowest I see Bitcoin going during this parabolic run is $250K. On the higher end, I could see it hitting $400K or even more. Big things are coming.
As always, stay profitable.
— Dalin Anderson

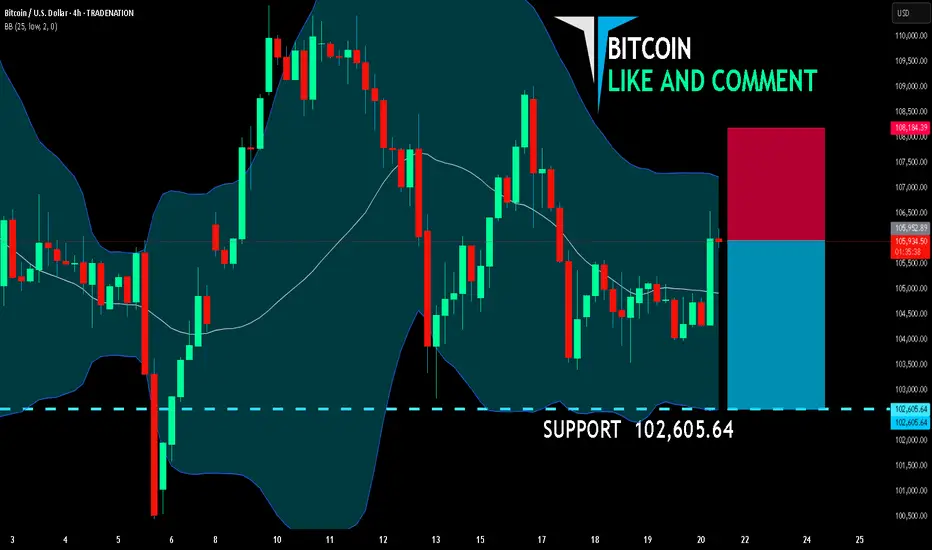
BITCOIN BEARS WILL DOMINATE THE MARKET|SHORT
BITCOIN SIGNAL
Trade Direction: short
Entry Level: 105,952.89
Target Level: 102,605.64
Stop Loss: 108,184.39
RISK PROFILE
Risk level: medium
Suggested risk: 1%
Timeframe: 4h
Disclosure: I am part of Trade Nation's Influencer program and receive a monthly fee for using their TradingView charts in my analysis.
✅LIKE AND COMMENT MY IDEAS✅
BTCUSD BTCUSD – Bearish Setup in Bullish Trend (Scalp Trade Idea)
Position: Short
Entry: $105,360
Take Profits: $104,500 / $104,000
Stop Loss: $106,000
Trend Context: Uptrend – shorting overextended price move

BTCUSD Analysis UpdateBTC/USD Analysis Update 📈
Bitcoin has rebounded successfully after touching the 103500 support level and is currently trading around 105500. However, the ongoing correction may continue to test the psychological support at the 100000 round number in the short term ⚠️.
Key Points:
Support Bounce 🎯: BTC found buying interest at 103500, in line with our previous strategic analysis.
Immediate Resistance 📉: The current rebound faces direct resistance near 106000 (200-hour moving average).
Downside Risk 📉: Failure to hold above 105000 could trigger another decline toward 100000.
Risk Management:
Long positions should set stop-loss below 103000 ⛔️.
Short entries may consider the 106000–107000 range, targeting 102500 and 100000
⚡️⚡️⚡️ BTCUSD ⚡️⚡️⚡️
🚀 Buy@ 102500 - 103500
🚀 TP 106000 - 106500
🚀 Sell@ 106000 - 106500
🚀 TP 103500 - 101500
Accurate signals are updated every day 📈 If you encounter any problems during trading, these signals can serve as your reliable guide 🧭 Feel free to refer to them! I sincerely hope they'll be of great help to you 🌟 👇
BTC Cycles & TA: 6/16/25Charts are now warning of a dangerous chart patterns again. Last time, they warned of the recent dip and we have since recovered, but now we have new negative patterns forming, except these are powerful negative patterns.

BTC daily level observation New perspectivesOn the daily chart, MACD shows divergence.
In the yellow box, there is a possible head and shoulders top structure
Pay attention to whether there is a large real black candlestick at the daily level that breaks through the lower boundary of the box.
Let's wait patiently

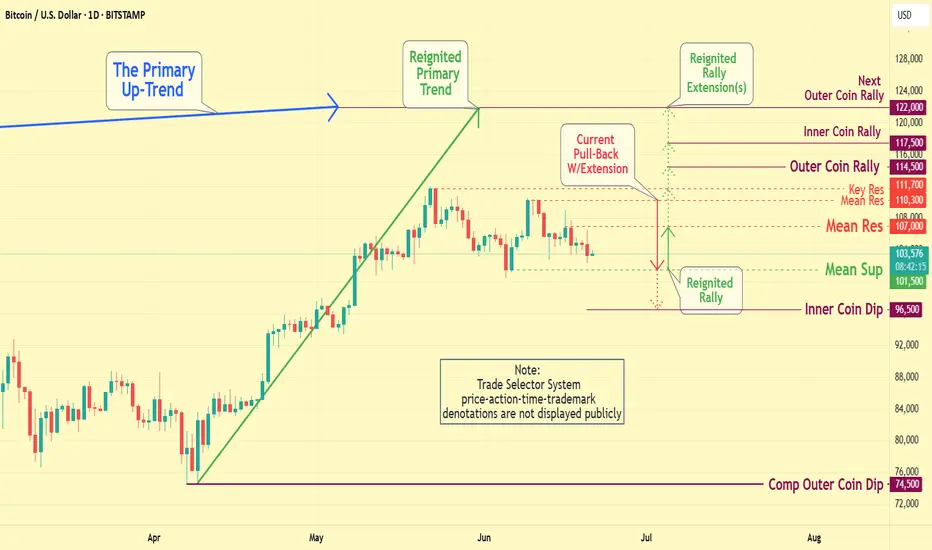
BTCUSD:Technical Analysis and OutlookIn the recent trading session, Bitcoin exhibited an upward trend; however, it subsequently experienced a significant decline from the established Mean Resistance level at 110300. On Friday, Bitcoin exhibited notable price action, characterized by a pump-and-dump scenario. At this juncture, Bitcoin is retracing downwards as it seeks to approach the Mean Support level at 101500 and the ultimate Inner Coin Dip at 96500. It is essential to acknowledge the potential for an upward rally from the Mean Support levels of $101500 and/or the Inner Coin Dip at $96500. Such a rally could culminate in a retest of the Mean Resistance level at $107000.
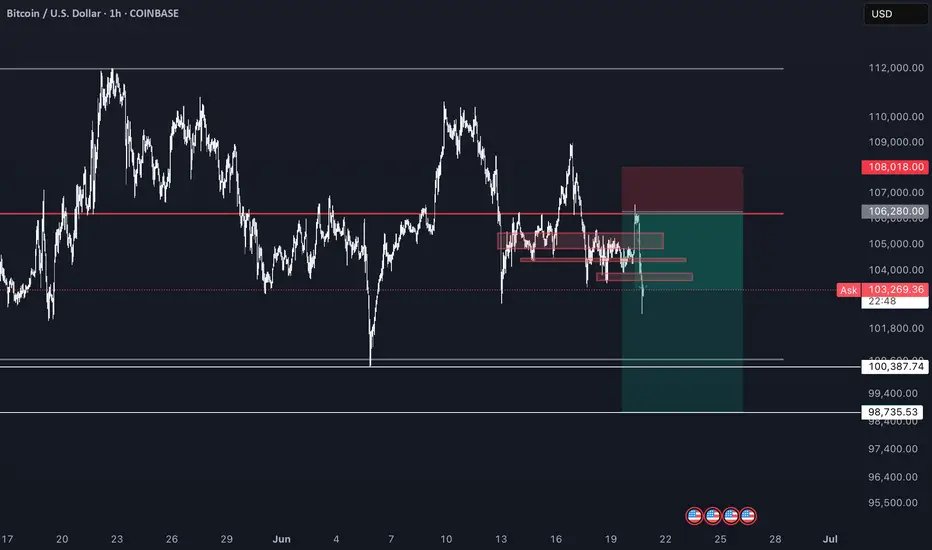
BTC short "
@Maverick Notify For short I will start entering at 106280 with 35-50% of size and keep adding until 107200 with stops above 107700, Sl: 108050....weekly liq map has hot spot just at all higher lows around 50EMA 1d, keep in mind // 2 week map still most of liq to the downside but I would also take note we have a big cluster just above 112k // 1 month liq map is showing that a lot of liq is above so keep in mind we could run the highs and stop any shorts we take.
"
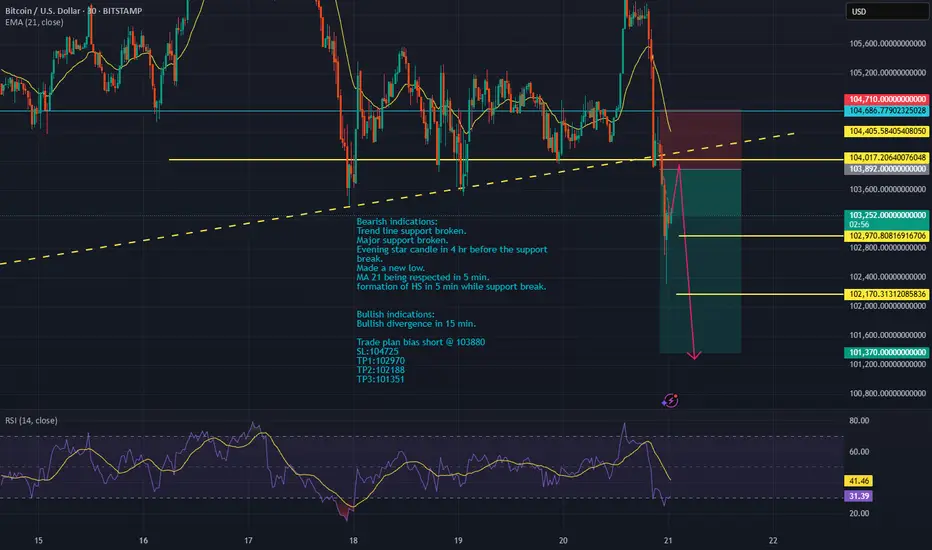
BTC-bias shortBearish indications:
Trend line support broken.
Major support broken.
Evening star candle in 4 hr before the support break.
Made a new low.
MA 21 being respected in 5 min.
formation of HS in 5 min while support break.
Bullish indications:
Bullish divergence in 15 min.
Trade plan bias short @ 103880
SL:104725
TP1:102970
TP2:102188
TP3:101351
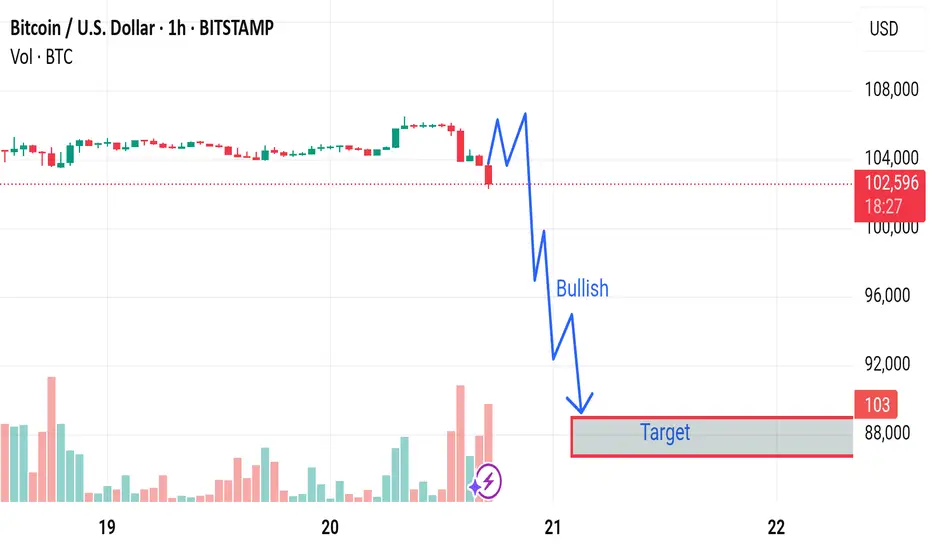
Market next forecast 🔄 Disrupted Analysis: Bullish Counter-Scenario
🧠 Original Bias:
The chart predicts a strong bearish move, with a target around 88,000 USD.
The label "Bullish" seems misleading as it’s placed in a steep downward move.
---
📉 Issues With the Original Analysis:
1. Volume Misinterpretation:
Increasing red volume could indicate capitulation or a temporary panic sell-off, not necessarily the start of a new trend.
A bounce could follow if buyers step in.
2. Support Zone Ignored:
The analysis overlooks any previous support levels in the 100k–98k range, where buyers may be waiting.
3. No Confirmation for Breakdown:
The chart does not show a completed breakdown of a key structure or trendline.
The blue squiggle assumes a breakdown will happen, but no technical confirmation is visible.
---
📈 Disruption Scenario: Bullish Reversal Possible
Rejection from 102k zone could be a liquidity grab, not the start of a downtrend.
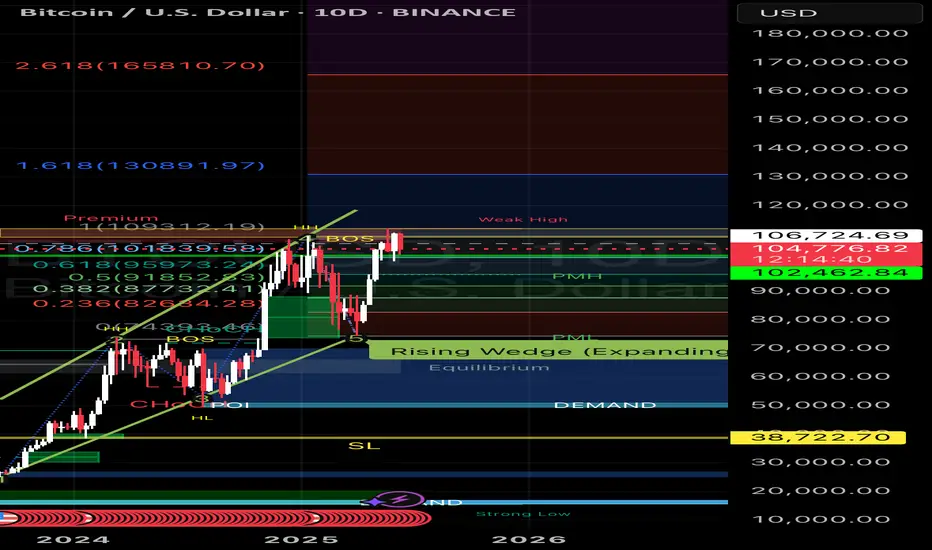
₿itcoin: Holding steadySince our last update, Bitcoin has traded in a relatively stable range. As expected, there's still a strong case for the crypto leader to climb into the upper blue Target Zone between $117,553 and $130,891. However, a deeper pullback below the $100,000 mark remains a real possibility before that move unfolds. Regardless of the path it takes, we continue to expect Bitcoin to reach this upper zone, completing green wave B. From there, a corrective wave C—also in green—is likely to follow, driving the price down toward the lower blue Target Zone between $62,395 and $51,323. This move would mark the end of the broader orange wave a. For now, we’re watching for a potential b-wave recovery before the final leg lower toward the bottom of blue wave (ii) takes shape. That said, there's still a 30% chance that blue wave (i) isn’t done yet and could extend significantly above $130,891 before any meaningful correction begins.
📈 Over 190 precise analyses, clear entry points, and defined Target Zones - that's what we do.

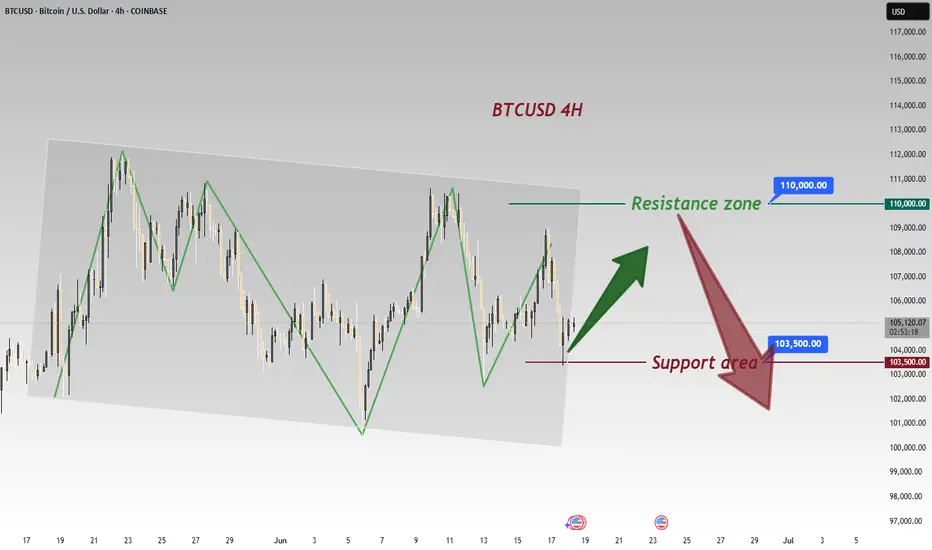
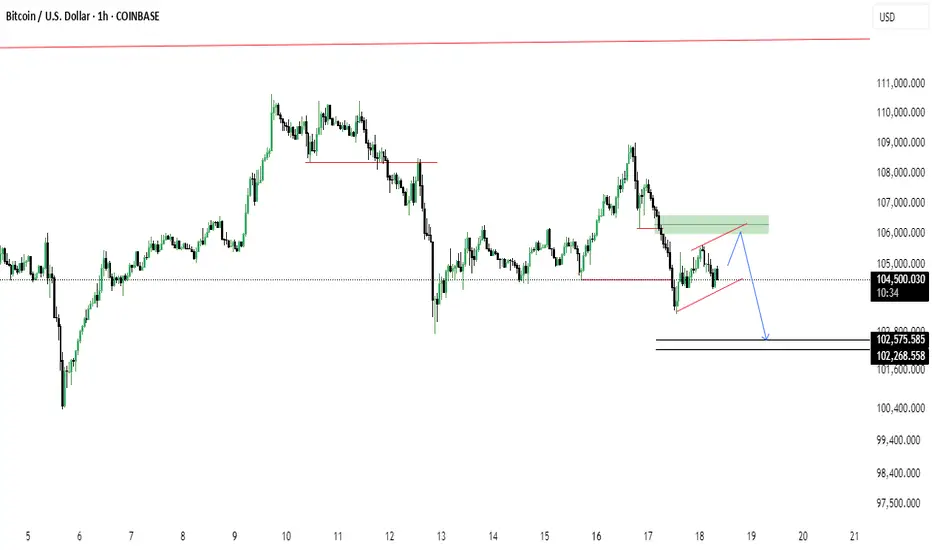
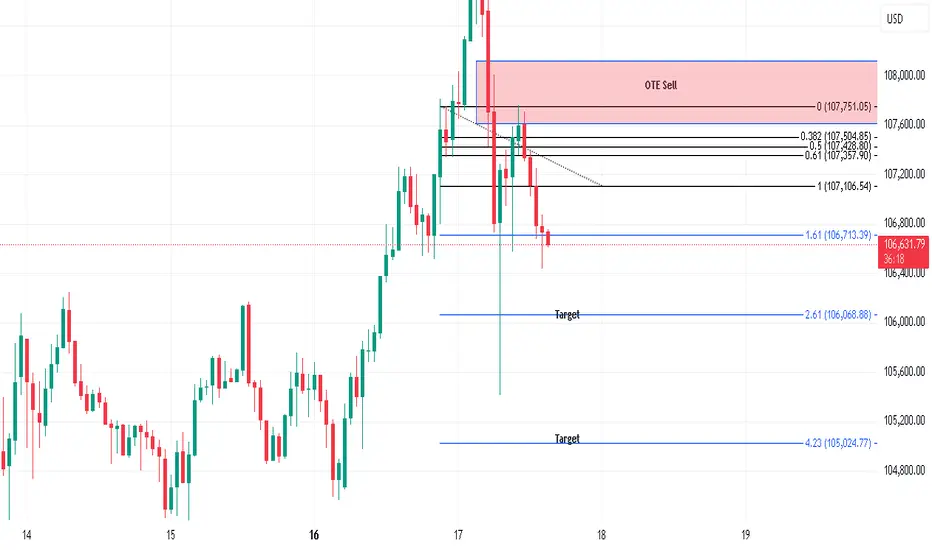
BTC/USD Rising Wedge Breakdown Ahead?Bitcoin shows signs of a potential bearish reversal as price forms a rising wedge beneath a key supply zone. After a recent drop, price is retesting the 106k area (green zone), possibly setting up for continuation to the downside.
🔹 Rising wedge pattern near resistance
🔹 Bearish retest at previous support turned resistance
🔹 Potential drop targets: 102,575 and 102,268
🔹 Break below wedge support could accelerate the fall
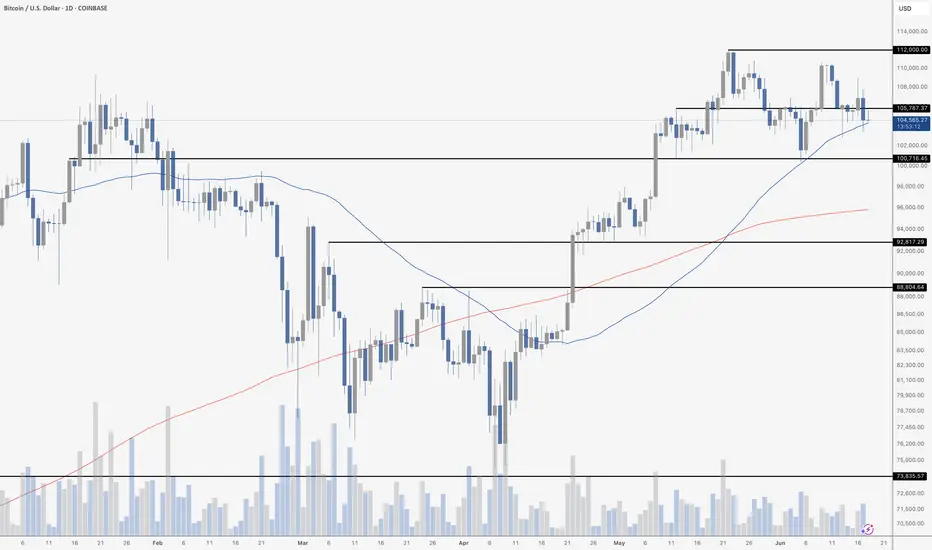
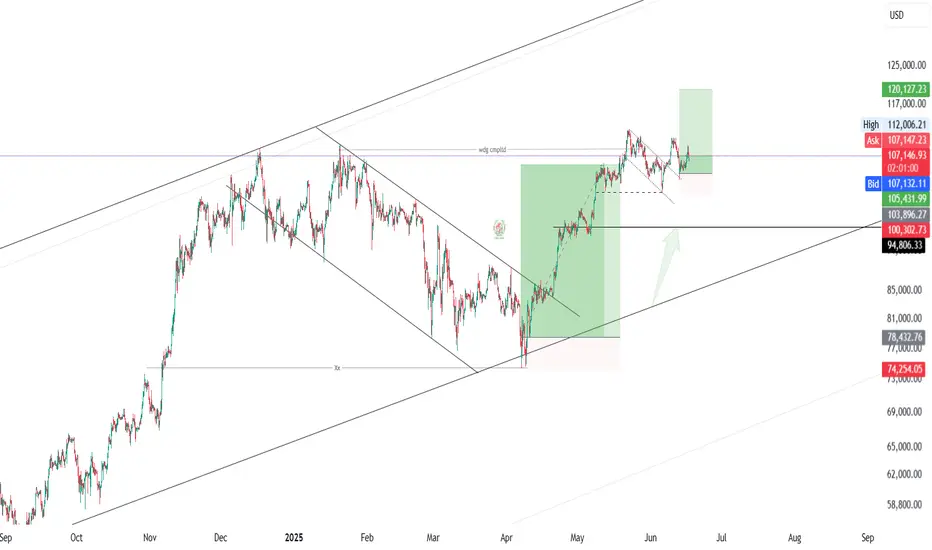
Bitcoin And The 50 MABitcoin continues to consolidate in a tight range just below the $112,000 resistance, with the price currently hovering around $104,600. The chart shows clear horizontal support at $105,787 and dynamic support from the 50-day moving average – which has once again provided a modest bounce after being tested multiple times this month.
So far, the structure remains healthy but indecisive. BTC is printing a series of higher lows since the March bottom, but the repeated rejection near $112,000 raises the possibility of a developing lower high – a potential early signal of waning bullish momentum if follow-through selling emerges. Volume is declining slightly, suggesting a wait-and-see mode as the market anticipates macro events like the Fed meeting.
Overall, until Bitcoin breaks above $112K with conviction or loses $105K and the 50 MA, this chop is likely to continue. Bulls want to see a clean breakout and strong candle close above resistance, while bears are watching for a break back below $100,718 to open up downside potential toward $92,817.
BTC – Rising Wedge Breakdown Raises the StakesCRYPTOCAP:BTC is slipping below the rising wedge structure on the 4-hour chart 📉 — a move that demands attention.
Is this a real breakdown signaling a deeper drop, or a deceptive shakeout to trap late bears? 🤔
Momentum is shifting fast. The next few candles will decide whether this move holds weight or flips direction.
Stay sharp — volatility ahead ⚠️

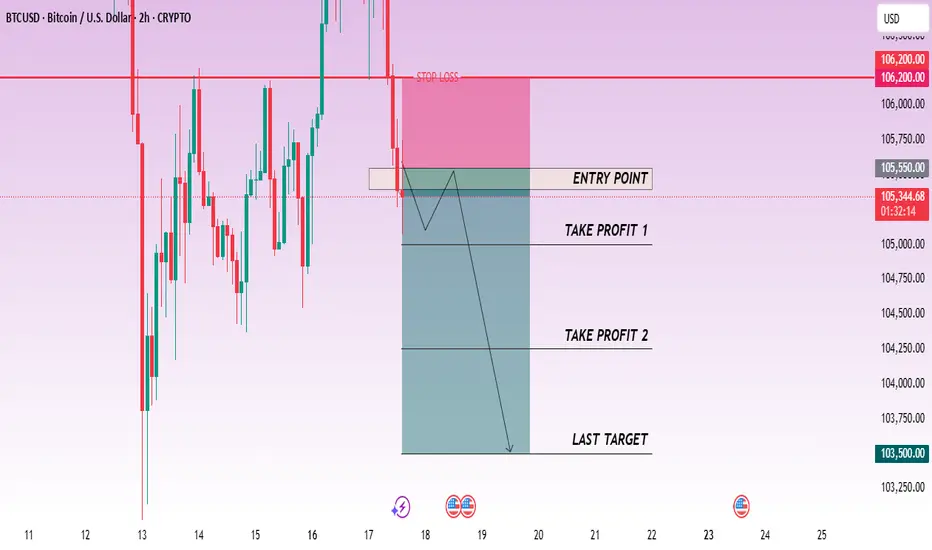
CHECK BTCUSD SIGNAL READ CAPTAINbtcusd sell now ✅
entry point (105550) (105400)
TAKE PROFIT 1: (105000)
TAKE PROFIT 2: (104250)
LAST TARGET (103500)
STOP LOSS (106200)
BTC BULLS IS IN CONTROL Bitcoin holds strong in its bullish sentiment, securing a fresh high at 111K.
With momentum on its side, a new projection toward 120K is now firmly in play — the bullish trajectory stays intact. 📈
Momentum traders, stay alert. This leg might just be getting started. follow for more insights , comment and boost idea .
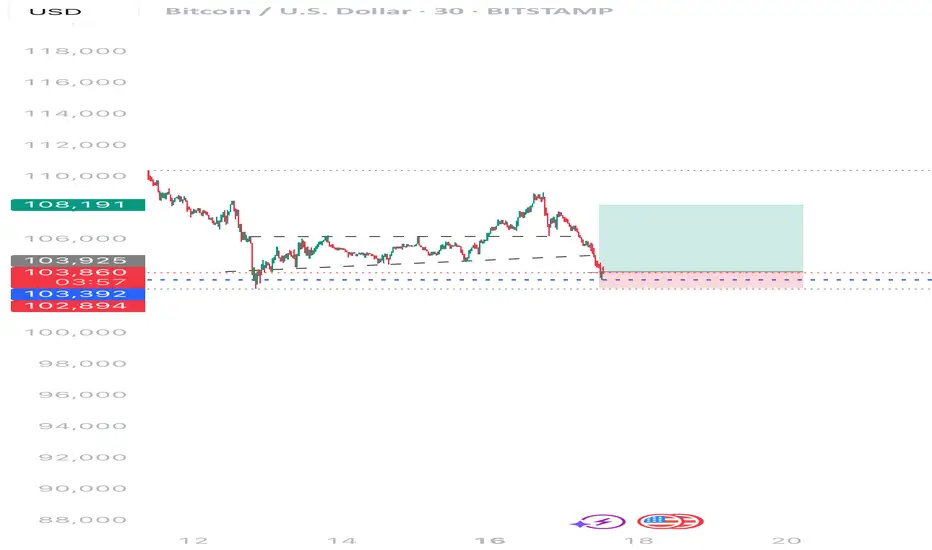
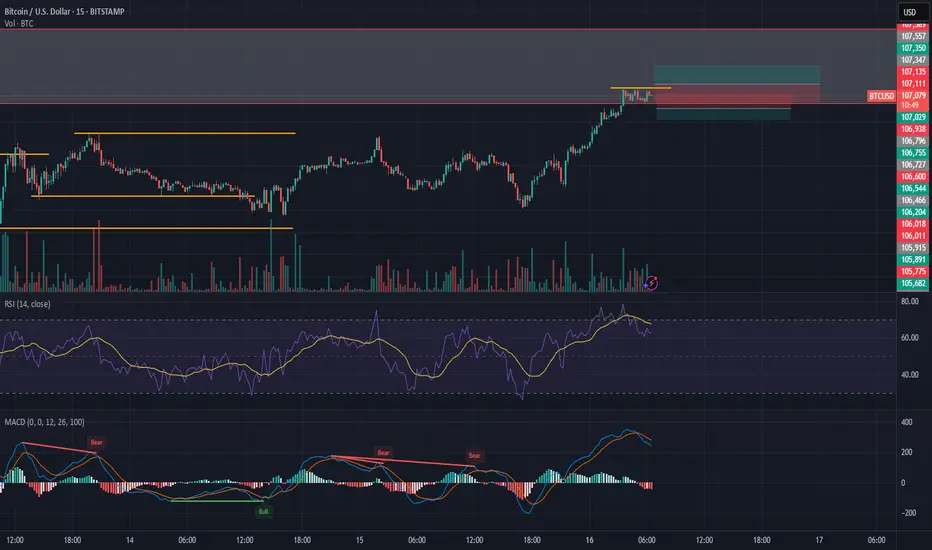
6/16/2025 3:33 AM PST - ChatGPTBTC/USD 15-Minute Chart Analysis – June 16, 2025 – 06:25 UTC-4
Exchange: Bitstamp | Current Price: $107,149
Trend: Short-term recovery from previous dump; nearing local resistance zone
Market Context: Rebound after consolidation below $106K; price testing $107.3K ceiling
📈 Technical Indicator Summary
1. RSI (14)
RSI: 67.40, close to overbought zone
Signal line: 69.48
➡️ Strong bullish momentum, but approaching exhaustion; potential pullback or consolidation soon
2. MACD (12,26,9)
MACD line > Signal line — bullish crossover confirmed
Histogram green and above 0, but flattening
➡️ Positive momentum remains, but bullish strength is fading
3. Volume
Volume increasing during upswings, declining during sideways phases
➡️ Accumulation confirmed; buyers were stepping in under $106K
4. Structure / Key Levels
🔻 Support Zones:
$106,600: Minor local support
$105,775 – $105,341: Consolidation demand zone
$105,000: Psychological & historical support
🔺 Resistance Zones:
$107,149: Current price, testing key resistance
$107,350 – $107,589: Major overhead barrier
Breakout could target: $108,000+
🎯 Trade Scenarios (Next 24 Hours)
✅ Scenario 1: Bullish Breakout Above $107,350
Conditions:
RSI stays above 60
MACD remains bullish
Price closes above $107,350 with volume spike
Entry:
📈 Buy breakout above $107,350
🎯 TP1: $107,750
🎯 TP2: $108,400
🛑 SL: $106,750 (below most recent higher low)
❌ Scenario 2: Rejection and Pullback from Resistance
Conditions:
RSI breaks below 60
MACD begins to turn down (bearish crossover)
Price fails to hold $107,149 and closes below $106,600
Entry:
📉 Sell on rejection from $107,350 + bearish divergence
🎯 TP1: $106,200
🎯 TP2: $105,800
🛑 SL: $107,550
📊 Probability Forecast (Next 24 Hours)
Scenario Probability Rationale
✅ Bullish Breakout 70% - Clean higher low structure
MACD + RSI strong
Testing resistance repeatedly = buildup for breakout |
| ❌ Pullback / Rejection | 30% | - RSI nearing overbought
Resistance near $107.6–107.8K is heavy
Possible fakeout if no volume follows |
🧠 Strategic Insight:
Momentum favors bulls, but resistance is thick between $107.3K and $107.6K.
Favor breakout entries on confirmation — not pre-break bets.
Watch RSI/MACD divergences closely.
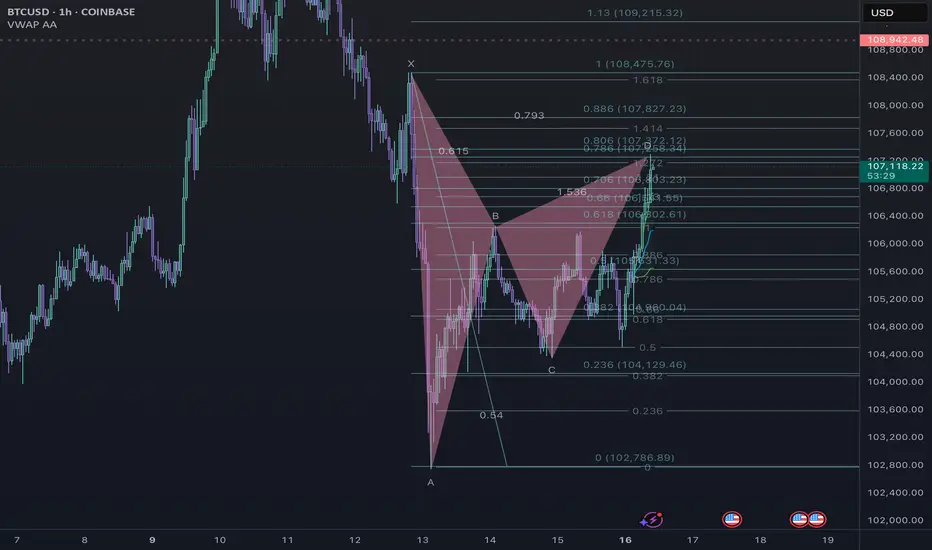
think I nailed the Gartley,on 1HR, there is more potential onsorry for all those who shorted to 99k. Harmonics never fail