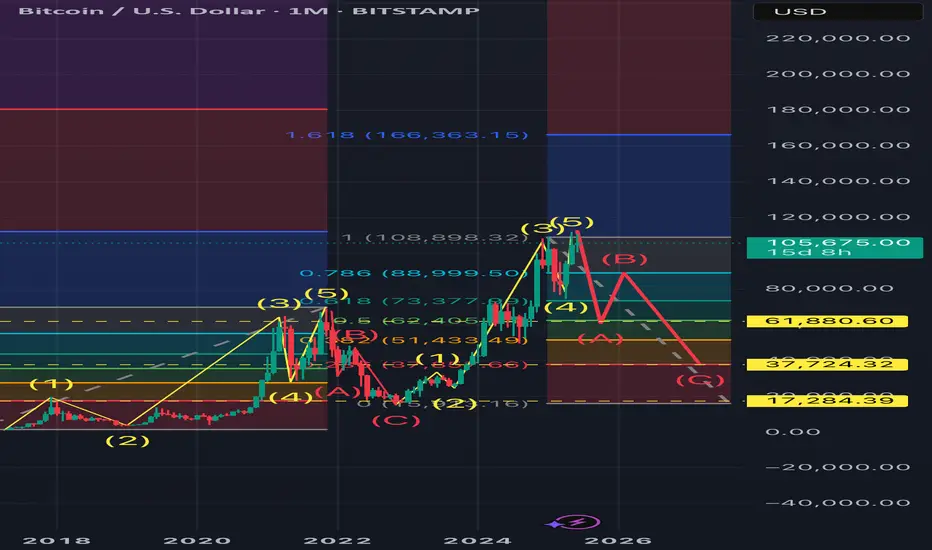
BITCOIN TOPPED. ELLIOT WAVE LONG Long term outlook of Bitcoin using EWT. I personally think Bitcoin has topped and the btc.d charts support it as well as the actual chart shown here. We’re beggining the massive correction as it did way back and I kept the ratios the same so after wave C next year or whenever, we can all buy btc at around 30k and ride the next waves up.
BTCUSD.PI trade ideas
BTCUSD: Long Trading Opportunity
BTCUSD
- Classic bullish formation
- Our team expects growth
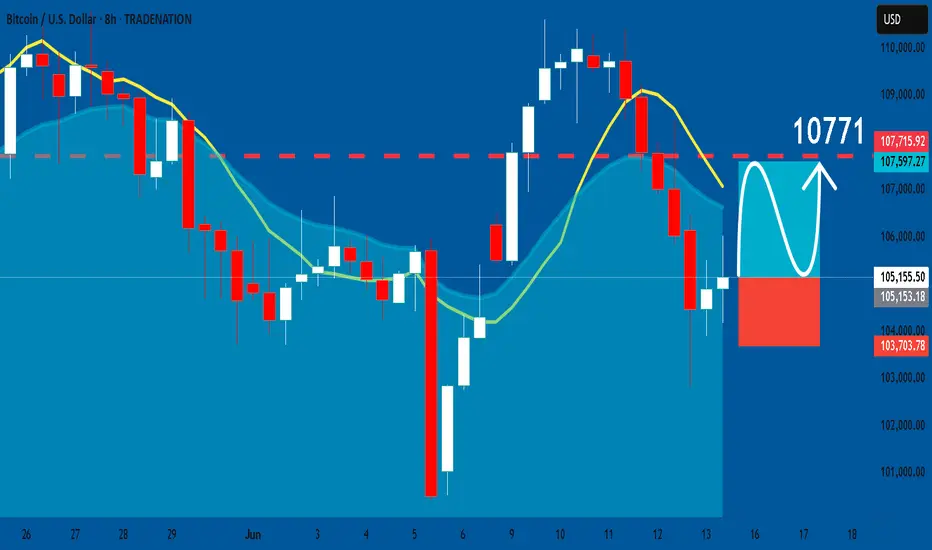
SUGGESTED TRADE:
Swing Trade
Buy BTCUSD
Entry Level - 10515
Sl - 10370
Tp - 10771
Our Risk - 1%
Start protection of your profits from lower levels
Disclosure: I am part of Trade Nation's Influencer program and receive a monthly fee for using their TradingView charts in my analysis.
❤️ Please, support our work with like & comment! ❤️
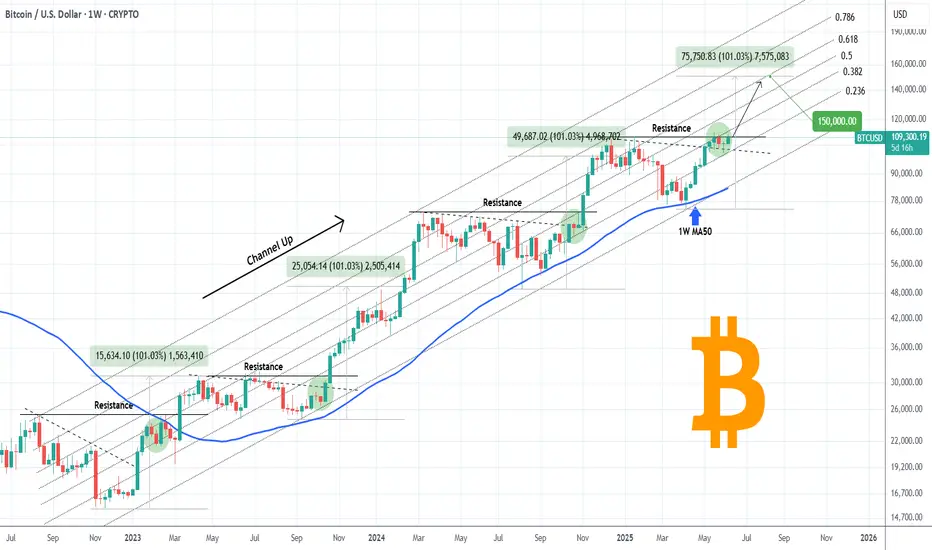
BITCOIN The beauty of structured patterns. $150k is next.Bitcoin (BTCUSD) has invalidated all bias calling for a deeper pull-back after May's new All Time High (ATH), as yesterday it broke above the previous ATH Resistance, invalidating the short-term Head and Shoulders pattern, while rebounding last week exactly on the dashed Lower Highs trend-line, confirming it as a Support level.
Within BTC's 3 year Channel Up pattern, we have seen this price action structure another 3 times. The minimum rise on such pattern has been +101% and that wasn't even a Lower Highs rebound. The other two that were exactly like the current formation, increased by a lot more.
As a result, we expect Bitcoin to complete a minimum +101% rise from the April 07 bottom, which translates to a clean $150000 Target.
Do you think the structure ill continue to hold up to $150k and possibly beyond? Feel free to let us know in the comments section below!
-------------------------------------------------------------------------------
** Please LIKE 👍, FOLLOW ✅, SHARE 🙌 and COMMENT ✍ if you enjoy this idea! Also share your ideas and charts in the comments section below! This is best way to keep it relevant, support us, keep the content here free and allow the idea to reach as many people as possible. **
-------------------------------------------------------------------------------
💸💸💸💸💸💸
👇 👇 👇 👇 👇 👇
$BTC Bounced from $103K – Hedge Short Still Active
Bitcoin was supposed to break out, but fear of war changed the plan. Instead of pumping, BTC dropped to retest support around $102,700 — and bounced strongly.
🔸 Key Support Zone: $100K – $99K
This area is holding well for now. But if BTC loses $99K, we could see a deeper drop.
🔸 Short from $108,500 is still open
We’re using it as a hedge in case the market crashes. If the price drops more, we’ll take profit on the short. If BTC goes back up to $108K+, the short will be closed on entry. That’s the best-case scenario.
🔸 What’s Next?
Everything depends on global news. If war fears grow, BTC may drop fast. If things calm down, we could see a strong recovery.
✅ We’re in a strong position — low risk, high reward. No panic. We’re ready for both outcomes.

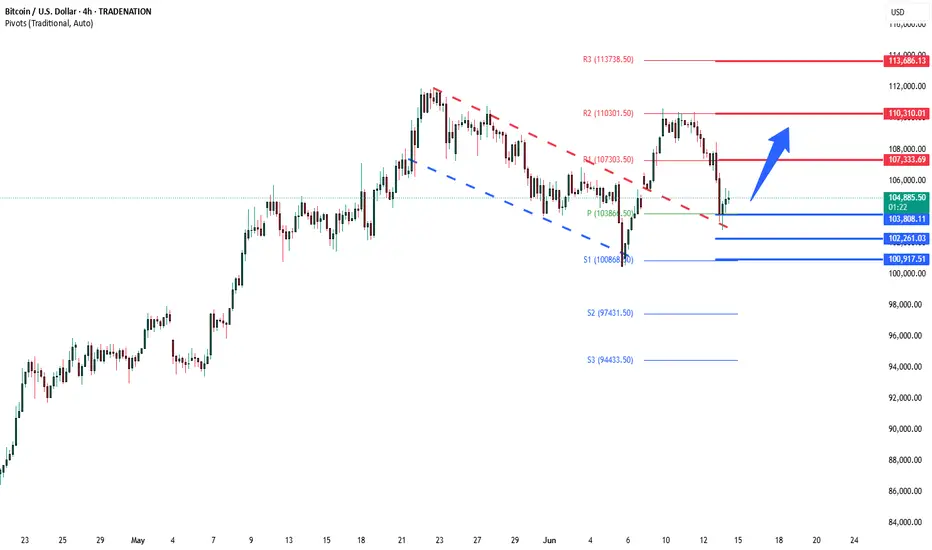
BTCUSD Breakout retest at 103.800Trend Overview:
Bitcoin BTCUSD remains in a bullish trend, characterised by higher highs and higher lows. The recent intraday price action is forming a continuation consolidation pattern, suggesting a potential pause before a renewed move higher.
Key Technical Levels:
Support: 103,800 (primary pivot), followed by 102,260 and 100,900
Resistance: 107.300 (initial), then 110,300 and 113,680
Technical Outlook:
A pullback to the 103,800 level, which aligns with the previous consolidation zone, could act as a platform for renewed buying interest. A confirmed bounce from this support may trigger a continuation toward the next resistance levels at 107,300, 110,310, and ultimately 113,680.
Conversely, a daily close below 103,800 would suggest weakening bullish momentum. This scenario would shift the bias to bearish in the short term, potentially targeting 102,260 and 100.900 as downside levels.
Conclusion:
Bitcoin BTCUSD maintains a bullish structure while trading above the 103,800 support. A bounce from this level would validate the consolidation as a continuation pattern, with upside potential toward the 107,300 area. A breakdown below 103,800, however, would invalidate this view and suggest deeper corrective risk.
This communication is for informational purposes only and should not be viewed as any form of recommendation as to a particular course of action or as investment advice. It is not intended as an offer or solicitation for the purchase or sale of any financial instrument or as an official confirmation of any transaction. Opinions, estimates and assumptions expressed herein are made as of the date of this communication and are subject to change without notice. This communication has been prepared based upon information, including market prices, data and other information, believed to be reliable; however, Trade Nation does not warrant its completeness or accuracy. All market prices and market data contained in or attached to this communication are indicative and subject to change without notice.
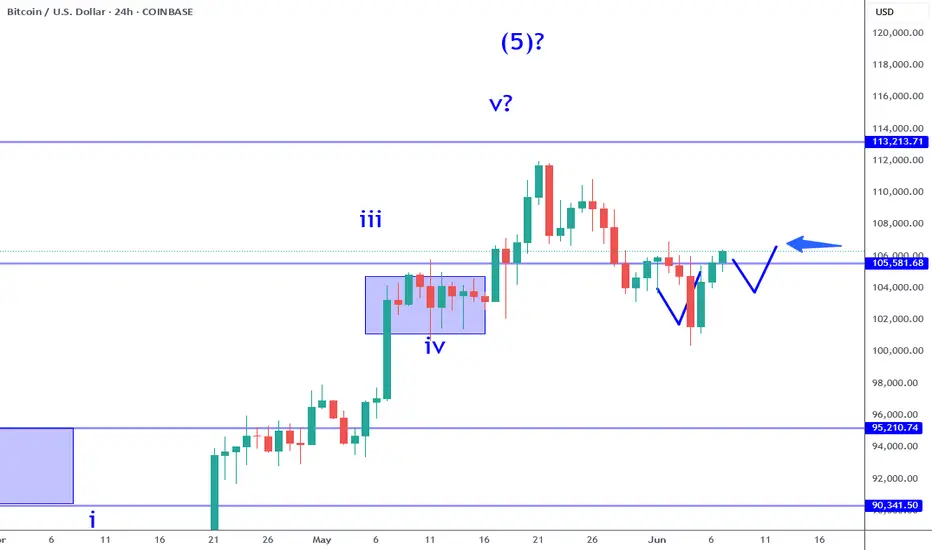
Bitcoin: Break Out Or Fake Out Can Be Long.Bitcoin has adhered to my previous week's anticipated scenario almost exactly. While this may be a coincidence, I have called similar scenarios like this numerous times just see my previous articles, I left the illustration on the chart. From here, there are two scenarios to consider, one offering greater probability than the other. Let me explain.
First consider that the Bitcoin trend has never changed. The broader tend is bullish and the previous weeks only saw a brief corrective structure which found support in the 102K AREA )see my previous article). A reversal developed and confirmed and now we are in the process of rallying back toward the highs.
Scenario 1 The Breakout: IF the high 106's are cleared, it is possible price can break out to potentially test the next resistance around the 110K area. Since this environment is typically a lower volume time of year, I believe there is a greater chance of fake out. How you manage the risk all depends on the time frame you operate on. Smaller time frames can pin point more accurate signs of follow through while maintaining tighter risk while taking the breakout on this time frame exposes you to more risk. If taking the breakout on this time frame, consider mitigating risk with smaller size or being prepared to exit IF a conflicting signal appears like a bearish pin bar.
Scenario 2 The Retrace: IF price rejects the 106K area (fake out possibility) then I will be watching for a retest of the 104K area minor support. This is the level where I would be looking for confirmation patterns like bullish pin bars etc. This would not only constitute a higher low but also establish a classic inverted head and shoulders pattern. I do not put a lot of emphasis on the broader pattern, but it can help foster a self fulfilling prophecy. This reversal offers a greater probability since it is coming from a pullback within a broader bullish trend. Also the profit objective is greater since the 110K resistance would still be the same.
How you mange this again depends on the type of strategies you employ. My analysis is meant to provide an overall roadmap of the possibilities that I anticipate and nothing more. If you are a day trader this information will not be used the same way compared to if you are a swing trader. The key is how you define the risk and the confirmations. If the market rejects both scenarios, then we simply have to readjust to the new information that becomes available.
Thank you for considering my analysis and perspective.
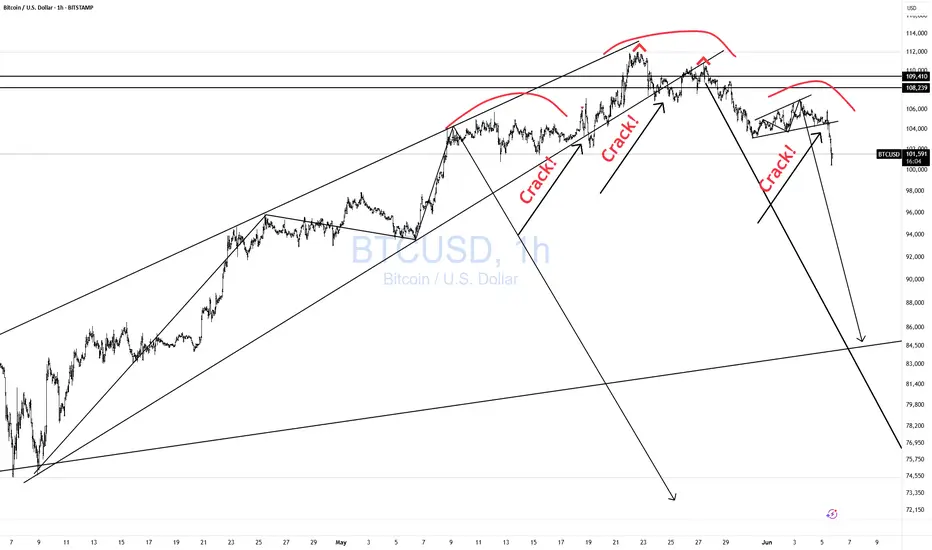
BTCUSD CRACKing Everywhere!As I have been warning for a while now. See previous post.
I first warned to wait for the CRACK!
Then we got the 2nd CRACK!, very normal.
Then a nice M pattern with a lower high.
Then another CRACK!
And now a right Shoulder.
MAGIC!
Now we wait for the H&S to break down.
Click boost, follow, and subscribe for more. Let's get to 5,000 followers. ))
BITCOIN About To Retake UPtrendWell....well...well Bitcoin is doing a beautiful job and is getting to the AREA and TIME where it will turn round to retake its UP trend direction and head towards the ATHs.
107500 to 106000 is the buying zone for SOPT to position and be ready for its next move .
Bears still have a few hrs left mark by the vertical red line (if not sooner) where they will start losing steam and bulls will start taking over.
Place your bets ladies and gentlemen , grab your popcorns and enjoy the ride.

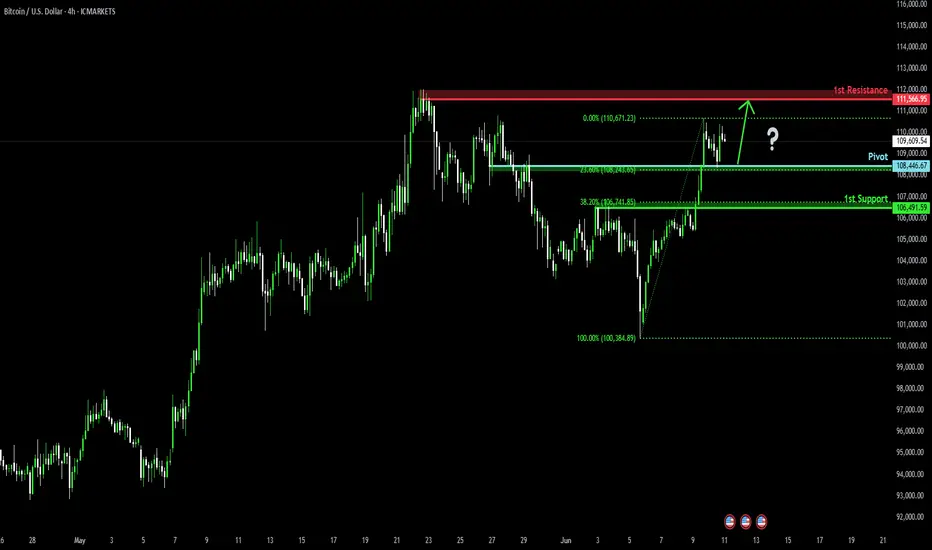
Bullish bounce?Bitcoin (BTC/USD) has bounced off the pivot and oculd rise to the 1st resistance.
Pivot: 108,446.67
1st Support: 106,491.59
1st Resistance: 111,566.95
Risk Warning:
Trading Forex and CFDs carries a high level of risk to your capital and you should only trade with money you can afford to lose. Trading Forex and CFDs may not be suitable for all investors, so please ensure that you fully understand the risks involved and seek independent advice if necessary.
Disclaimer:
The above opinions given constitute general market commentary, and do not constitute the opinion or advice of IC Markets or any form of personal or investment advice.
Any opinions, news, research, analyses, prices, other information, or links to third-party sites contained on this website are provided on an "as-is" basis, are intended only to be informative, is not an advice nor a recommendation, nor research, or a record of our trading prices, or an offer of, or solicitation for a transaction in any financial instrument and thus should not be treated as such. The information provided does not involve any specific investment objectives, financial situation and needs of any specific person who may receive it. Please be aware, that past performance is not a reliable indicator of future performance and/or results. Past Performance or Forward-looking scenarios based upon the reasonable beliefs of the third-party provider are not a guarantee of future performance. Actual results may differ materially from those anticipated in forward-looking or past performance statements. IC Markets makes no representation or warranty and assumes no liability as to the accuracy or completeness of the information provided, nor any loss arising from any investment based on a recommendation, forecast or any information supplied by any third-party.
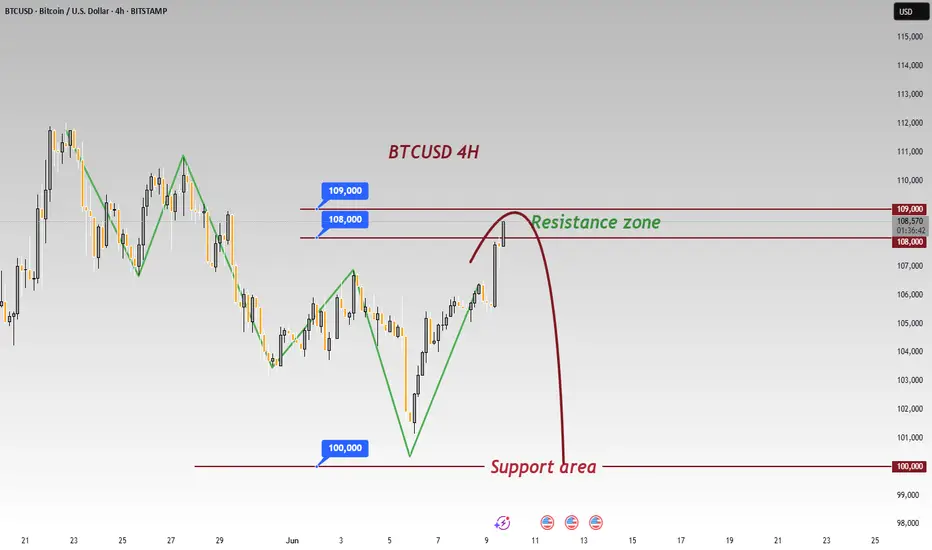
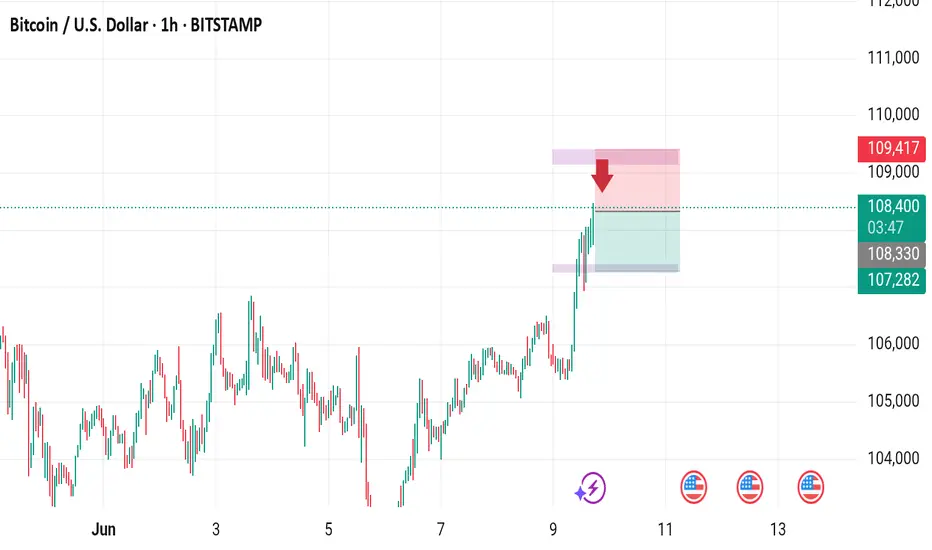
Shorting Opportunity EmergesBTC has seen significant volatility recently. 📊 After failing to break below 100,000 yesterday, it rebounded sharply to 108,500 immediately. ⚡ Now is precisely the opportunity to go short. 📉
⚡️⚡️⚡️ BTCUSD ⚡️⚡️⚡️
🚀 Sell@ 109000 - 108500
🚀 TP 105000 - 103000
Accurate signals are updated every day 📈 If you encounter any problems during trading, these signals can serve as your reliable guide 🧭 Feel free to refer to them! I sincerely hope they'll be of great help to you 🌟 👇
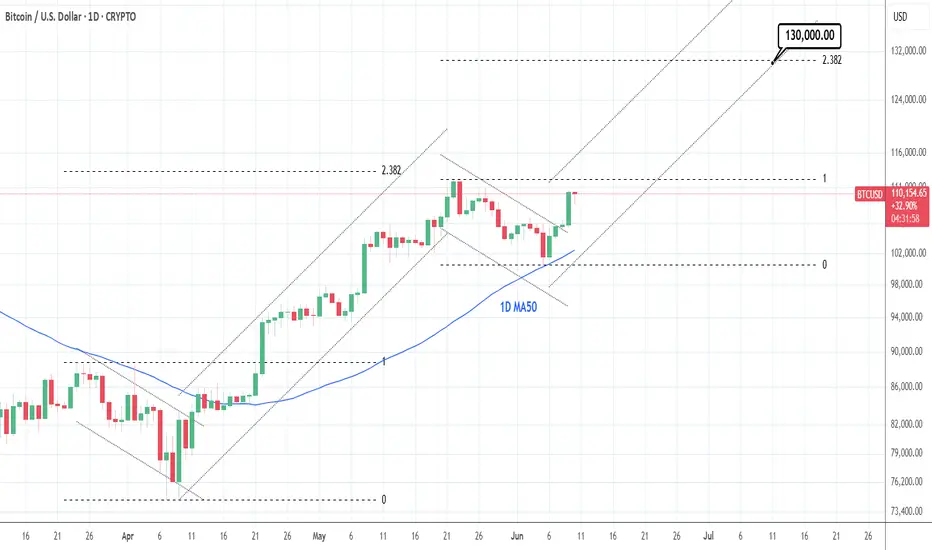
BTCUSD: Very aggressive rally to 130k has just started.Bitcoin turned bullish again on its 1D technical outlook (RSI = 61.233, MACD = 1503.700, ADX = 19.938) following yesterday's strong 1D candle, which is a result of the June 6th 1D MA50 rebound, and is even close to turning the day positive despite the correction early on. This rise is similar to the one that started after the April 7th rebound and eventually pearked just under the 2.382 Fibonacci extension. We remain bullish on Bitcoin, TP = 130,000.
## If you like our free content follow our profile to get more daily ideas. ##
## Comments and likes are greatly appreciated. ##
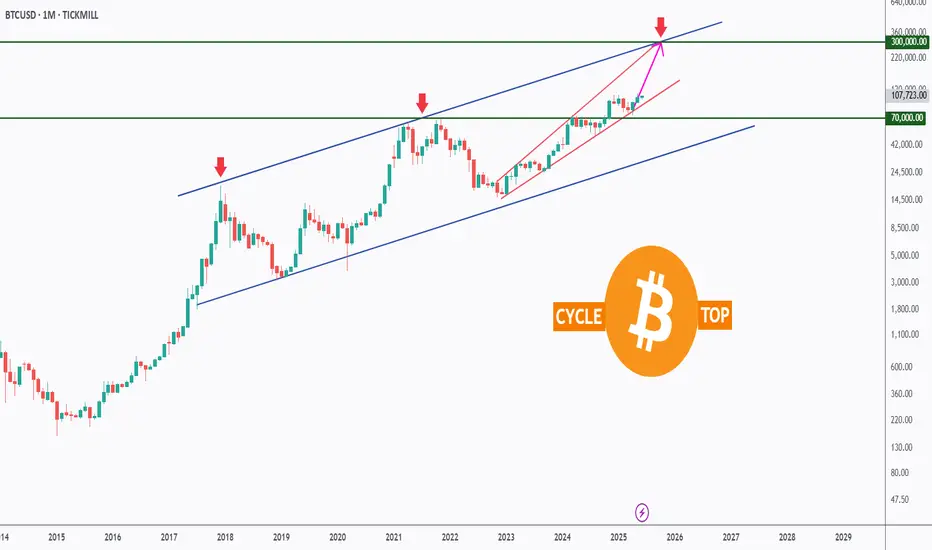
BTC Macro Cycle Outlook (Log Chart)Bitcoin continues to respect its logarithmic ascending channel that has defined every major bull and bear cycle since 2015. Each cycle top has historically aligned with the upper blue trendline, marked by sharp rejections (red arrows 🔴).
Currently, BTC is pushing within a steep short-term channel, mirroring previous parabolic phases. If the structure holds, we could see a final push toward the $300,000 zone, which aligns with the channel resistance — potentially marking the next cycle top.
📈 This chart captures the bigger picture — filtering out short-term noise and focusing on the rhythm of Bitcoin’s long-term cycles.
Do you think this cycle will end like the last two? Or are we in for something different?
All Strategies Are Good; If Managed Properly!
~Richard Nasr
₿ Bitcoin: SlippedAfter holding steady for two days, Bitcoin broke lower yesterday, confirming a setback within green wave B. This countertrend move delays the anticipated climb, which we still expect to reach its peak in the upper blue Target Zone (coordinates: $117,553 – $130,891). From there, bearish wave C should take over. The upper blue zone remains a tactical area for partial profit-taking or hedging long positions with shorts. Wave C is expected to drive the price sharply lower into the blue Target Zone (coordinates: $62,395 – $51,323), where we anticipate the completion of orange wave a. Orange wave b may trigger a corrective bounce, but ultimately, renewed downside should wrap up the intermediate correction of blue wave (ii). Still, there’s a 30% chance that Bitcoin forms a higher high as part of blue wave alt.(i)—temporarily breaching the upper blue zone.
📈 Over 190 precise analyses, clear entry points, and defined Target Zones - that's what we do.

MASSIVE NEW BREAKOUT - LiveMassive New Breakout in Bitcoin at Dual Resistance
Post with emojis:
🚨💥 Massive New Breakout in Bitcoin at Dual Resistance 📈🔥
Okay, time to revisit the BTC chart because we’ve just arrived at a crucial intersection that could define the next major move!
In our previous update, we anticipated a dip — and it played out perfectly. Using Fibonacci support, we entered long right at the sweet spot, just before a strong upward move that tested resistance levels.
And now... it’s official — BTC has just broken through that massive dual resistance! 🚀
This breakout pushes us back into the ascending channel, which had previously flipped to resistance. Two major technical levels — white and yellow zones — just got cleared in one explosive move.
What's next?
🔹 Monitor for a possible retest of the breakout zone
🔹 Eyes on the 113 key resistance — that’s the next likely magnet for price
🔹 For those already in longs (like me), it’s smart to take partial profits and trail stops 🧠💼
This is a textbook breakout structure, and we’ll need to watch volume and structure confirmation closely.
One Love,
The FXPROFESSOR 💙
Disclosure: I am happy to be part of the Trade Nation's Influencer program and receive a monthly fee for using their TradingView charts in my analysis. Awesome broker, where the trader really comes first! 🌟🤝📈

Bullish momentum to extend?The Bitcoin (BTC/USD) is falling towards pivot and could bounce to the 1st resistance.
Pivot: 108,446.67
1st Support: 106,491.59
1st Resistance: 111.566.95
Risk Warning:
Trading Forex and CFDs carries a high level of risk to your capital and you should only trade with money you can afford to lose. Trading Forex and CFDs may not be suitable for all investors, so please ensure that you fully understand the risks involved and seek independent advice if necessary.
Disclaimer:
The above opinions given constitute general market commentary, and do not constitute the opinion or advice of IC Markets or any form of personal or investment advice.
Any opinions, news, research, analyses, prices, other information, or links to third-party sites contained on this website are provided on an "as-is" basis, are intended only to be informative, is not an advice nor a recommendation, nor research, or a record of our trading prices, or an offer of, or solicitation for a transaction in any financial instrument and thus should not be treated as such. The information provided does not involve any specific investment objectives, financial situation and needs of any specific person who may receive it. Please be aware, that past performance is not a reliable indicator of future performance and/or results. Past Performance or Forward-looking scenarios based upon the reasonable beliefs of the third-party provider are not a guarantee of future performance. Actual results may differ materially from those anticipated in forward-looking or past performance statements. IC Markets makes no representation or warranty and assumes no liability as to the accuracy or completeness of the information provided, nor any loss arising from any investment based on a recommendation, forecast or any information supplied by any third-party.

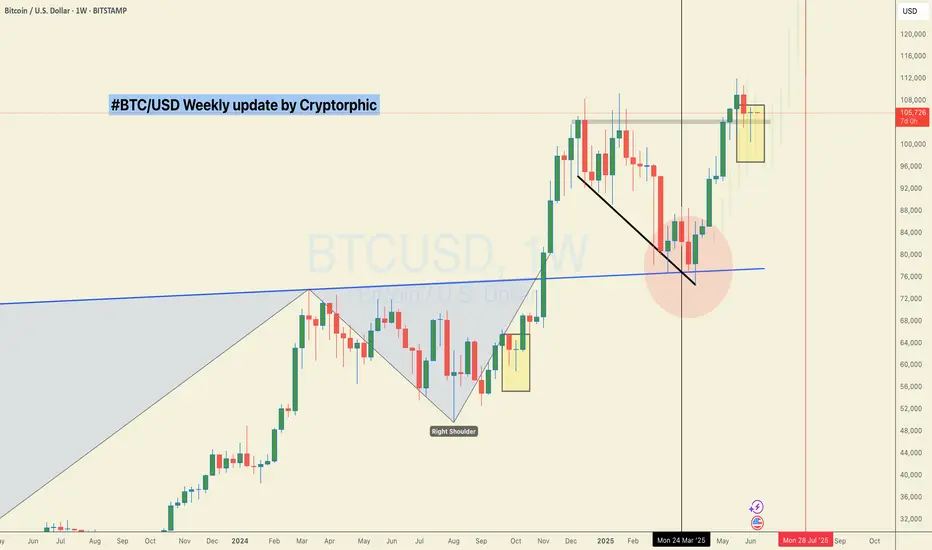
#BTC/USD Close Fight but bulls win! $117K Still in sight!CRYPTOCAP:BTC Weekly Update:
BTC closed the week up by just 0.08%, leaving behind a long wick and a tiny body, forming a Dragonfly Doji, one of the strongest candlestick patterns, signalling a fierce battle between bulls and bears.
✅ This time, the bulls won by a small margin, but a win is a win.
✅ BTC successfully held its key support.
✅ The CC is green, which is a positive sign.
The price action remains choppy, but the trend is still pushing upward from here.
Invalidation:- Weekly Close below $100k
What do you think?
Do let me know in the comments section. And please hit the like button.
Thank you
#PEACE
Cyclical Cluster Timing + Market Geometry for BTCThis setup is based on the confluence between price geometry and a cyclical cluster model. I’ve normalized the cycle intensity scale across all timeframes better to highlight high-probability timing windows for potential trend changes.
Tables are proprietary timing cluster models (freely accessible by request).

BTCUSD Enter point 108400 target 107400 stop loss 109200Let's break it down:
- Entry Point: 108,400
- Target: 107,400 (1,000-point gain)
- Stop Loss: 109,200 (800-point risk)
You're expecting BTCUSD to decline from 108,400 to 107,400. Risk-reward ratio looks decent!
Potential reward: 1,000 points
Potential risk: 800 points
Let's see how it unfolds! What's driving this bearish trend?
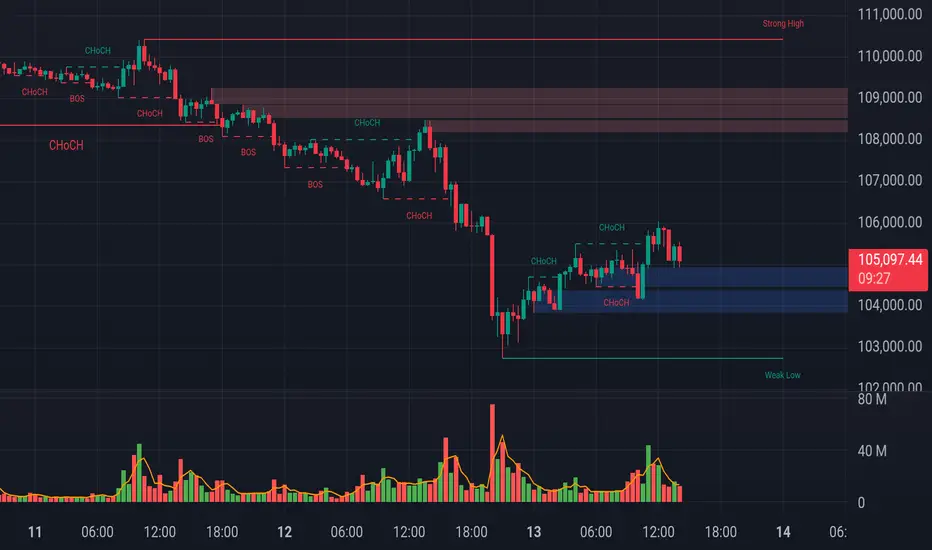
BTCUSD SHORT (SELL)🚀 Pair: BTCUSD
📉 Direction: Short (Sell)
🎥 Analysis:
BTC has recently broken its last M15 low, marking a Change of Character (CHOCH) in the market structure. This shift from bullish to bearish momentum signals a potential reversal or downside movement.
I’m expecting a retracement back up to a key supply/resistance area (such as a previous support turning into resistance) before price continues downward.
This view is supported by a clear inducement in front of the supply zone, lower low formation, and weak buying pressure on the pullback — all indicating sellers are currently in control.
🕹 Entry: Supply zone level
🎯 Target: Next major support or liquidity pool below.
🛑 Stop Loss: Positioned above the last lower high to manage risk in case the market reverses.

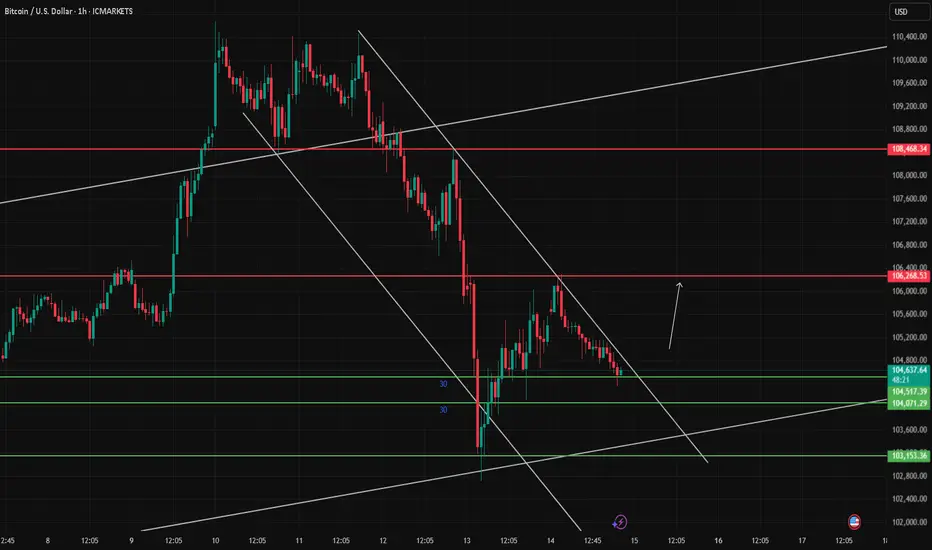
BTC/USD Approaching Key Decision Zone Within Bearish Channel
Bitcoin continues to trade inside a well-structured descending channel on the 1H chart. Price is currently consolidating around the support zone of 104,517 – 104,071. This area could act as a potential pivot point.
If bulls manage to break above the descending trendline, a move toward the 106,268 resistance level could develop. However, as long as the price remains within the channel, the bearish bias remains in play.
This idea focuses on observing price behavior near critical levels without offering direct trade signals. Always monitor volume and structure confirmation before making decisions.
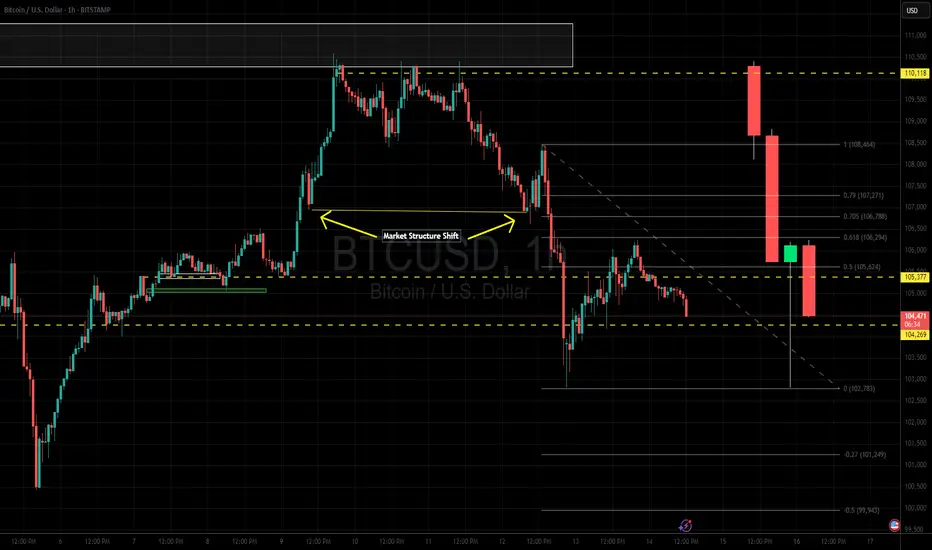
BTCUSD 1H levels updated 6/14/25I observe a market structure shift to the downside. Will it continue to the PDH?
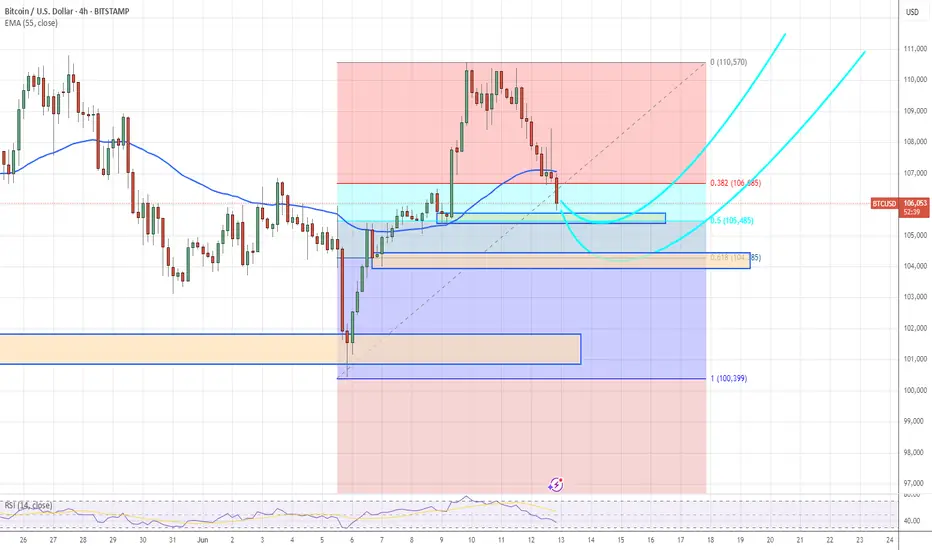
BTC 4-hour cycle bullish expectationsFocus on the point around 105000. This is the Fibonacci retracement of 50%, and it is also a demand area.
Observe whether there is a reversal signal, and try to buy.
Another important observation point is around 104200. This is the Fibonacci retracement of 61.8%.