BTC/USD: Weekend Strategy AnalysisBitcoin is currently fluctuating around $105,500, with volatility mainly driven by Middle East tensions.
After Israel's airstrikes on Iran, market panic spread, causing Bitcoin to drop below $103,000 yesterday. Over 250,000 leveraged investors worldwide were liquidated within 24 hours, totaling $1.16 billion in liquidations—predominantly long positions.
In the short term, geopolitical conflicts have triggered capital flight from high-risk assets. Traditional safe havens like gold and crude oil have surged, while Bitcoin has been sold off. Uncertainties over whether the Middle East situation will escalate or involve the U.S. are suppressing prices.
Long-term, institutions had forecast Bitcoin could reach $200,000 by the end of 2025 based on factors like the halving effect. Some listed companies and institutions maintain strategic positions. If the situation eases, prices may rebound.
BTC/USD
sell@106500-105500
tp:104000~103000
SL:107500
I am committed to sharing trading signals every day. Among them, real-time signals will be flexibly pushed according to market dynamics. All the signals sent out last week accurately matched the market trends, helping numerous traders achieve substantial profits. Regardless of your previous investment performance, I believe that with the support of my professional strategies and timely signals, I will surely be able to assist you in breaking through investment bottlenecks and achieving new breakthroughs in the trading field.
BTCUSD.PI trade ideas

Bitcoin the next store of ValueBitcoin as a store of value is not a new idea. I've been on this road a long time and my old posts are just timestamps of that.
Currently price is sitting on the Dec/Jan highs. It appears that which was resistance before could become support now.
The fact that the market reacts very fast to small market dips with fear seems like a good sign to me. Though only useful as an indicator in context. We did not break market structure and large buyers are still accumulating. Also retail interest stats like google search have not hit new all time highs. Though google specifically might be a bad metric as AI search is highly used now. There is still a risk of something breaking in US markets while rates stay up and Fed balance sheet is not growing. Though not clear what exactly would break. Kind of like stomping on an orange don't get caught up exactly where the peel breaks. QT is squeezing and you squeeze hard enough and pop. Even with them net buying 10 year US Treasury Bonds. It's still technically a QT environment. Last year bonds almost broke the banks before the Fed aloud those bonds to be listed full term value on the balance sheet. Effectively covering up the issue instead of fixing anything. (Bank Term Funding Program - BTFP)
Pros
Bitcoin has not yet rate seen US rate cuts
Bitcoin has not yet see a new wave of money printing
Fund managers suggesting 2% allocation which is no where close to being reached yet
Recurring institutional buyers, such as corporations adding Bitcoin to their balance sheets (e.g., Strategy).
Cons
Large leveraged holders will need to watch cash flows vs interest payments. In 2022 bear market this was easy for Micro Strategy now renamed Strategy. The reason profits were roughly 7x interest payments. In 2024 that has dropped to 5x. They started with a lot of cash flow and found themselves sitting on melting pile of cash. If Bitcoin holdings out grow the software income enough then finding the money for interest payments becomes a new challenge.
It's still not 100% clear long term how Bitcoin fits in a portfolio.
Most narrative seems like you keep it in a locked room where you celebrate your great
fortune that has no material benefits in your life. I think it's probably not that.
Is it just something people collect and lend against?
Act as a index for the greater crypto asset class that people rebalance?
Cash flow with cover calls?
Lend it out if Fiat fails it could act like gold being borrowed.
Important Questions:
What % allocation to Bitcoin makes sense to hold in a bear market?
How do you grow Bitcoin holdings in a bull market?
"This is not financial advice. These are my personal opinions and observations. Do your own research before making any investment decisions."

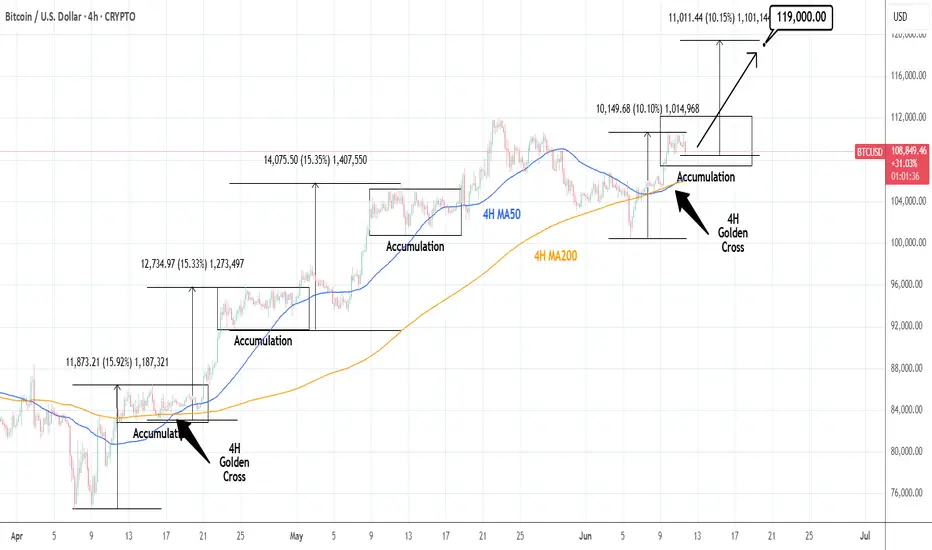
BTCUSD: 4H Golden Cross kickstarting $119,000 rally.Bitcoin remains bullish on its 1D technical outlook (RSI = 58.982, MACD = 1643.700, ADX = 1643.700) despite today's high volatility. This volatility displays similar attributes to the Accumulation Phases that were formed since the April 7th bottom. If it follows the symmetry of the first two bullish waves around the first Accumulation Phase, expect a +10% rise from the Phase's bottom. Assuming today is the bottom, the next target of this pattern is 119,000.
## If you like our free content follow our profile to get more daily ideas. ##
## Comments and likes are greatly appreciated. ##
Long-term bullish, but watch for retracements.Daily Chart (Long-term Trend)
Pattern Characteristics
- Closed with a small bullish candle yesterday, forming consecutive bullish candles. Price firmly stands above moving averages, with attached indicators maintaining a golden cross, clearly indicating a bullish trend.
Risk Warning
- Last week's sharp rally caused price to deviate from moving averages, creating technical demand for regression. Be cautious of retracement corrections. Key support level: $107,000 area. A break below may lead to further decline toward the moving average convergence zone.
Hourly Chart (Short-term Operation)
Intraday Trend
- After intraday retracement correction yesterday, weakness continued in the European session, and the US session rebounded at support but failed to break through the previous high. Today, price is under pressure with consecutive bearish candles, indicating short-term bearish dominance.
Key Levels
- Support: $108,300. A break below may test the $107,000 integer level.
- Resistance: $110,000 (previous high). Avoid chasing long positions before a breakthrough.
Trading Strategy Recommendations
Trend Traders
- Maintain a bullish tone. Consider batch long positions at the $107,000-$108,300 support zone, with stop-loss below $106,500.
Short-term Traders
- Focus on the validity of $108,300 support today. Lightly trade for rebounds and reduce positions near $109,500.
Risk Control
- Due to price deviation from moving averages, keep position sizes within 1/3. Avoid heavy positions before retracement stabilizes.
I am committed to sharing trading signals every day. Among them, real-time signals will be flexibly pushed according to market dynamics. All the signals sent out last week accurately matched the market trends, helping numerous traders achieve substantial profits. Regardless of your previous investment performance, I believe that with the support of my professional strategies and timely signals, I will surely be able to assist you in breaking through investment bottlenecks and achieving new breakthroughs in the trading field.
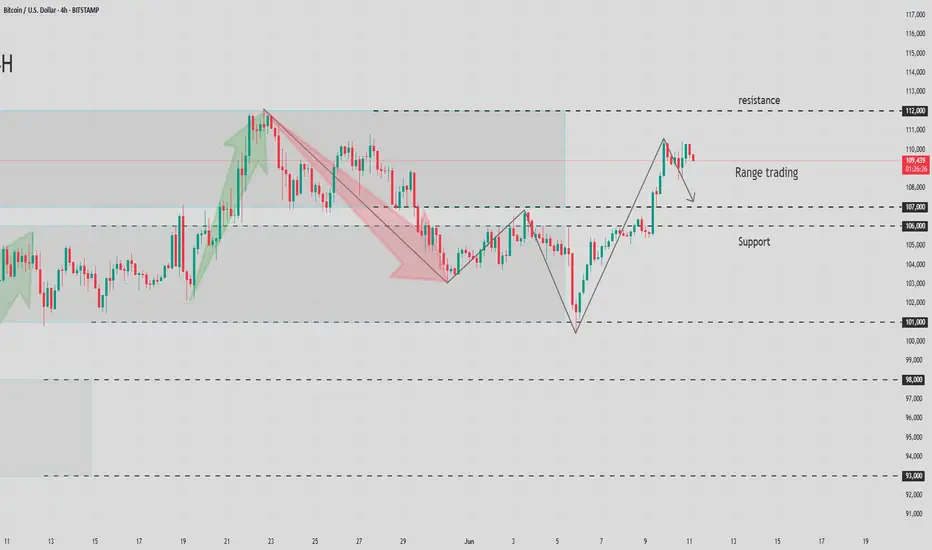
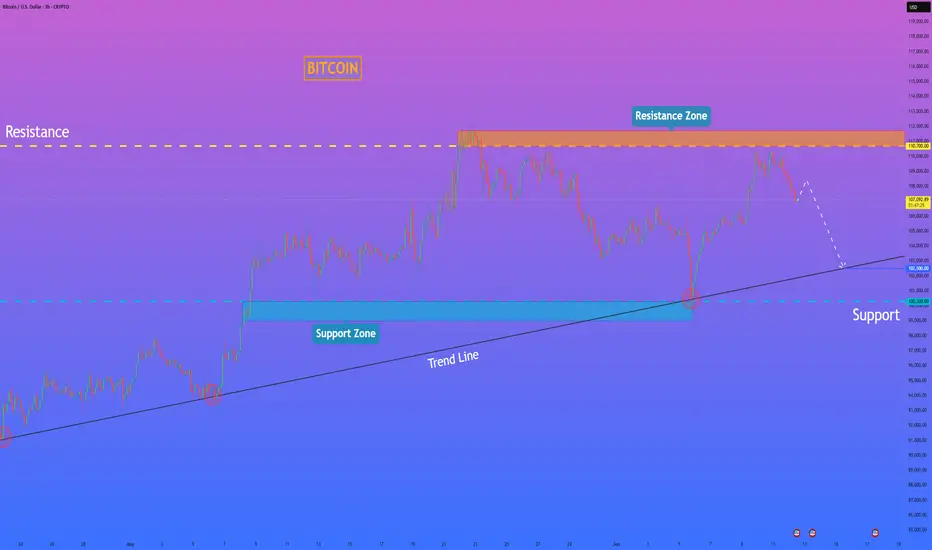
HelenP. I Bitcoin may continue to decline to trend lineHi folks today I'm prepared for you Bitcoin analytics. The chart began with a steady rising movement near the trend line, where the price consistently respected upward support and showed healthy momentum. After each test of the trend line, BTC managed to rebound strongly, confirming this level as dynamic support. One of the key reactions came when the price bounced from the 100300 zone, forming a solid base and continuing its bullish leg toward the resistance area. However, buyers lost momentum after breaking through intermediate support levels and reaching the resistance zone between 110700 and 111700. This resistance zone acted as a ceiling, halting further upside and triggering a local reversal. Since then, the price has been gradually retreating, printing lower highs and showing early signs of weakness. Currently, BTCUSDT is retracing, and the structure suggests that the market is leaning toward another test of the trend line. Given the previous reactions and technical setup, I expect the price to pull back toward the 102500 points, which aligns closely with the trend line. That’s why my current goal is set at this zone. If you like my analytics you may support me with your like/comment ❤️
Favorite Fibonacci ChannelI posted about the Fibonacci Channel I regularly use to set my stop loss, mean reversal TP, and breakout TP. It's typically 0.5 for a mean reversion, and the breakout is typically confirmed with a strong move past the 1.27 or -0.27 threshold, with 1.88 as the expected move and Euler's e and Pi as the followed profit targets. The vice versa is true for negative Tp below the zero line. I trade it as low as the 1-minute time frame to as high as weekly, as it works very well, especially when it's preparing a squeeze.

BITCOIN ATH INCOMINGI want us to fill these imbalances. Not just wick them or graze them, but truly fill them. Sit in them. Let price spend time there.
Because time inside inefficiency is what gives others the chance to participate. It creates space for real transaction, not impulsive chasing but deliberate positioning.
Ideally, I want to see price return to the imbalance in discount, a zone where price is considered cheap. That’s where buyers are most willing to step in. That’s where the opportunity lies.
From there, I want to see a weekly body close inside the imbalance. Not a shallow reaction, but commitment. That confirms intent. Then we move, continue the bullish orderflow, and leave a fresh daily imbalance behind.
We’ve seen this play out before. In the example we studied, price initially wicked into the imbalance, then came back and raided the low. That second move was the invitation. It gave the market time to transact. You could clearly see volume building, buyers stepping in, and the imbalance being filled with purpose. Only after that did we get the explosive move to the upside. Not before. The strength came after the market gave participants time to load up.
Now, there is a top-side scenario on the chart where price could continue higher and form an imbalance above first. If the market is truly bullish, that’s possible, but it isn’t my preference. I’d rather see price reload deeper, offer value, and then expand.
The roadmap is simple: return, fill, confirm, and climb.
This isn’t just bullish continuation. This is controlled, calculated momentu
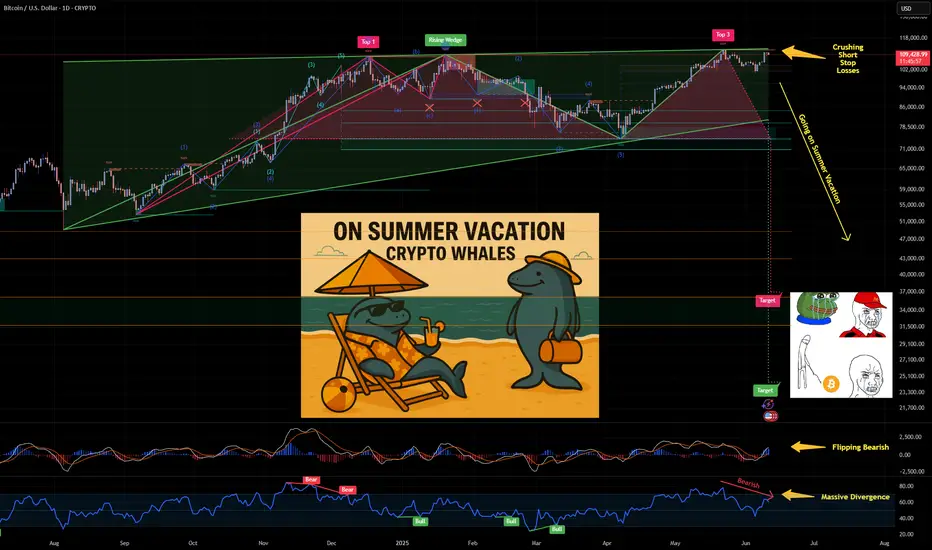
Bitcoin Whales Going On Summer Vacation🚨 Wake Up, Crypto World! 🚨
🔹 Bernstein calls $200K 🔹 CNBC eyes $130K 🔹 BlackRock boasts IBIT is the fastest-growing ETF 🔹 Saylor claims $1M BTC 🔹 Thiel-backed crypto exchange Bullish - has confidentially filed for a US IPO …
Does this sound like "Institutions secretly acquiring Bitcoin"?
NO. This sounds like a desperate call for exit liquidity.
The real accumulation already happened, behind closed doors, away from the headlines. Now they need buyers. Retail FOMO is their exit strategy.
Don't be fooled enjoy the Summer Vacation. 🌴
#Bitcoin #Crypto #ExitLiquidity #MarketCycles #TakeProfits
CRYPTO:BTCUSD INDEX:BTCUSD TVC:GOLD TVC:SILVER NASDAQ:COIN NASDAQ:MSTR
BTC/USD Potential Rebound from Key Support Towards 106,268Bitcoin is currently testing the 104,895 support level after a sharp decline from the upper resistance at 108,468. The price action suggests potential stabilization above this key support zone. If the 104,895 level holds, we may see a bullish move targeting the resistance at 106,268, which aligns with previous price rejection zones.
This area could act as the first profit target for intraday traders. A successful break above 106,268 could open the path for a retest of the 108,468 resistance level.
However, if the price fails to hold above 104,895, the next critical support lies at 103,153, where we previously saw strong bullish momentum. This would be the invalidation zone for the long setup.

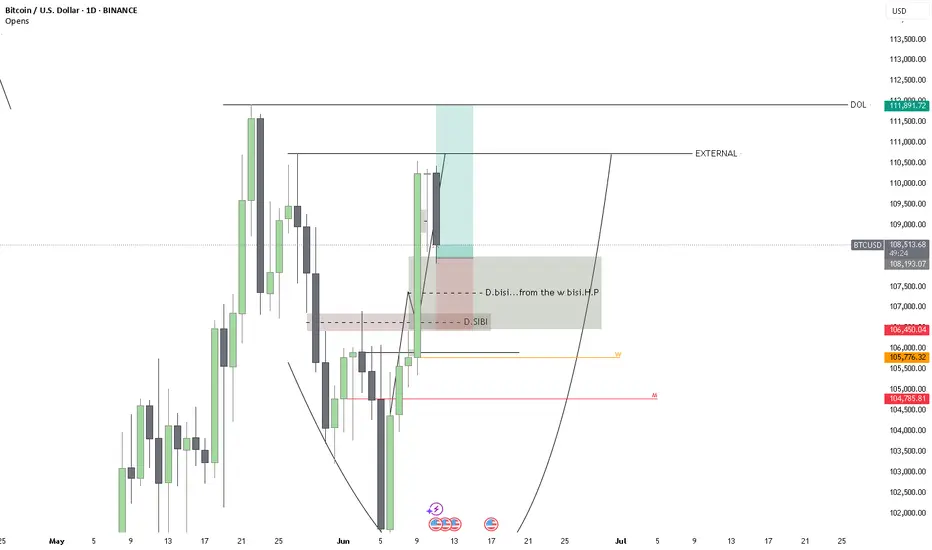
BTC LONG ANOTHER ONE another one !
btc long frm daily bisi wait confirmation ( 1h BISI OR 4H )
TARGET ath
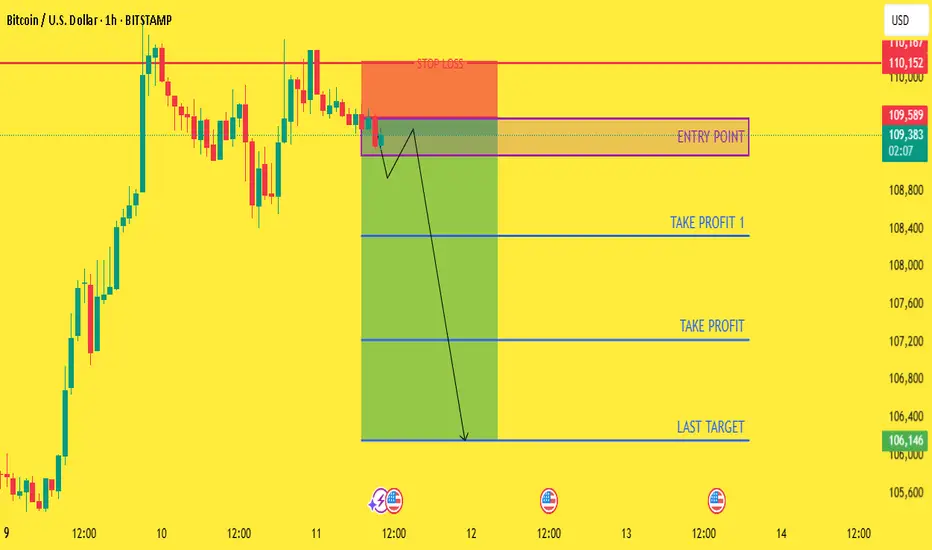
CHECK BTCUSD SIGNAL READ CAPTAIN Entry: around 109565/109168✅
Take Profit 108315✅
Take Profit 2: 107212✅
Last Target: 106148✅
Stop Loss: 110142❌
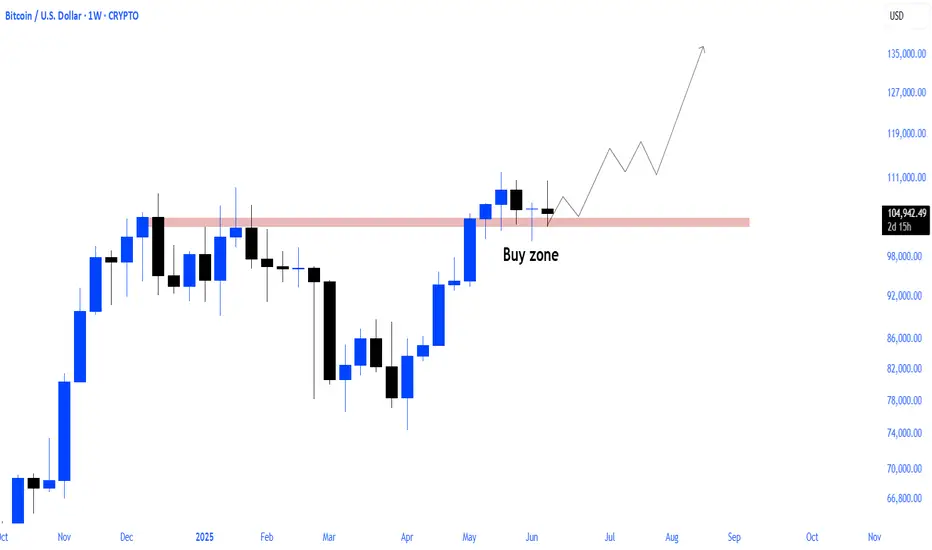
btc weeklyCRYPTOCAP:BTC will literally unleash explosive power
pullbacks serve as a force for the next upswing
BTC Liquidation Setup Before the Move?Wedge formation on BTC looks complete.
We could see a liquidation sweep through the 95K zone — clearing late longs and fueling sentiment — before the real bullish breakout begins.
This dip may just be the setup. Eyes on the reaction. 🔥
Gold $4,000 - BTC $120,000Gold at $4,000 an ounce and Bitcoin at $120,000
It may take time or there may be a temporary price correction, but reaching this price is on the way for these two assets.
Sasha Charkhchian
BTC SELL IDEAWe are seeing price pull back to a HL - mitigation happened on lower time frames. We entered a sell after our previous ctl broke on 1st entry then got stopped out. We drew another trend line & price seems to be breaking clean only risking 0.8%. Learning how to control my sizing when coming across these types of ideas, price hit .618 fib level & is now getting ready to head down to 100k - even 90k depending on how price unfolds.

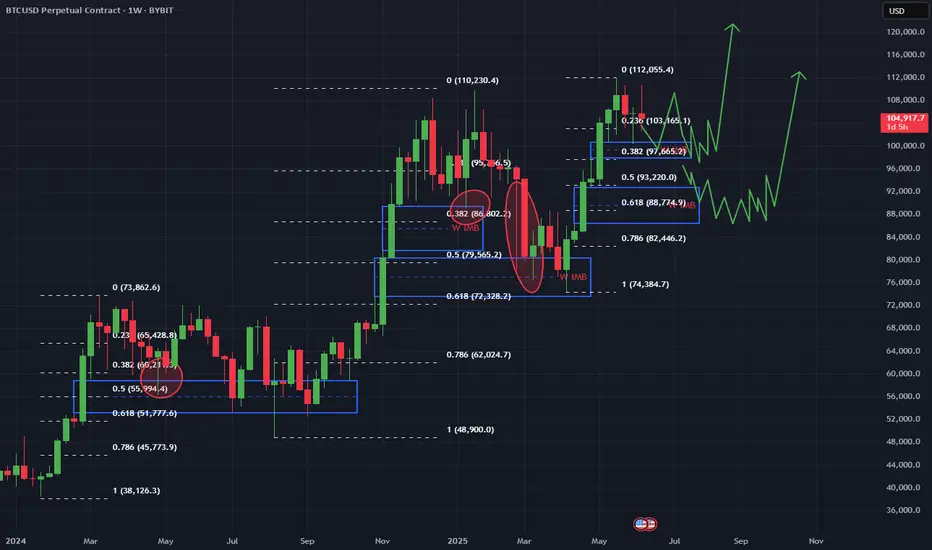
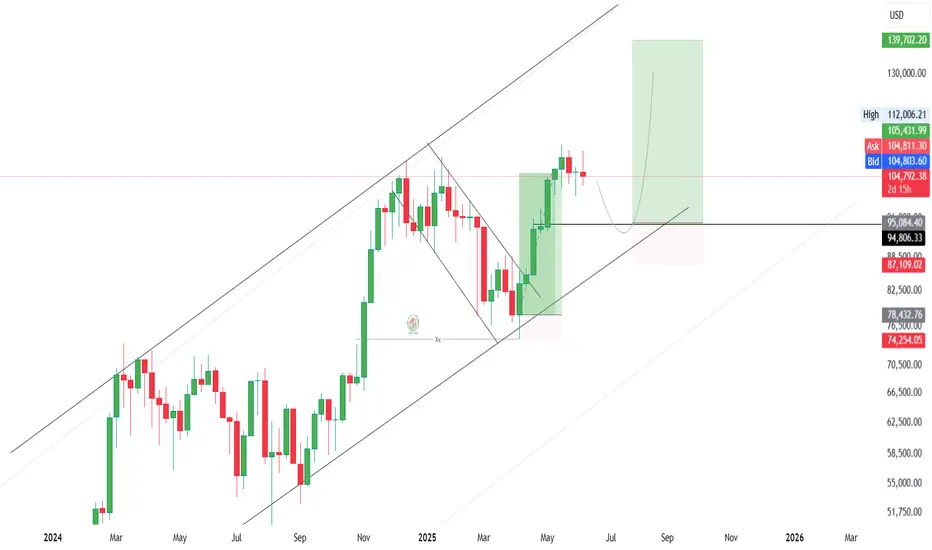
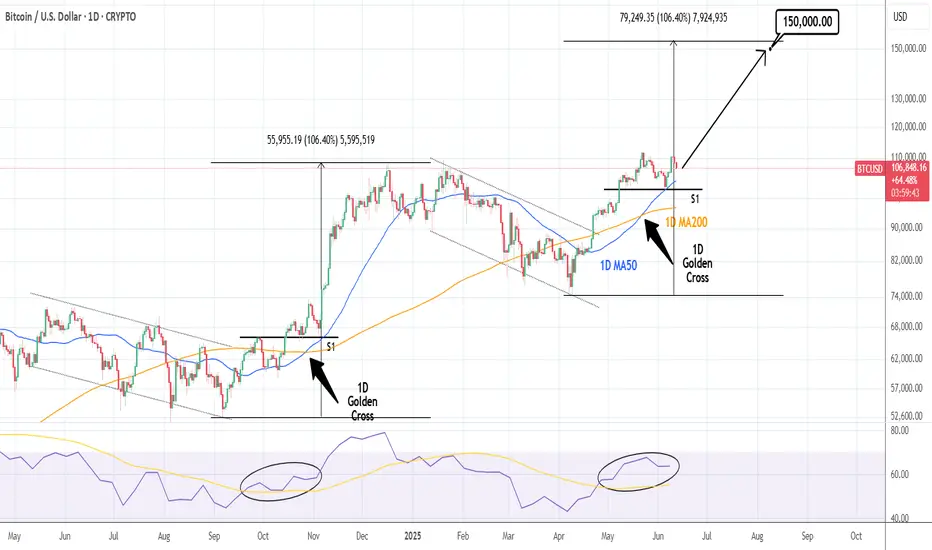
BTCUSD: Can it repeat the U.S. elections rally?Bitcoin is on a slight pullback, being only marginally bullish on its 1D technical outlook (RSI = 56.024, MACD = 1611.500, ADX = 23.439). Based on the 1W RSI we may be on the October 30th - November 4th 2024 pullback that preceded the U.S. elections. The decisive test will be on the 1D MA50 again, but as long as the S1 level holds, chances are we will see a similar +106.40% rally. We remain bullish on BTC, TP = 150,000.
## If you like our free content follow our profile to get more daily ideas. ##
## Comments and likes are greatly appreciated. ##
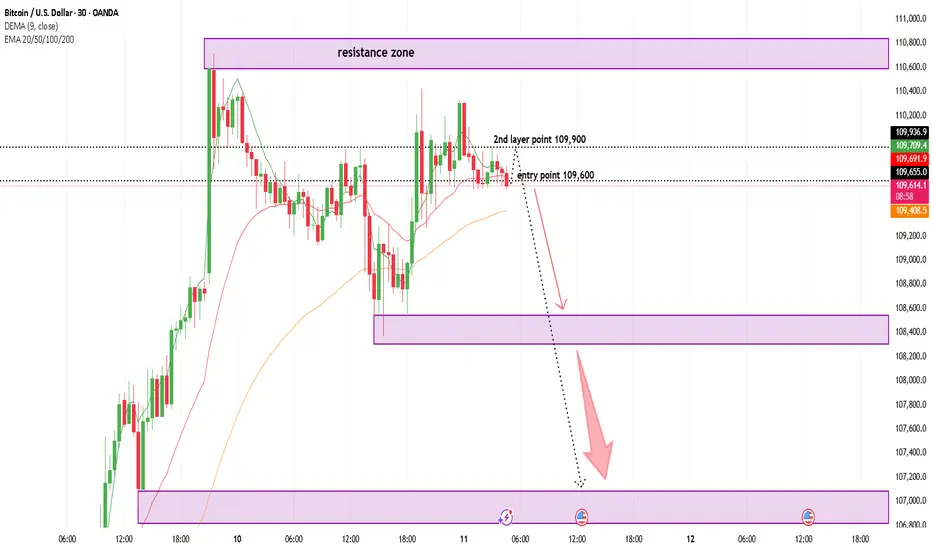
BTCUSD Trade Alert – SELL NOW Entry Point: 109,600BTCUSD Trade Alert – SELL NOW
Entry Point: 109,600
🎯 1st Target: 109,000
🎯 2nd Target: 107,000
🎯 Final Target: 105,000
📉 BTC showing signs of downward pressure
📊 Resistance zone forming near 110K
🔻 Momentum shift favors short setups
💼 Potential for high reward with smart execution
🧠 Risk Management is Critical
📍 Suggested Stop-Loss: Above 110,500
⚖️ Risk only what you can afford to lose
🔒 Never skip setting SL and TP
🧭 Be patient — don’t force the trade
⏱️ Let the setup confirm before execution
📌 Protect profits as you move toward targets
📊 Trail your SL as price moves in your favor
🚫 No overtrading — stick to the plan
✅ Stay focused, stay disciplined
📢 Trade the chart, not the hype!
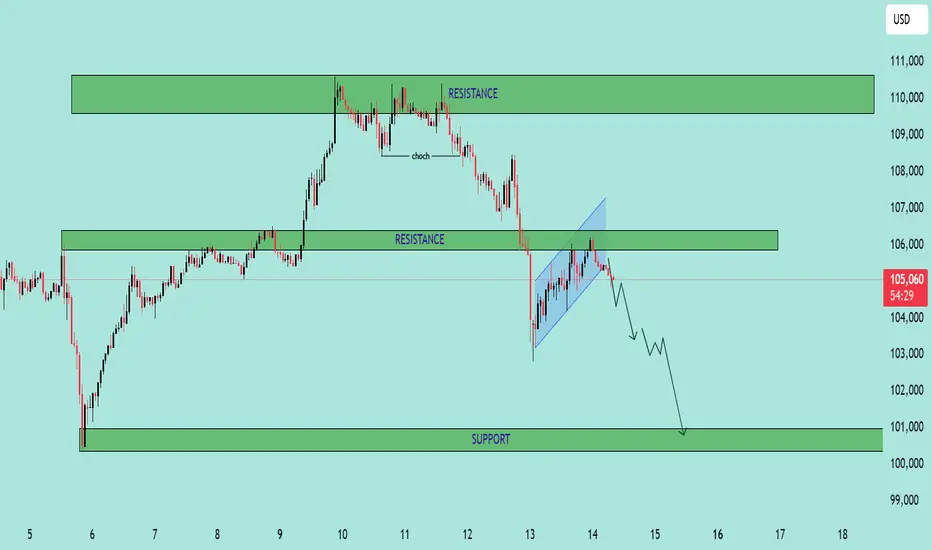
BTC/USD – Bearish Continuation from Rising Channel BTC/USD – Bearish Continuation from Rising Channel 🚨🧱
This chart indicates a bearish market structure with the following key technical features:
🔍 Chart Analysis:
Change of Character (CHoCH) 🔄
A shift from bullish to bearish was confirmed by a strong breakdown after the CHoCH marked at the top.
This breakdown invalidated previous bullish structure.
Bearish Flag Formation 📉📐
After the impulsive drop, price formed a bearish flag (rising channel), suggesting a potential continuation move to the downside.
Resistance Rejection 🚫
Price is currently testing and rejecting the 105,800–106,500 resistance zone, previously a support turned resistance.
The rejection from this level adds further bearish confluence.
Downside Projection ⬇️📍
If the pattern plays out, the projected move shows a potential drop toward the major support zone at 100,000–101,000.
📌 Key Levels:
Resistance Zones:
105,800–106,500 🧱
109,500–111,000 🧱
Support Zone:
100,000–101,000 💚
🧠 Conclusion:
The chart suggests that BTC/USD is in a bearish continuation phase, with strong rejection from key resistance and a confirmed breakdown from a bearish flag. Traders should watch for confirmation of continuation below 104,500 to target the 100k support level. Risk management is crucial near volatile zones.
BTCUSD downtrend started alighning broad fall in equiti marketBTCUSD downtrend started alighning broad fall in equiti market
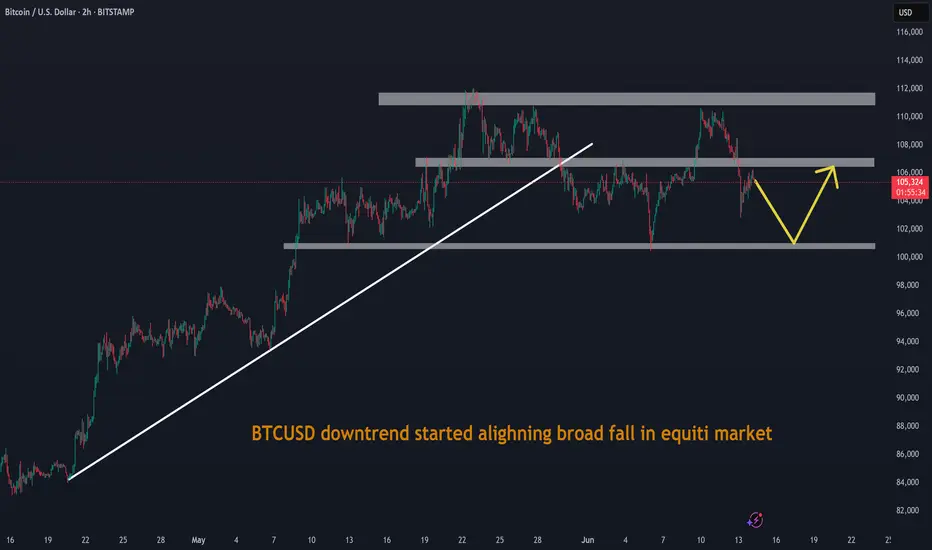

Bitcoin Short: Wave CAfter a 6-days move up after we have hit our target in the previous analysis, I think Bitcoin has completed what I think to be the Wave B and is already on the Wave C run down.
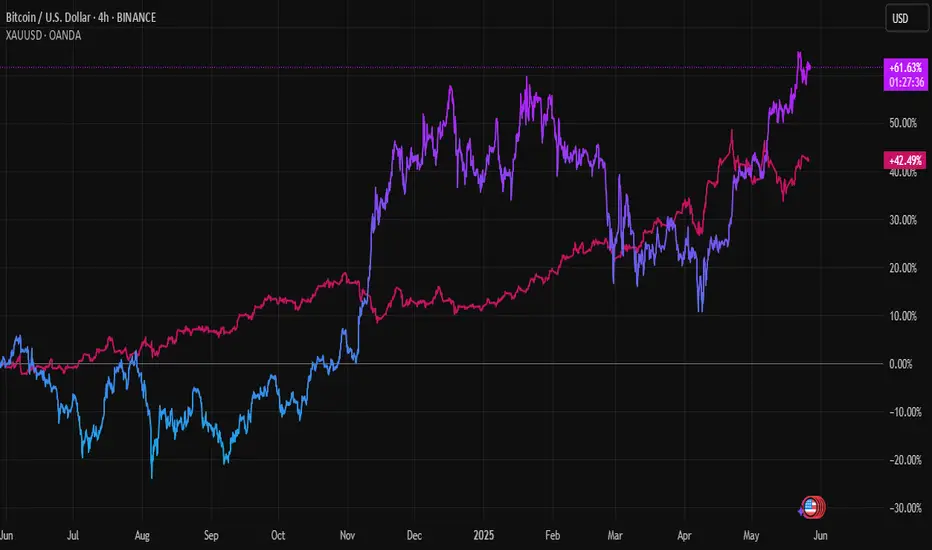
Over in this video, I expressed my personal viewpoint that Bitcoin is not a hedge against the dollar and that it is actually a risk-on/off product more similar to the equities markets like the S&P500. I recommend that anyone who is interested to perform a study on the correlation and beta Bitcoin.
I suggested that the reason why it more closely related to the equity markets is due to it's deep integration within the financial sector (e.g. ETFs, structured products from banks).
Given that I think that the equity markets are primed to crash soon, I think that Bitcoin will follow suit.
Good luck!

I offer no apology for understanding how it ends.Price and volume are the only honest signals in a system built on distraction. Everything else—news, sentiment, narratives—is lagging and often deceptive. The masses react to what has already happened. By the time they feel certainty, the opportunity is gone.
You buy when the market feels empty, when there's no applause, when doubt is thick. You sell when confidence is universal—because that’s when risk is highest. Most people move with the crowd. But the edge is in reading what the crowd hasn’t noticed yet.
Volume reveals intent before price confirms it. It's the pressure building before the break. But even then, timing is rarely comfortable. The right move often feels wrong in the moment.
If it feels safe, you're probably late. If it feels foolish, you’re probably early and that’s exactly where advantage lives.

BTCUSD CONSOLIDATING AT SUPPORT LEVEL $108192After BTCUSD Made ATH 112320 last month with correction to 101567 then push back to 110326 we can see the price finding 110245 as a major Resistance level a pullback to 108567 shows a strong ranging between 108200 to 110245, with current price trading at 108532,if the support hold strong we can see the price wrestling to 110455
