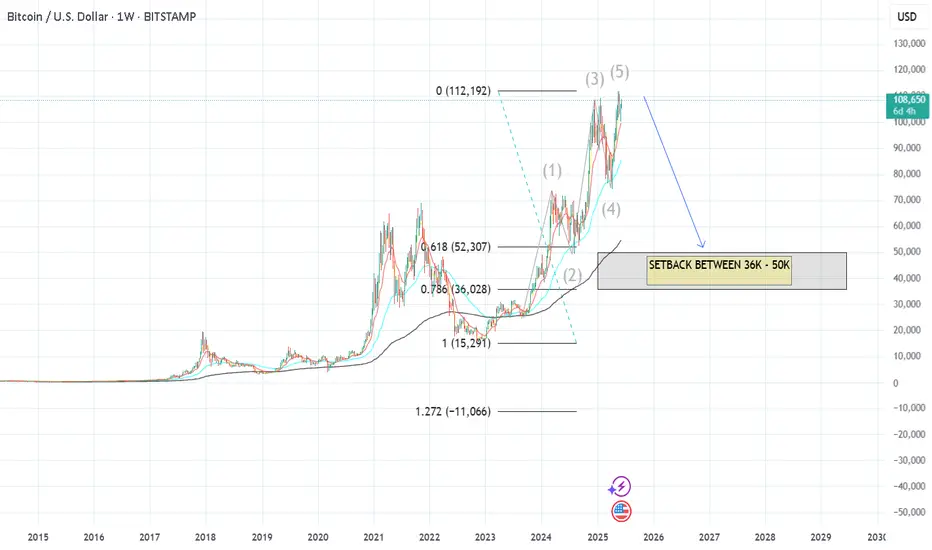
BITCOIN WEEKLY WYCKOFF — DISTRIBUTION OR REACCUMULATION?BTC has formed a textbook Wyckoff structure on the weekly chart — but are we entering Phase D markdown, or is this just a trap before continuation?
📉 Distribution Case (Primary Bias):
BC → UT → UTAD clearly defined
Bearish RSI divergence at UTAD confirms momentum exhaustion
Volume drying up = weakening demand
🎯 Targeting the 0.618–0.66 fib zone near 87k–89k, confluence with previous structure
🧠 Reaccumulation Possibility (Alternative Scenario):
Structure also mimics Reaccumulation Schematic #2
If support at 101k–104k holds and price reclaims 112k with strong volume → UTAD may prove to be a SOS, not a trap
⚠️ Levels to Watch:
🔺 UTAD: 112,087
🔸 BCLX: 108,496 → structural pivot
🔻 AR: 92,160 → distribution confirmation if lost
🎯 Target: 89,050 – 87,206 (fib + horizontal confluence)
🟠 Final invalidation for reaccumulation: weekly close below 87k
Whether we’re heading for Phase D markdown or one final shakeout before markup, this structure will define BTC’s path for the coming months.
Bias: Bearish unless price reclaims UTAD with strength.
Conviction: Grows with breakdown + volume spike under 101k.
BTCUSD.PI trade ideas

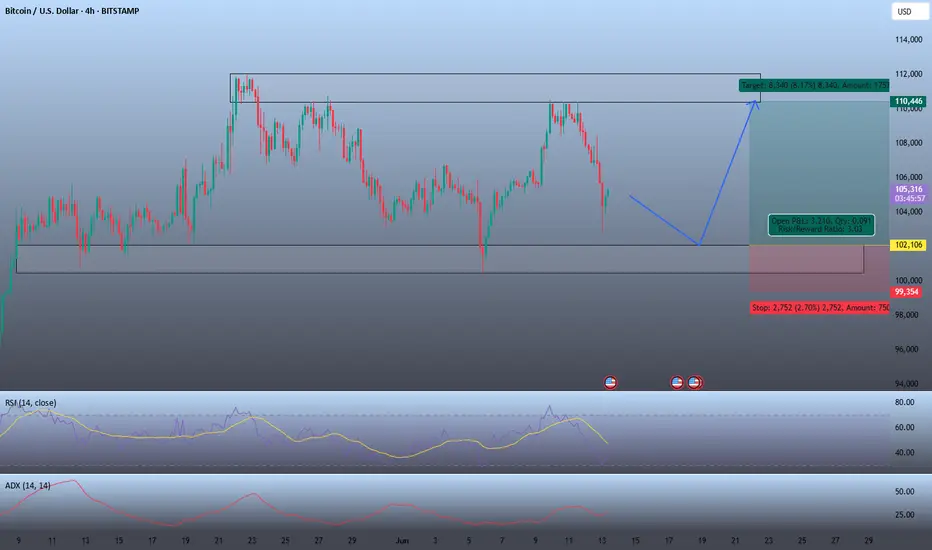
BUY OPPORTUNITYBTC/USD Trade Signal
Entry: $102,100
Stop Loss: $99,350
Take Profit: $110,446
Time Frame: 4H
Technical Analysis:
Price is currently rangebound between $102,100 and $112,000. Entering at the support level of $102,100 offers a favorable risk-reward ratio of approximately 1.3. The RSI is at 35 and facing downward, suggesting a potential rebound that could drive a rally toward local resistance. Additionally, the ADX reading of 27 indicates a moderate trend, which supports this trade setup.
Fundamental Analysis:
The preliminary University of Michigan Consumer Sentiment report is scheduled for release today, which is expected to provide positive market momentum, further supporting the bullish outlook.
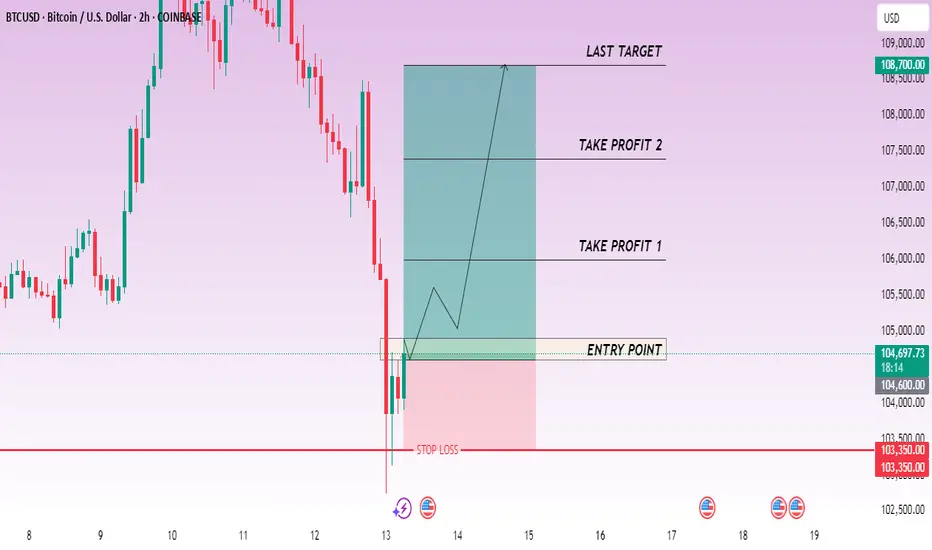
CHECK BTCUSD SIGNAL READ CAPTAINbtcusd buy now ✅
entry point (104900) (104600)
TAKE PROFIT 1: (106000)
TAKE PROFIT 2: (107400)
LAST TARGET (108700)
STOP LOSS (103350)
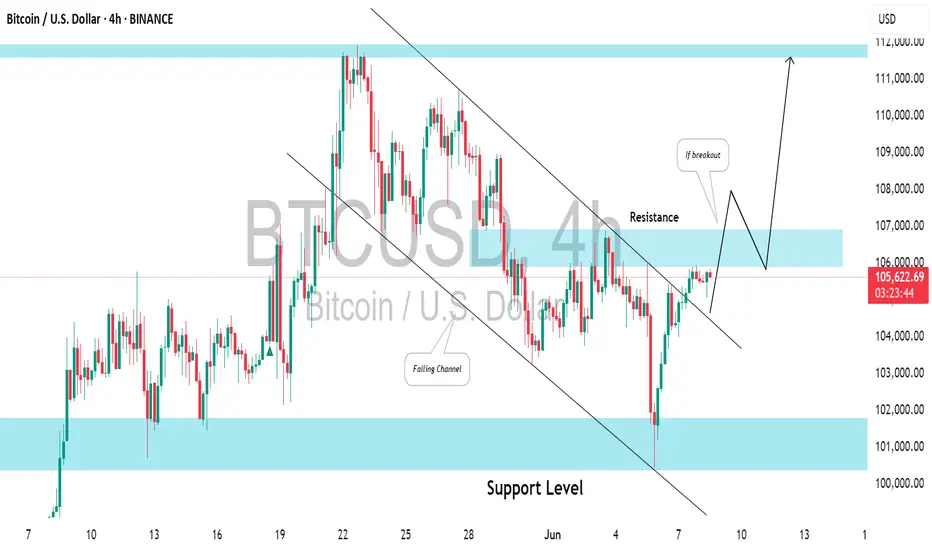
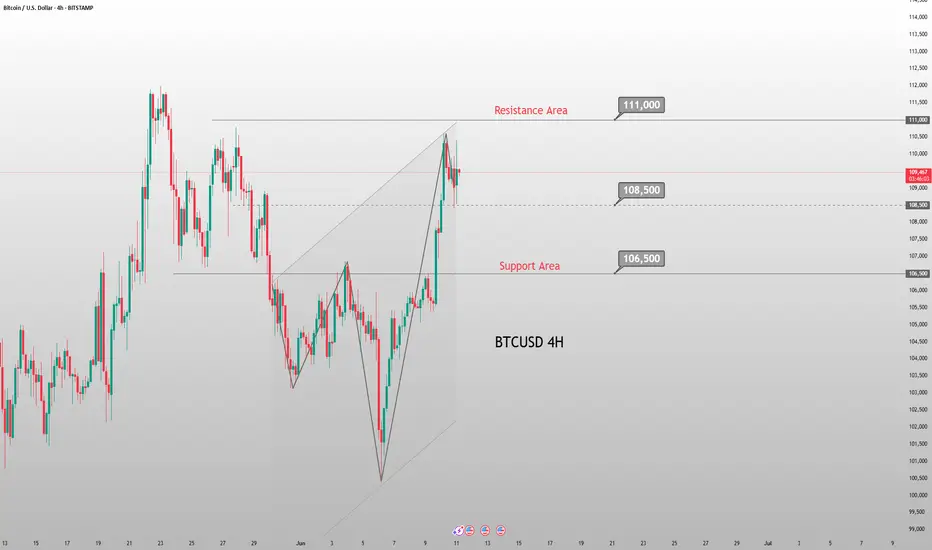
BITCOIN (BTCUSD): Waiting For BreakoutIt appears that ⚠️Bitcoin is gearing up for a bullish trend.
Analyzing the 4H time frame, I spotted a bullish flag pattern and a confrimed breakout of its upper boundary.
The final hurdle for buyers is the resistance level between 105,880 and 106,934 on the 4-hour chart.
A successful break and close above this range would signal a significant bullish indication, potentially leading to a continuation towards at least 111,500.
Market Moves Ahead? | DXY, Gold, and Bitcoin 📊 The markets are on edge—and this week’s economic data could trigger major moves in the US Dollar Index (DXY), Gold (XAU/USD), and Bitcoin (BTC/USD).
In this video, we break down:
✅ The latest CPI inflation expectations
✅ Fed interest rate outlook and Trump’s pressure on rate cuts
✅ U.S.–China trade negotiations and what they mean for global risk sentiment
✅ Technical levels to watch for DXY, Gold, and BTC
✅ Key events to watch this week (CPI, PCE, Fed speeches)
Whether you're a trader, investor, or just market-curious, this analysis will keep you one step ahead. 🧠💹
🔔 Don’t forget to like, comment, and subscribe for real-time market insights!
#DXY #XAUUSD #BTCUSD #Inflation #GoldPrice #BitcoinNews #FedWatch #MarketUpdate

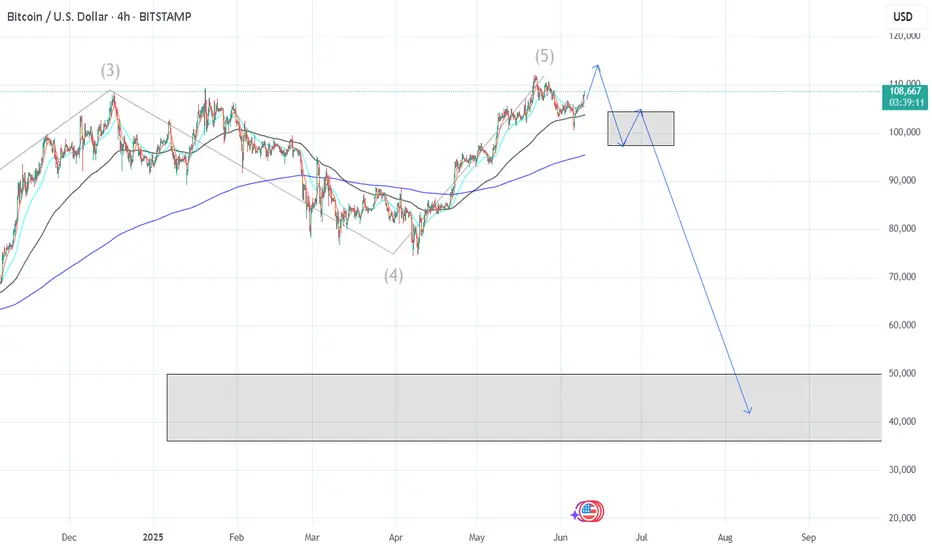
BTC: Elliot Cycle AnalysisA simple Elliot wave analysis of BTC's cycle. I predict we top out between 140-190k, before entering a bear market that will last ~12 months, likely ending early 2027. I can imagine that we form a massive H&S before we decline.
I believe the widespread adoption of crypto, BTC reserves, ETFs, etc. will serve as a bulwark against too harsh a winter. We perhaps drop to the 56k support, which would be an excellent buy-back opportunity.
Prepare to exit the market and remain tethered up for about a year or so. Don't get greedy. Things are gonna heat up real soon for the broader market.
Happy trading,
Melonfarmer

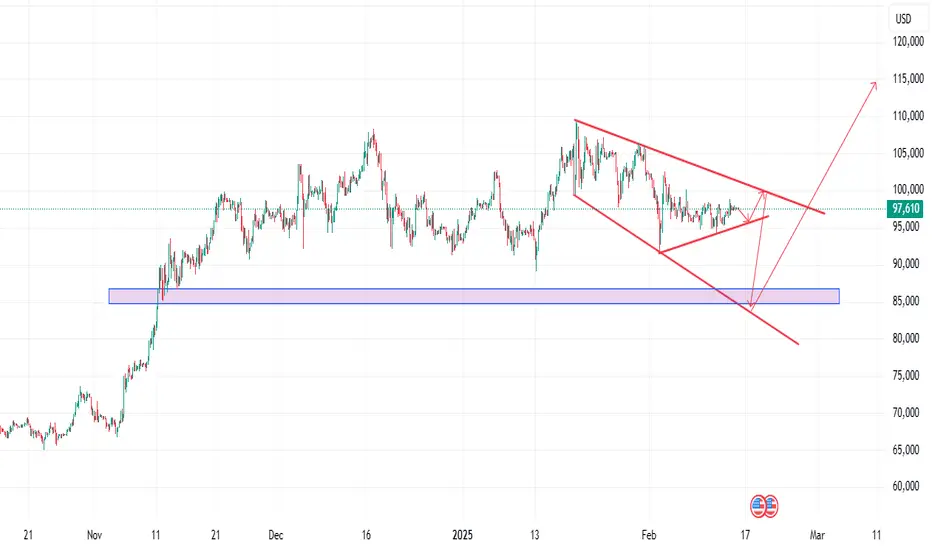
Nice bearish signal for BTC/USDFrom the chart you will understand that btc/usd is still consolidating for long bitcoin run, but before we are expecting a short term daily bearish run.
You can see that chart is forming a falling wedge pattern, which is also a good signal for bear movement before the long term bitcoin booooooooooooooooooom.
This will be a nice signal for you if you trade caution.
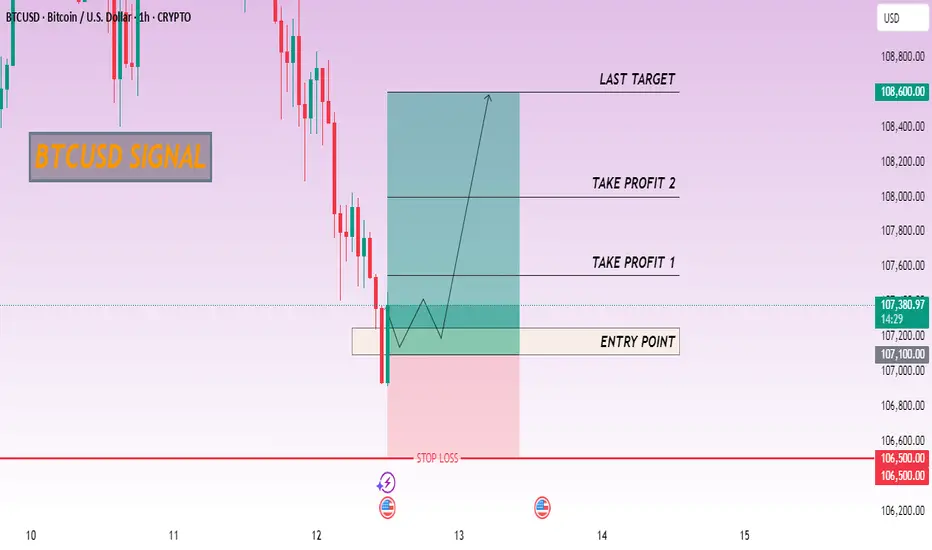
CHECK BTCUSD SIGNAL READ CAPTAINbtcusd buy now ✅
entry point (107250) (107100)
TAKE PROFIT 1: (107550)
TAKE PROFIT 2: (108000)
LAST TARGET (108600)
STOP LOSS (106500)
$BTC(Bitcoin) Target Acquired: Pre market update - June 12, 2025Hello fellow gamblers,
If you've been following the analysis, we were expecting an ABC retracement towards that FVG gap and we are finally there.
- Levels to watch: 110.5k, 108k, 106.8k, 104.3k

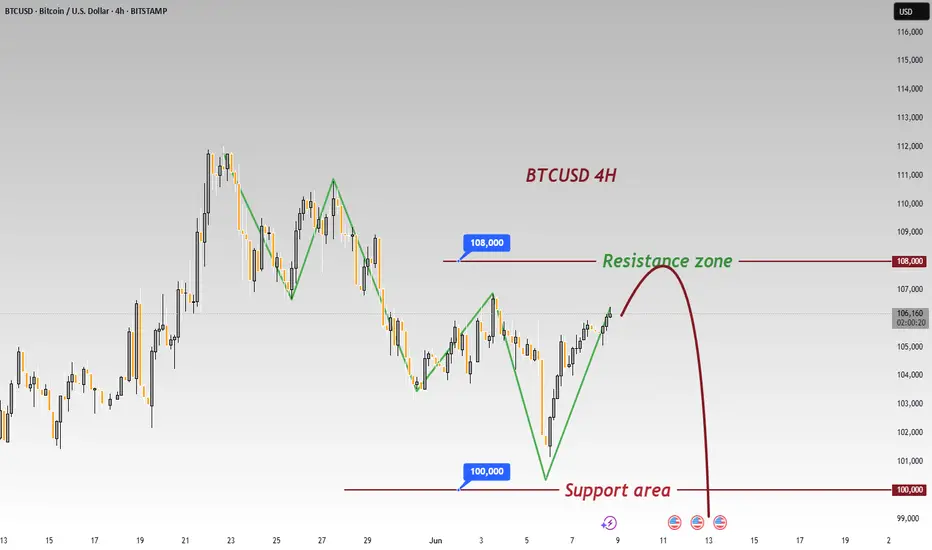
BTC Bears Eye 100000 Break; Short at 107000 -108000 ResistanceBTC's downward movement failed to break through 100,000📉, but there is a clear downward trend, and breaking below 100,000 is only a matter of time⏳. In the short term, shorting at high levels can be considered📉. The upward resistance currently has difficulty breaking through 110,000🚧, and shorting can now be considered in the resistance range of 107,000-108,000📉
⚡️⚡️⚡️ BTCUSD ⚡️⚡️⚡️
🚀 Sell@ 107000 - 106000
🚀 TP 102000 - 98000
Accurate signals are updated every day 📈 If you encounter any problems during trading, these signals can serve as your reliable guide 🧭 Feel free to refer to them! I sincerely hope they'll be of great help to you 🌟 👇
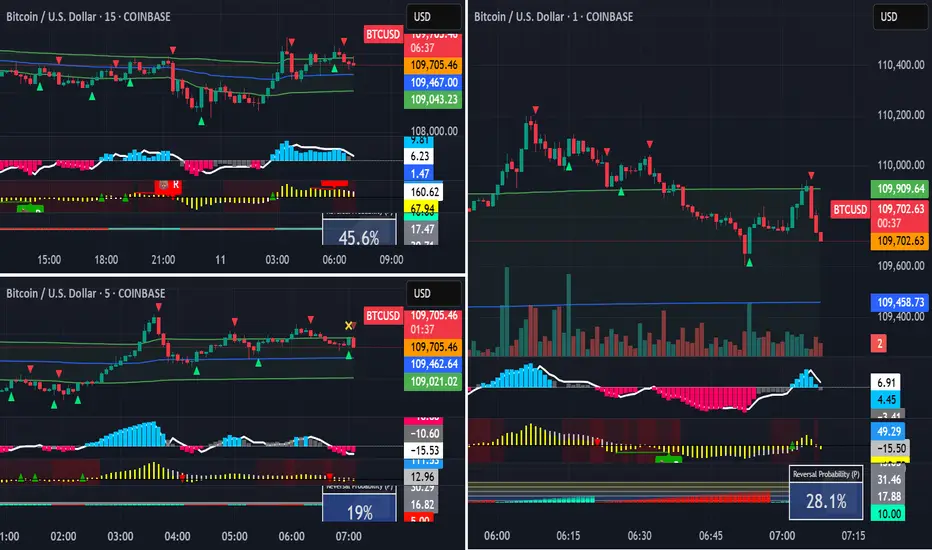
Evening BTC Trend Analysis and Trading RecommendationsDuring the morning session, the Bitcoin price continued its upward momentum from the previous night, surging to an intraday high of 110,653. Subsequently, as bullish momentum gradually waned, the price entered a volatile downward channel. Consecutive bearish candles triggered a significant retracement of earlier gains. In the afternoon, supported by the hourly moving average, Bitcoin saw a brief rebound, climbing to 109,852 as U.S. stocks opened. However, bears quickly regained control, pushing the price down to 108,282 before stabilizing, after which it entered horizontal consolidation. The current price remains around 109,000. Notably, our previous short strategy at 109,800 precisely aligned with the trend, successfully realizing the expected profit.
Current trading advice: Consider light short positions within 109,400–109,700, targeting around 108,500. If the price effectively holds support and stabilizes at 108,500, you may attempt light long positions to speculate on a rebound.
BTCUSD
sell@109400-109700
tp:108500-107500
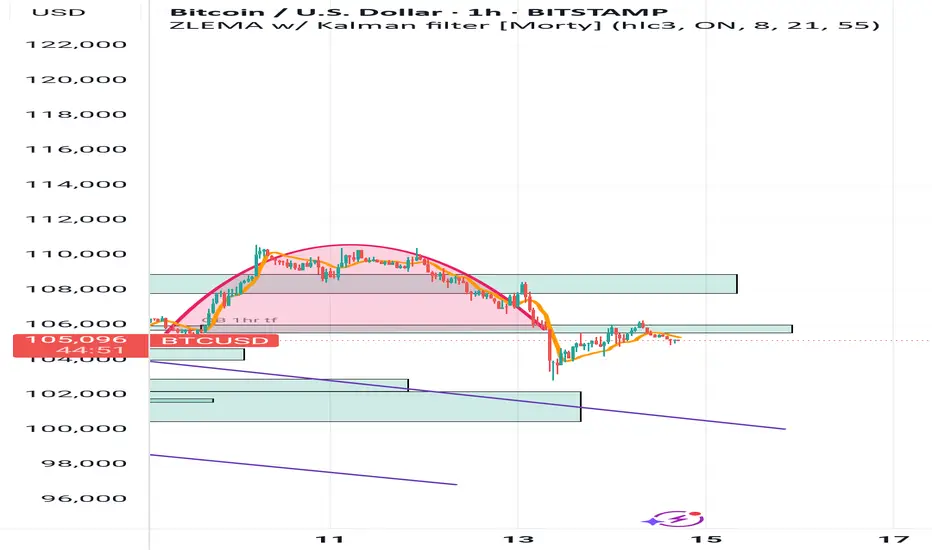
BTC/USD Technical Outlook – Potential Bearish Continuation BelowBTC/USD Technical Outlook – Potential Bearish Continuation Below Resistance 📉🧊
Chart Overview:
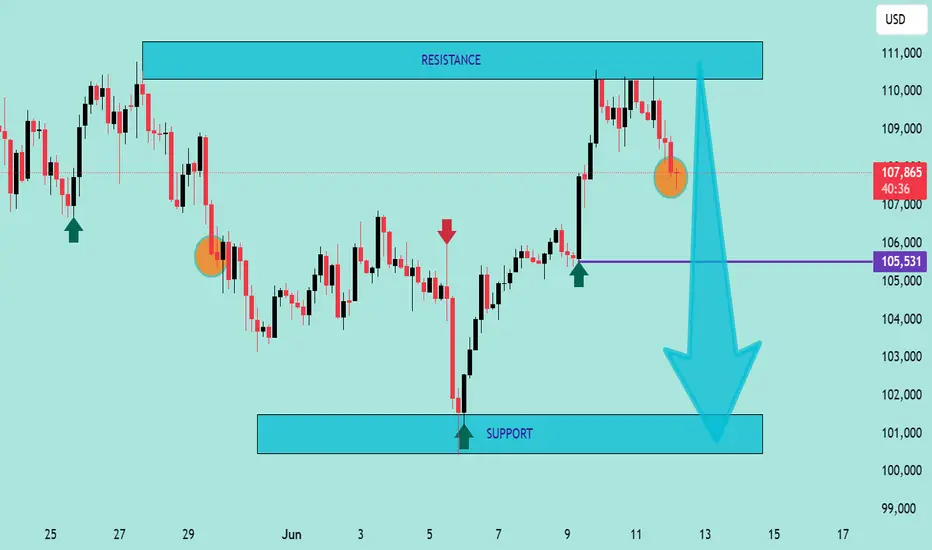
The chart illustrates a clear bearish rejection from a major resistance zone (⚠️ 110,000–111,000 USD), followed by the emergence of a bearish engulfing candle 🔻 marked in orange. This move suggests selling pressure has returned after a short-term bullish rally.
Key Zones & Levels:
🔵 Resistance Zone: 110,000–111,000 USD
Price was rejected from this region with a strong bearish reaction.
🟣 Mid-level Support: 105,531 USD
Currently acting as an interim level — if broken, it may lead to deeper declines.
🔵 Support Zone: 100,500–101,500 USD
This is the next strong demand area — price previously rebounded strongly from here.
Technical Signals:
✅ Double Top Structure formation at the resistance zone, indicating trend exhaustion.
❌ Bearish Engulfing Candle near resistance, confirming reversal strength.
📉 Downward Momentum Arrow suggests possible continuation toward support.
🔻 Lower Highs Formation reinforces bearish sentiment after failed breakout attempts.
Projection 🎯:
If the price closes below 105,531, a bearish continuation is likely, targeting the support zone at 101,000–100,500.
Conversely, a strong bounce above this level could delay the drop, but upside is capped below 110,000 unless a breakout occurs.
Summary:
🧭 Bias: Bearish below 105,531
📍 Targets:
Immediate: 105,531 (key level)
Bearish Target: 101,000
Invalidated if: price reclaims and closes above 110,000 with strength
📊 Trader's Note: Look for confirmation of breakdown with volume or candle close before short entry. Set tight risk management due to volatility.
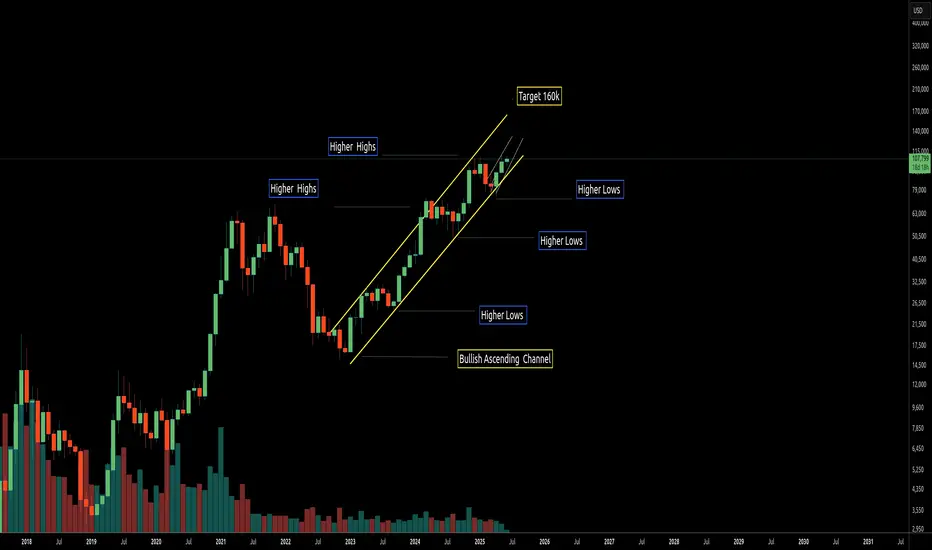
BTC - Bullish Ascending channel - Target 160K
Monthly shows BTC is in a Bullish Ascending channel confirmed by the higher lows and higher highs and the resistance/Support bands at the sides of the channel.
The expected behavior should be a move to the top of the channel.
The target for the move upwards should lie between the 150k to 160K zone .
Note: should BTC fall out of the Ascending channel then this will indicate a possible shorterm drop to the 76K area of support before a recovery back upwards .
general retreat to continue ascendinggeneral retreat to continue ascending
due to the fact that it has not had a main setback to then keep risigin
BTC / USDT - Short Set-UpEvening friends,
Looks like a probable idea, since we're just printing a lower low.
I shorted it already, lets see it play out.
Trade thirsty, my friends!

Bitcoin - Here we have the all time high!Bitcoin - CRYPTO:BTCUSD - is just getting started:
(click chart above to see the in depth analysis👆🏻)
It was really just a matter of time until we see a new all time high on Bitcoin. Consindering that over the past two months alone, Bitcoin rose another +50%, this was a clear indication that bulls are taking over. But this all time high is clearly not the end of the bullrun.
Levels to watch: $300.000
Keep your long term vision!
Philip (BasicTrading)

False bull flag breakout Looking for a lower retest 105k. Target 103k.. also see a hidden bear flag on the flow.

BTCUSD LONG✅ Analysis: BTCUSD has successfully broken its last 15m high (Break of Structure), signaling a potential shift in momentum. I’m looking at the pullback of this break to enter a long position and ride the upward move. Entry is at the demand zone. It might mitigate the fvg and return immediately.
✅ Target: Next key resistance or liquidity area above.
✅ Stop Loss: Just below the last low to minimize risk.
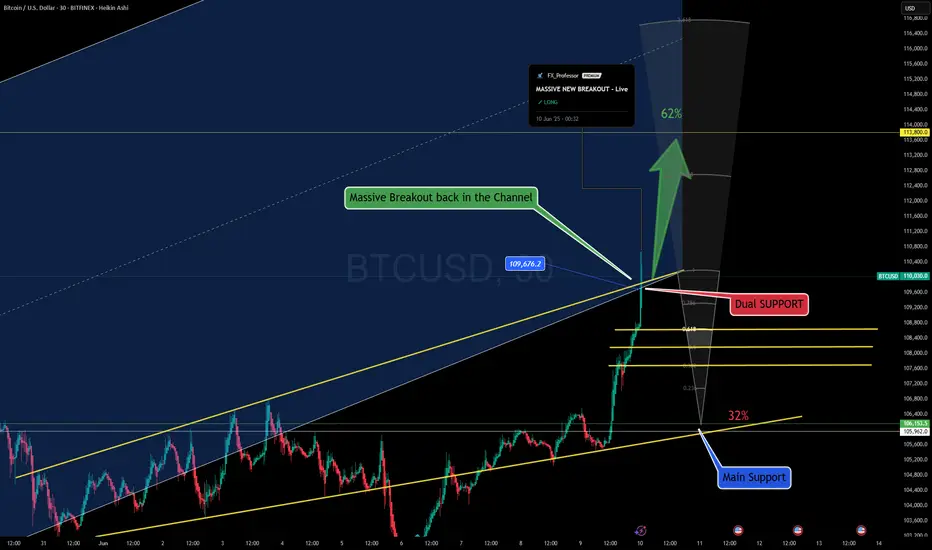
Massive New Breakout in Bitcoin at Dual Resistance- LiveMassive New Breakout in Bitcoin at Dual Resistance
Post with emojis:
🚨💥 Massive New Breakout in Bitcoin at Dual Resistance 📈🔥
Okay, time to revisit the BTC chart because we’ve just arrived at a crucial intersection that could define the next major move!
In our previous update, we anticipated a dip — and it played out perfectly. Using Fibonacci support, we entered long right at the sweet spot, just before a strong upward move that tested resistance levels.
And now... it’s official — BTC has just broken through that massive dual resistance! 🚀
This breakout pushes us back into the ascending channel, which had previously flipped to resistance. Two major technical levels — white and yellow zones — just got cleared in one explosive move.
What's next?
🔹 Monitor for a possible retest of the breakout zone
🔹 Eyes on the 113 key resistance — that’s the next likely magnet for price
🔹 For those already in longs (like me), it’s smart to take partial profits and trail stops 🧠💼
This is a textbook breakout structure, and we’ll need to watch volume and structure confirmation closely.
One Love,
The FXPROFESSOR 💙
Disclosure: I am happy to be part of the Trade Nation's Influencer program and receive a monthly fee for using their TradingView charts in my analysis. Awesome broker, where the trader really comes first! 🌟🤝📈
Possible breakdown to 100kGood day!
I noticed this inverted CnH. Could this be a sign to 100k?
#NFA
#TYOR
general retreat to continue ascendinggeneral retreat to continue ascending
due to the fact that it has not had a main setback to then keep risigin
Can You belive That . QuicK update to my new strategy Bitcoinit will reach the zone , he is going bearich , until the next key level

Sri's Trading StrategyI use a combination of tools and indicators. I use the Double MacD, the QQE Mod and the Friend of the Trend Indicator. I also use the VWAP. A combination of these indicators can then decide a Grade for the Set Up, and only Grade A setup is to be chosen.