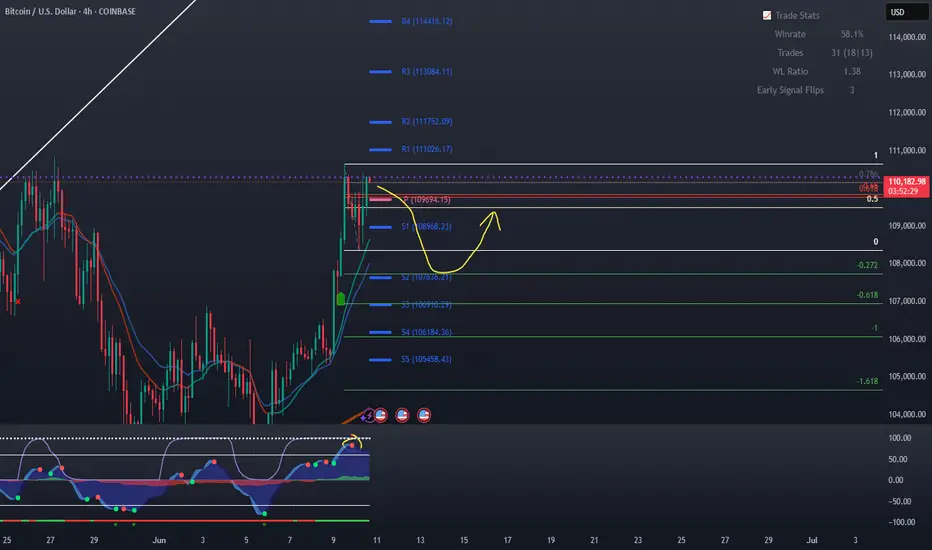
BTC short. Retrace before continuation play.BTC is oversold and we have a 4hr red dot with lower high. Im taking a short here to 107k area then wait if we crash or continue to go higher.
BTCUSD.PI trade ideas
$BTC Extremely Bullish Daily Close - Parabola Underway?Hawt diggity dayumm 🥵
CRYPTOCAP:BTC really going for it following my original idea behind the parabola formation 🤯
Reclaiming ATH high at $112k will confirm the move 🤞
BTC Cup n Handle PatternBe careful for those who sell there is potential for btc to continue to rise with the formation of a cup n handle pattern.
I am here taking a buy stop position at the price of
105500
sl: 104750
TP: 106750

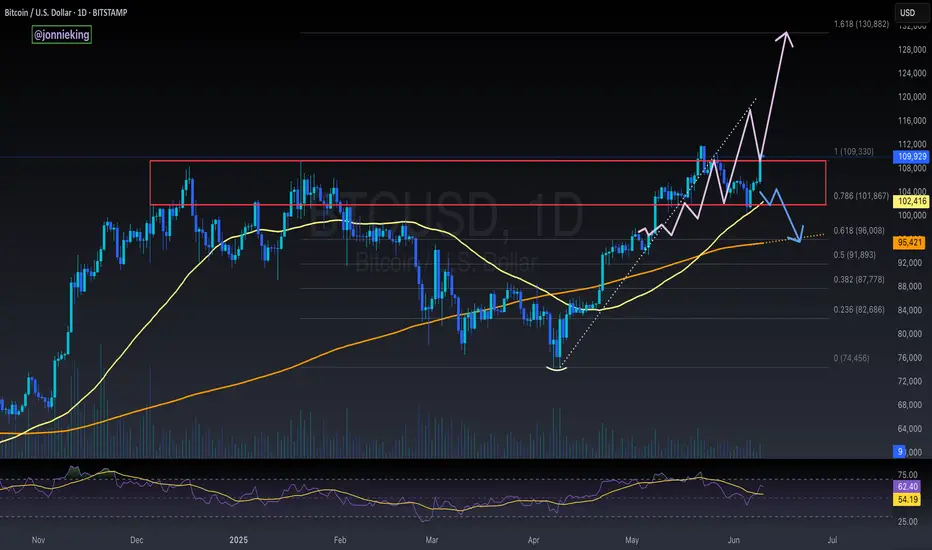
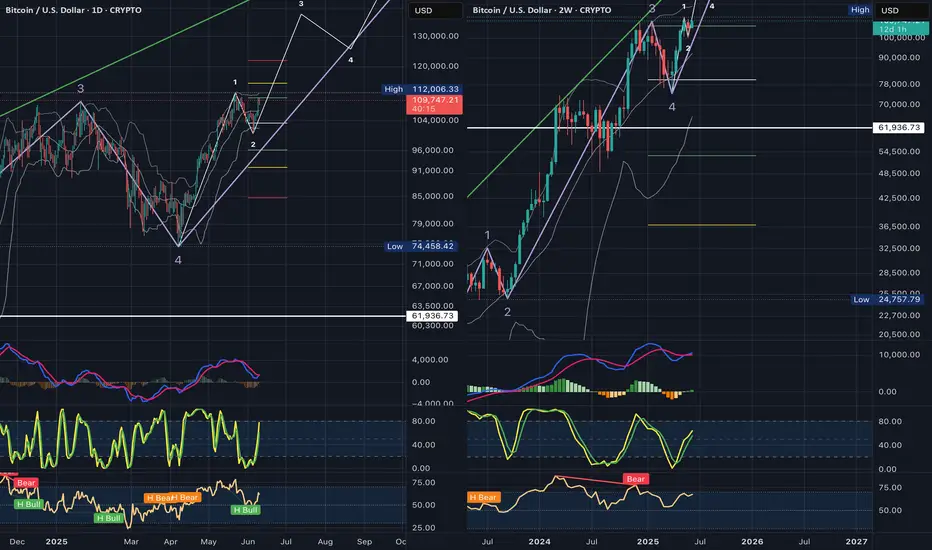
Bitcoins Path?The is how I'm looking to play CRYPTOCAP:BTC over the coming years.
It is my belief that we completed Wave 1 of the SuperCycle and Wave 2 has just begun

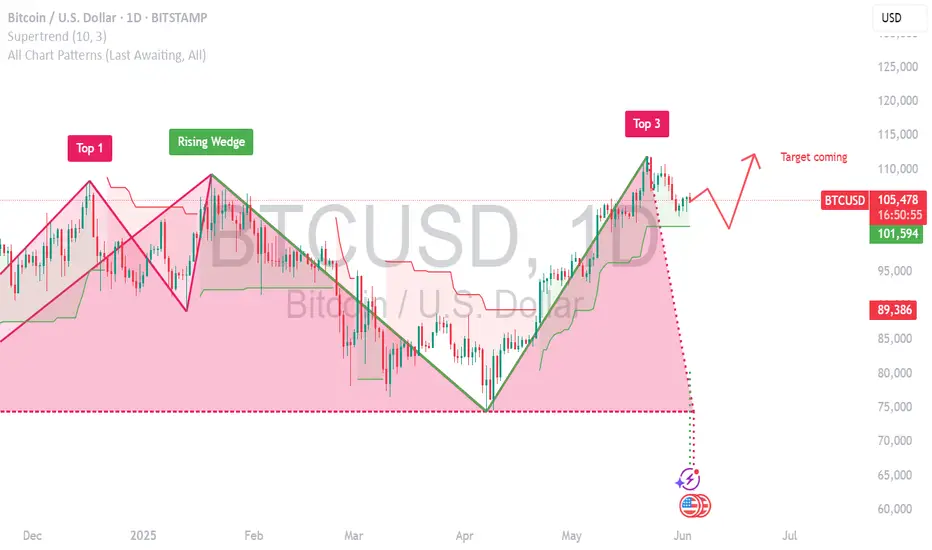
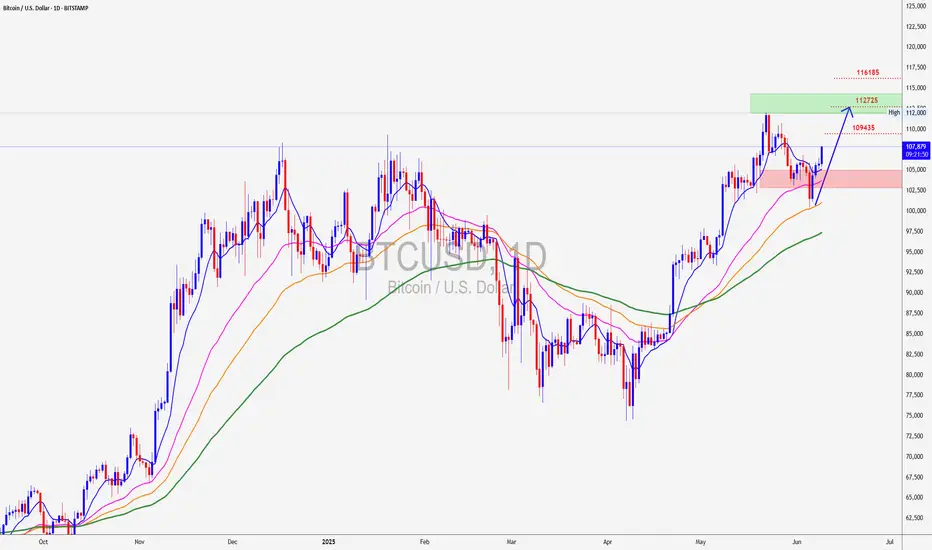
NEW ATH Quick flush down to 100K done, tbh was thinking it could drop to 90K but then again price action is king and I've got to go with the flow.
Not a confirmed breakout to all-time highs yet but will happen.
continuation of uptrend 🔒.
BITSTAMP:BTCUSD
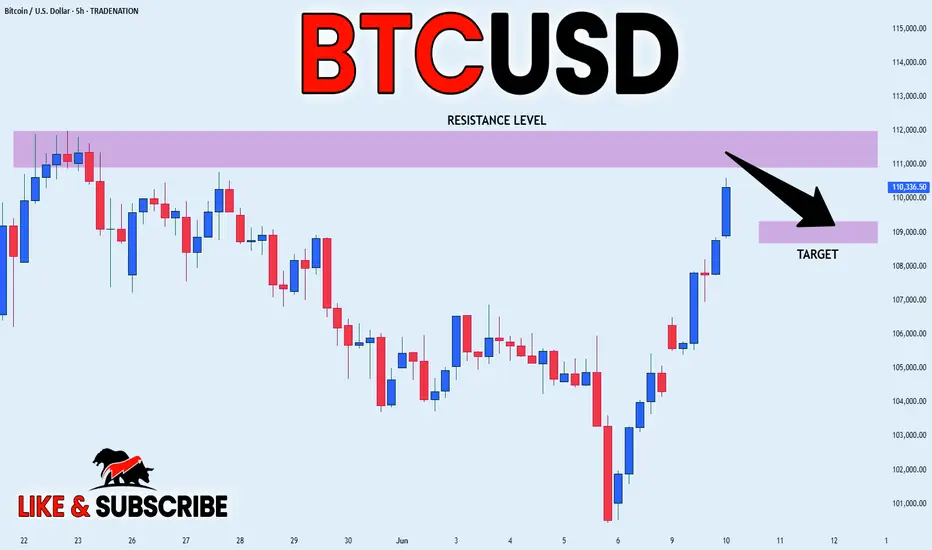
BITCOIN LOCALLY OVERBOUGHT|SHORT|
✅BITCOIN will soon retest a
Key resistance level of 112,000$
Which is an all-time-high
And the coin is locally overbought
So I think that the price will make a pullback
And go down to retest the demand level below at 109,000$
SHORT🔥
✅Like and subscribe to never miss a new idea!✅
Disclosure: I am part of Trade Nation's Influencer program and receive a monthly fee for using their TradingView charts in my analysis.
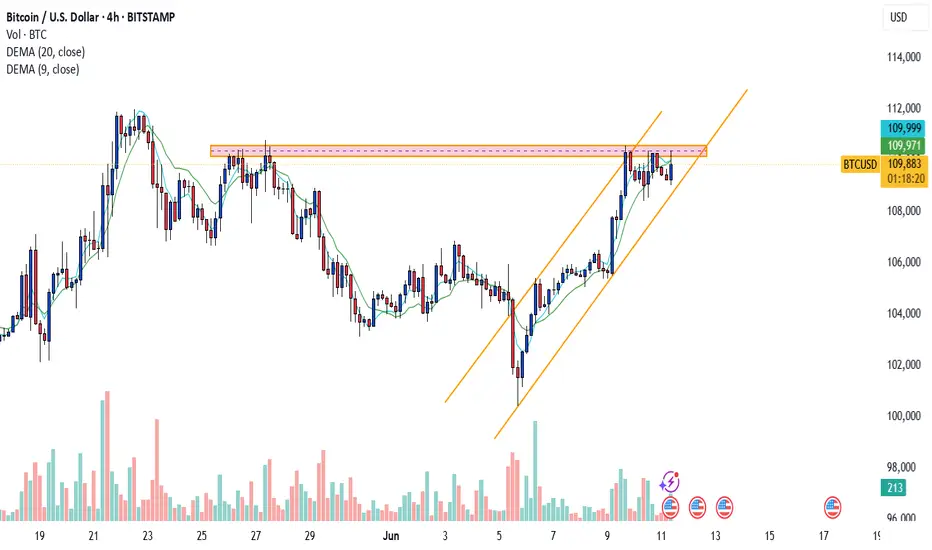
BTC/USD ANALYSISBitcoin is currently facing rejection from a key horizontal supply zone while trading within an ascending channel. The 20 MA is aligning with the channel’s support trendline, providing a strong support base.
A breakout above the supply zone would confirm bullish continuation. However, a breakdown below the channel support could lead to further downside - monitor the price action closely.
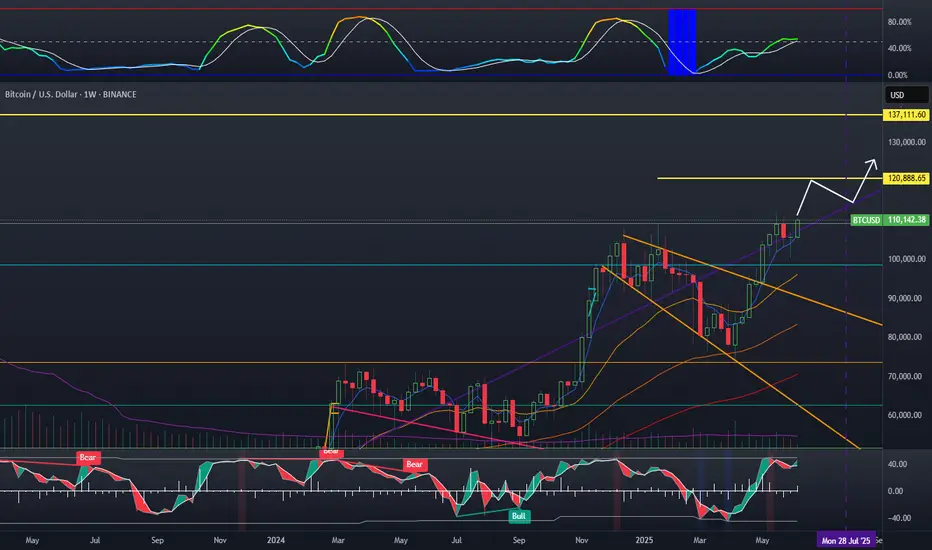
Bitcoin update - 120k soonFollowing my LINK chart, I stated that link tends to lead large Bitcoin pumps. We just noted a huge addition of liquidity to Bitcoin, which has flowed to Eth. Altcoins will follow in a few weeks. Bitcoin will probably be over 120k by end of month. I believe we see a local top around 140k.
BBWP has a lot of room
Stochastic can remain high for a long time for such a volatile asset class
BTC alternative scenarioThis Scenario is Possible,not a big fan of it but if I get a reaction on the level will go for a buy with small risk
levels highlighted
Bitcoin to 100k isn’t bearish. It is an opportunity.
Bitcoin just retraced ~10% after its 21W EMA golden cross — and history tells us that’s not weakness… it’s setup.
Chart Context:
We’ve seen this pattern before:
• 2016: Golden cross → 11% dip → 160% rally
• 2020: Golden cross → 13% dip → 300% rally
• 2025: Golden cross → 10% dip → ?
Right now, BTC is doing what it always does post-cross:
Retest prior structure. Fill liquidity. Create a higher low.
⸻
🧠 The Key Signal: 21W EMA Cross
This chart shows a textbook liquidity void retest, with:
✅ Demand zone at $93K–$98K. This might stay untouched.
✅ Higher Low structure intact
✅ Volumes compressing — potential breakout coil
✅ Smart money re-accumulating
⸻
📍 $98K–$100K Zone = Opportunity
This isn’t a top. It’s a retest.
And likely the last high-conviction entry before BTC pushes to $124K and beyond.
Golden Cross ≠ Immediate moon
Golden Cross = Structure → Dip → Expansion
⸻
📊 What Comes Next?
If BTC follows the 2016/2020 blueprint, expect:
→ Sideways chop
→ Dominance peak
→ ETH/BTC rotation
→ Altcoin rally
→ Sentiment shift
⸻
Conclusion:
🧠 The smartest plays aren’t made at ATHs — they’re made in the retraces that shake others out.
This $100K dip is exactly what the market needs for the next leg.
Stay focused. Watch structure. Follow conviction.

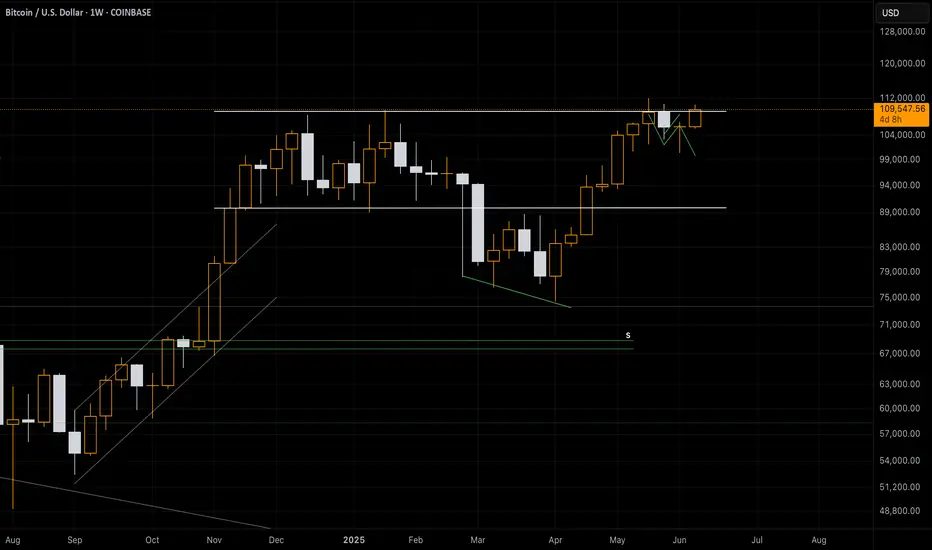
BTCUSD: Short-Term Range Trading as Bulls and Bears StalemateOn the weekly timeframe, prices retreated under pressure after hitting a high of 112,000, forming consecutive bearish candles. Despite this, prices remain at elevated levels, intensifying overall market volatility. Prior to Friday, the daily chart showed a sideways-downward trend, but yesterday’s data-driven rally appeared to disrupt this pattern, creating conflicting signals. Technical indicators on the 4-hour and hourly charts are shifting rapidly, with no clear signals for medium-to-long-term trends.
The current trend is likely to remain range-bound, with resistance at 107,000 and support at 101,000.
BTC/USD
sell@106000-107000
tp:102000-101000
I am committed to sharing trading signals every day. Among them, real-time signals will be flexibly pushed according to market dynamics. All the signals sent out last week accurately matched the market trends, helping numerous traders achieve substantial profits. Regardless of your previous investment performance, I believe that with the support of my professional strategies and timely signals, I will surely be able to assist you in breaking through investment bottlenecks and achieving new breakthroughs in the trading field.

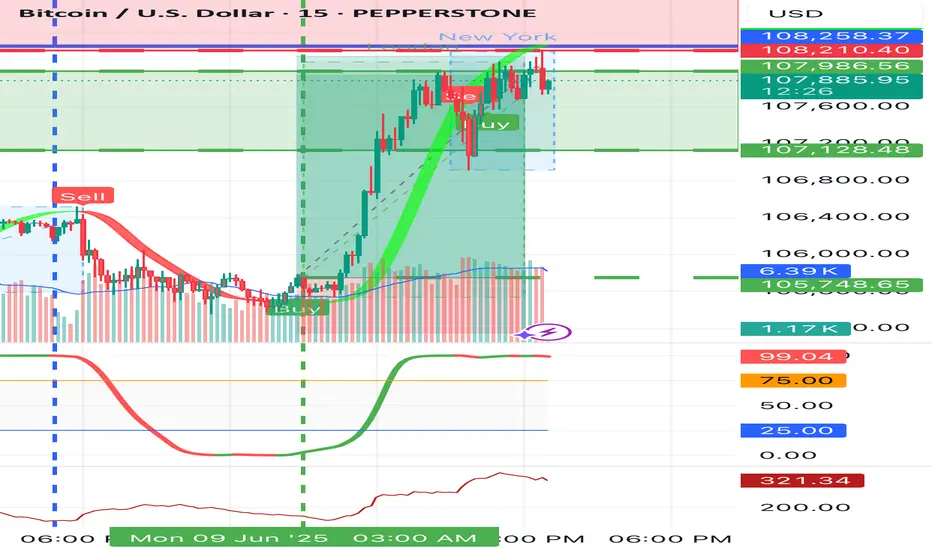
BITCOIN chart updated Bitcoin Buy Signal Triggered ₿🚀
BTC showing strong bullish momentum after holding key support.
Entered long position on breakout above short-term resistance with volume confirmation.
Higher lows forming a solid base — structure favors continued upside.
Targeting the next resistance zone around , with stop loss below recent swing low.
Watching closely for follow-through and potential scaling opportunities.
Market sentiment improving — let's see if the bulls can take control.
#Bitcoin #BTCUSD #CryptoTrading #BuyTheDip #BreakoutTrade #CryptoSetup #BullishBias #PriceAction #TechnicalAnalysis"**
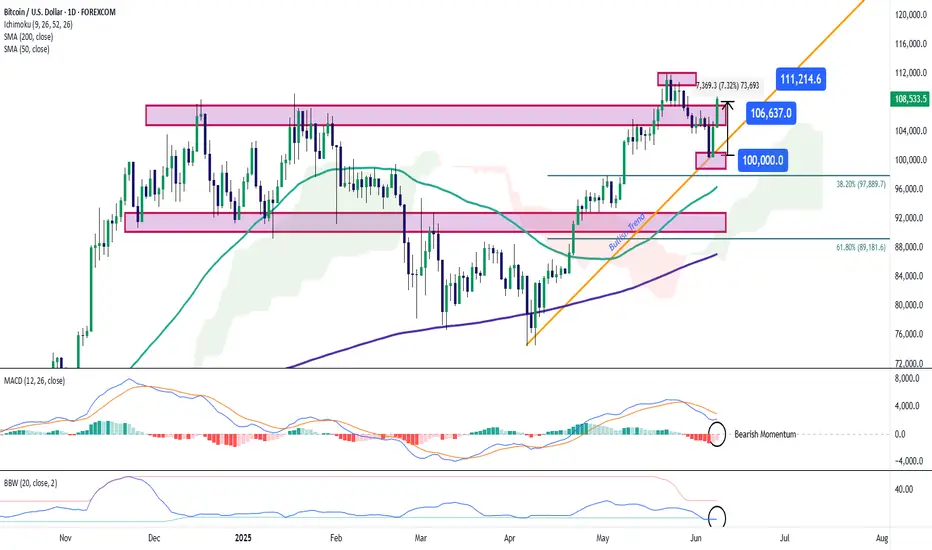
Bitcoin Approaches the $110,000 Zone Once AgainBitcoin has seen a strong bullish surge in recent trading sessions, climbing more than 7% and now trading back above $108,000 per BTC. The buying bias has been consistently fueled by the announcement from Metaplanet, which plans to raise over $5 billion to acquire Bitcoin — a move that has temporarily restored short-term confidence in the market. As euphoria continues to build in the short term, buying pressure may become increasingly relevant in the upcoming trading sessions.
New Uptrend Line Forming
Following recent upward movements, a new bullish rebound has formed on the chart, initiating a consistent uptrend as price action nears historical highs once again. If buying pressure remains stable, this emerging trendline could gain greater relevance in the short term.
MACD
The MACD histogram continues to oscillate below the neutral 0 line, which suggests that the primary market momentum still lies in bearish territory. If the histogram keeps showing lower values, the previously dormant selling pressure could begin to regain strength.
Bollinger Bands Width
The line measuring the width of the Bollinger Bands remains at low levels, indicating a steady decline in long-term average volatility. If this behavior persists, it could signal the beginning of a consolidation phase in Bitcoin’s price during the next few sessions.
Key Levels to Watch:
$111,000 per BTC: Previous all-time high zone. A breakout above this level could strongly reactivate the bullish bias and open the door to a more aggressive uptrend in the short term.
$106,000 per BTC: Nearby support that may serve as a buffer against potential selling corrections in the sessions ahead.
$100,000 per BTC: A key psychological support level, aligned with recent local lows. Price action falling below this level could put the current bullish formation at risk.
Written by Julian Pineda, CFA – Market Analyst
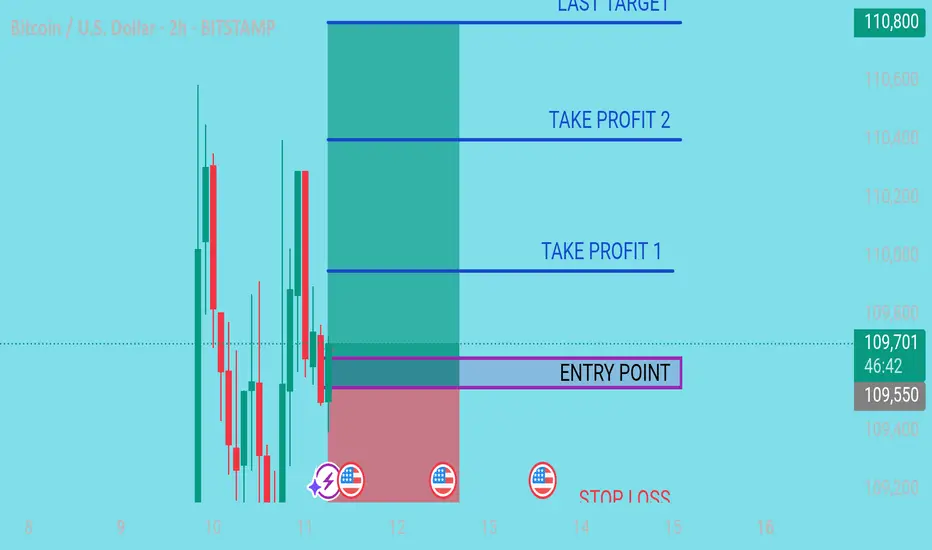
CHECK BTCUSD SIGNAL READ CAPTAIN Entry: around 109650/109550✅
Take Profit 1: 109950✅
Take Profit 2: 110400✅
Last Target: 110800✅
Stop Loss: 109100❌
TECHNICALLY ANALYSIS SATUP
FALLOW RISK MANAGEMENT ✅
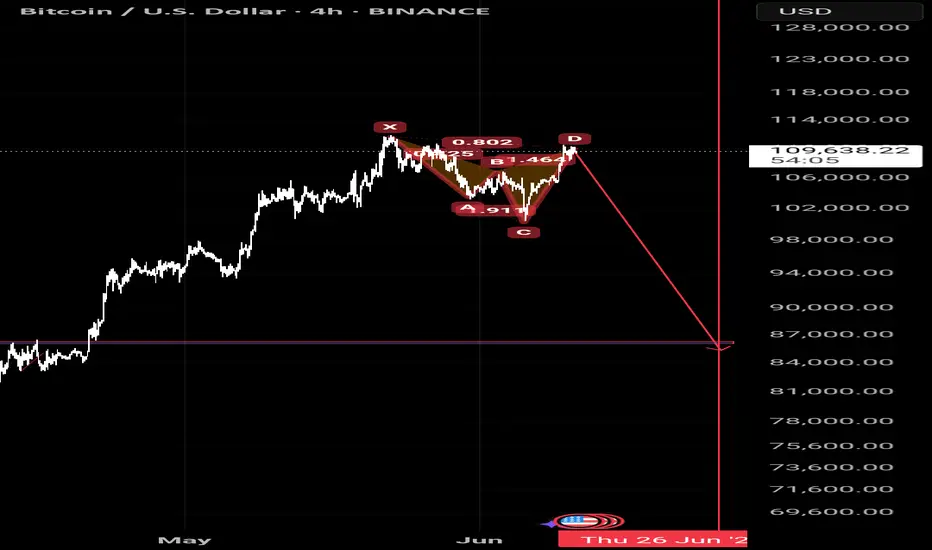
Bearish pattern complete for down trend Given the harmonic patterns that occur frequently in price sequences in financial markets, we expect a price drop to around 90,000. Traders who are active in the futures market should place their stops above the x zone.
Technical Analysis – BTC/USD Technical Analysis – BTC/USD
📅 Date: June 11, 2025
🔍 Key Observations:
🔴 Resistance Zone – $110,000 to $111,800
Price has tested this resistance block twice (🔴 red arrows) and rejected both times, indicating strong selling pressure in this zone.
Rejection candles show long upper wicks, suggesting failed attempts by bulls to break above.
🟢 Support Zone – $101,800 to $103,500
This demand zone has been respected multiple times (🟢 green arrows), showing a solid base for potential bounces.
Price action previously rallied strongly after touching this level.
📦 Supply to Demand Play
Price made a sharp bullish move from support to resistance (📘 blue box shows the impulsive move).
After reaching resistance, the price is failing to break above, indicating possible exhaustion of bullish momentum.
📉 Potential Move:
🔽 Short-Term Bearish Bias
If price fails to hold current levels and breaks below the small consolidation (after blue box), we may see a drop to ~$105,583 (🔵 purple line = key level).
If that breaks, next likely destination is the support zone around $102,000 (⬇️ downward arrow path).
⚠️ Risk Notes:
🔁 Watch for any false breakouts or liquidity grabs above resistance.
📉 If bearish momentum increases below $105,583, sellers may take control in the short term.
✅ Trade Idea (Hypothetical):
Sell/Short near resistance (⚠️ confirmation needed like bearish engulfing or failed breakout)
Target 1: $105,583
Target 2: $102,000 zone
Stop-loss: Above $111,800 (invalidates setup)
📌 Summary:
BTC/USD is currently stuck between a well-defined resistance and support range. Unless bulls break above $111,800 with strong momentum, the structure favors a potential pullback toward the demand zone. ⚖️

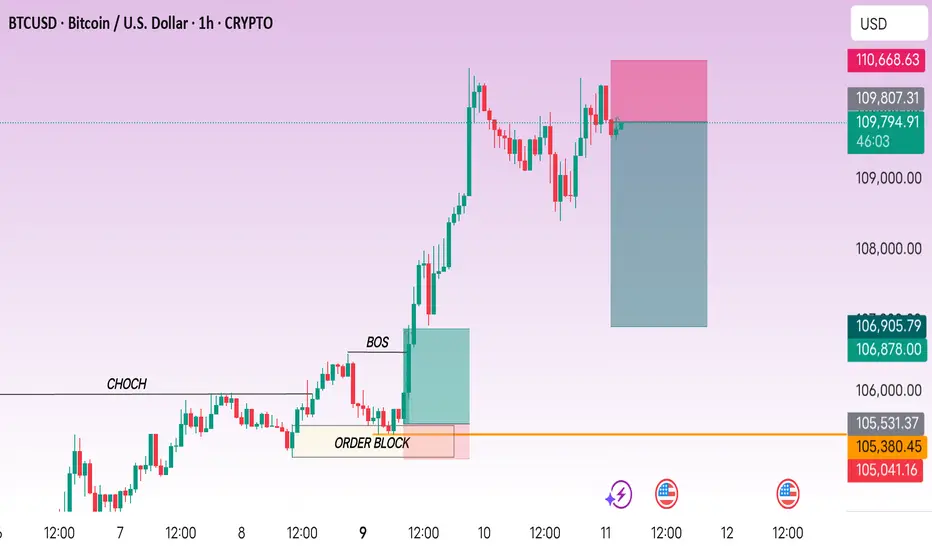
CHECK BTCUSD SIGNALS READ CAPTAIN BTCUSD sell zone
TRADE
entry point 109.807
Take profit Target 106.905
Stop loss 110.668
#BTCUSD Buy 105748.65#BTCUSD Buy 105748.65
SL 105148.65
TP 105948.65
TP 106748.65
TP 108148.65
Trade at your own risk
Protect your capital
The Wizard 🧙♂️ SWFX
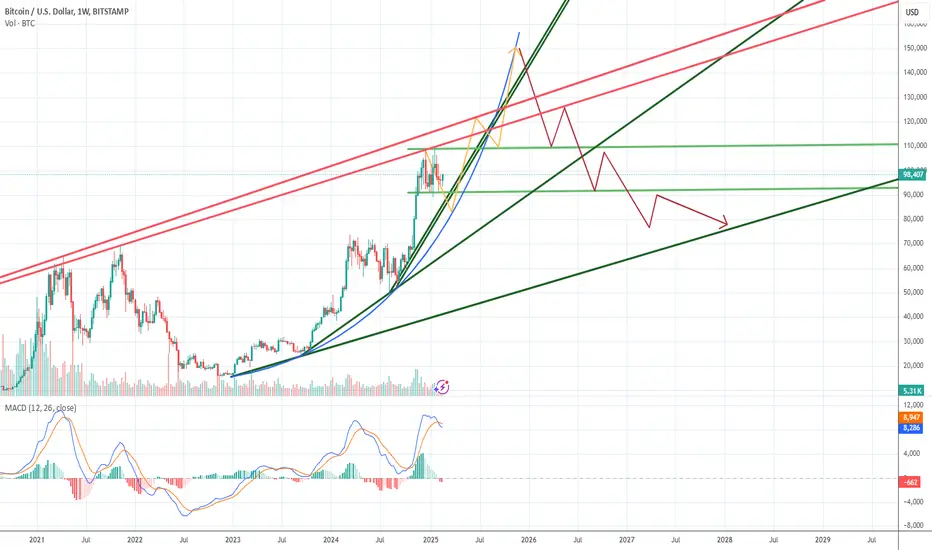
Bitcoin: If history Repeats.Parabolic curve forming and set to compete by end of Q4 -- upward targets are 130k to 150k -- before returning back to top of last cycle's top - in the 70k's by Q2-2027. Y2026 will be the return of the Bitcoin bear. :(
btc ready to reach for the stars...Elliot wave for btcusd showing upside targets. shallow retracement indicates strong pump incoming.
BITCOIN: Retaking Its UptrendLooking good....looking good. Now that Bitcoin is retaking its uptrend move what's next?
Well knowing that at this point in TIME the Daily and the 4hrs entered in their Bullish TIME Cycle and the 1 hr its Bearish TIME Cycle we should expect a pause and retrace (small) because its 1hr TIME Cycle it just entered in its Bearish Cycle and that will make price to stop from going higher but remember the higher TIME Cycle overpowers the smallest Cycles so don't worry about it if you see a retrace because for at least the rest of week we should be seeing Higher highs and higher lows on the 1hr TIME Cycle. Now If price does NOT continue higher for at least the rest of week then we going to have a problem, but lets take one move at the TIME should we? Enjoy the ride.
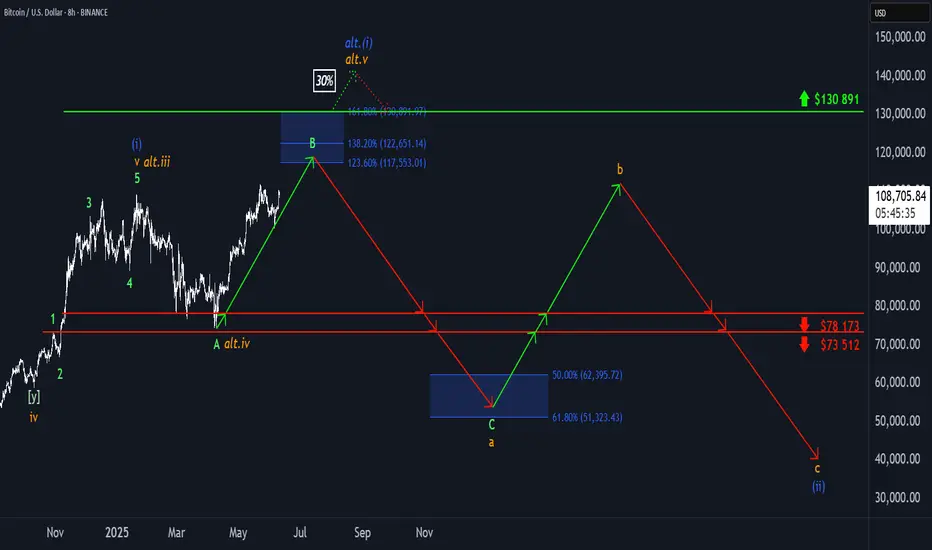
₿ Bitcoin: Push to the Upside! Bitcoin has made a significant push to the upside, which brought it closer to the upper blue Target Zone between $117,553 and $130,891, where we primarily expect the corrective rise of green wave B to conclude. We consider this price range an opportunity to take partial profits or to open short hedges for tactical protection of existing long positions — thus, we don't plan to sell all our Bitcoin holdings there. Potential short hedges could be secured with a stop 1% above the upper edge of the zone since there's a 30% chance that price could exceed this zone to develop a new high for blue wave alt.(i) before reversing later. Primarily, however, green wave C should commence in the upper blue zone and drive BTC down into the lower blue zone between $62,395 and $51,323—and thus to the low of orange wave a.
📈 Over 190 precise analyses, clear entry points, and defined Target Zones - that's what we do.
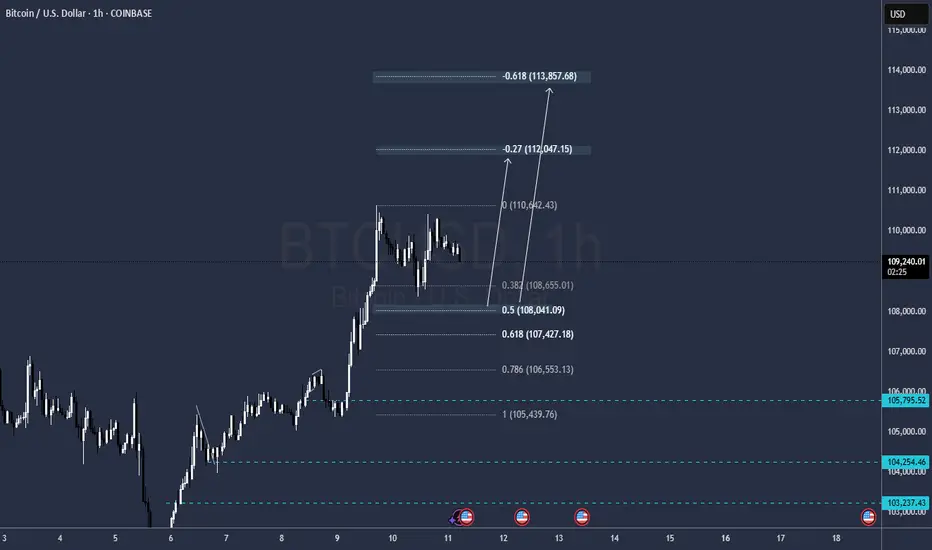
Bitcoin Rally is almost over! Btc has been performing as expected and now, I expect it to reach either till the upper channel, which is clearly a reversal pattern) or beyond it to the Fib 100 to complete the 5th wave. This is a high probability setup considering the market conditions.
So before the rally stops, is gonna make a new high.
Any feedback is appreciated! :)
BITSTAMP:BTCUSD
