Market preview 6-9-25 - SPX USOIL GOLD BTCSPX looks like it will try to take stops out around 6050-6080. Gold may rally a little more but then probably breaks down again. USOIL looks bullish. BTC is at resistance
BTCUSD.PI trade ideas

Bitcoin (BTC): Seeing Strong Buyside Dominance | New ATH?Buyers are showing strong dominance even on the daily timeframe, where currently we are back near the middle line of the Bollinger Bands, retesting the area while buyers try to claim control around the current zone.
As soon as we see that buyers claim dominance and we see similar volume to back the bullish movement, we are expecting to see the movement to the upper side of Bollinger Bands, where then we might be heading for $120K.
Swallow Academy

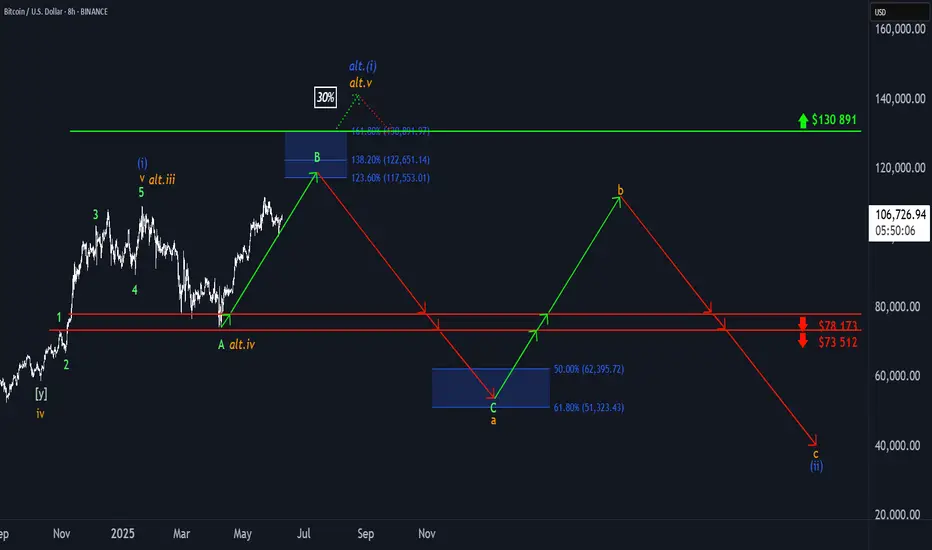
₿ BTC: Upside Potential Remains IntactBTC posted modest gains over the weekend, but more upside is expected in our primary scenario. We continue to track a corrective advance in green wave B, with the potential to extend into the upper blue Target Zone between $117,553 and $130,891. From that top, wave C should initiate a downward move into the lower blue zone between $62,395 and $51,323—completing orange wave a. Subsequently, we anticipate a bounce in wave b, followed by another decline in wave c, which should conclude the larger correction of blue wave (ii). There is still a 30% chance that blue wave alt.(i) could make a new high, extending beyond the Target Zone and delaying the broader corrective sequence.
📈 Over 190 precise analyses, clear entry points, and defined Target Zones - that's what we do.
BTC / USD 1hr 110K INC!BTC/USD – 1H Chart Analysis
📝 Trend Overview:
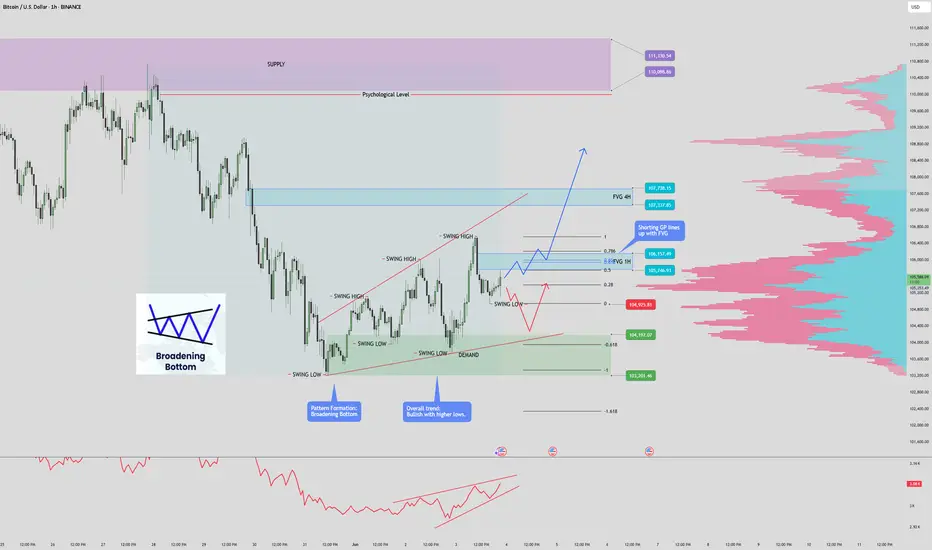
BTC is showing signs of a bullish reversal, forming higher highs and higher lows, supported by the broadening bottom pattern. This formation often signals accumulation and precedes breakout moves. The market has now bounced three times from the demand zone, reinforcing its validity as a strong support.
📍 Key Technical Zones:
Demand Zone:
103,201.46 – 104,197.07
Price has tested this zone multiple times and bounced, indicating strong buying interest.
☑️ Supply Zone:
110,098.80 – 111,330.54
Significant historical resistance. If BTC reaches this zone, expect strong selling pressure.
📥 Fair Value Gaps (FVGs):
1H FVG: 105,746.93 – 106,157.49
Aligned with the Fibonacci Golden Pocket (0.618–0.786) retracement, increasing confluence.
4H FVG: 107,337.85 – 107,738.15
Key level for potential breakout or rejection.
✅ Targets:
TP1: 1H FVG zone (~106k)
TP2: 4H FVG zone (~107.5k)
TP3: Supply zone (~110k–111k)
❌ Invalidation:
Break and close below the demand zone would invalidate the bullish bias short term.
📊 Volume Profile & OBV:
Volume Profile (Right Side):
High activity zones between 105k–107k show areas of interest for both bulls and bears.
📊 OBV (On-Balance Volume):
Currently consolidating, which suggests accumulation and potential for a breakout once volume picks up.
🧠 Summary:
BTC has regained bullish momentum following multiple rejections from the demand zone and the formation of a broadening bottom. If the price confirms a higher low at or above 104,925, expect a move towards the 106k and possibly the 110k region. Monitor price action at the FVGs for reactions and profit-taking opportunities.
(NOTE: This is a spot trade - Leverage at your own risk and research)
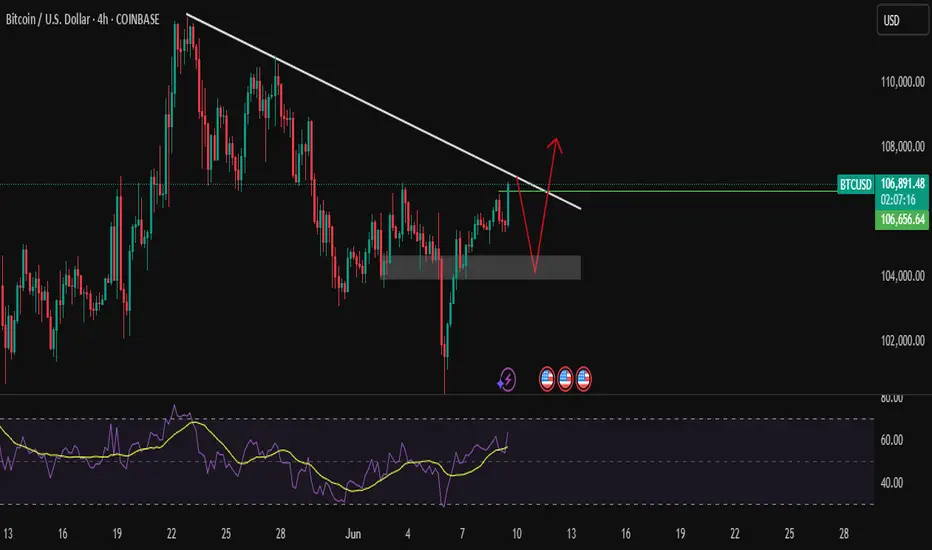
BTCUSDBTCUSD 4hr analysis
Time for retracement if does not breaks th downtrend line
wait and watch situation, better opportunity could be buy from retracement
Bitcoin summer of fun...If we are in a continuation pattern, and Bitcoin breaks the neckline soon.
We could be on the cusp of a very interesting and strong few months of price action.
Continuation upward sloping #inverseheadandshoudlers

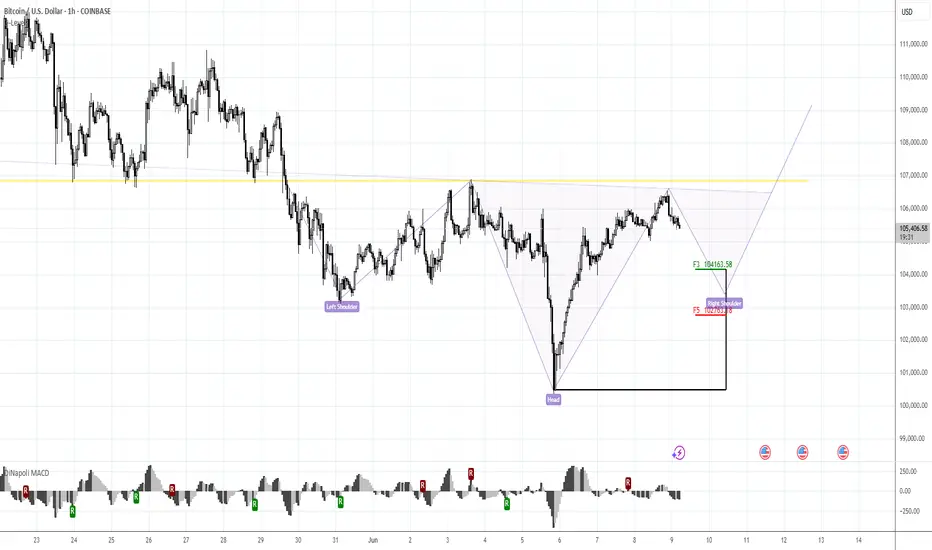
BTC 1H Reverse H&S Morning folks,
So, drop is done due to Trump-Musk conflict, although we haven't called to trade it. Anyway, current picture is much better and doesn't need a lot of comments. We have reverse H&S in progress, with potential area for entry around 102.5-103K where we expect the right arm should appear. Invalidation point is ~100K (bottom of the head).
Emini Nasdaq 100 Weekly Outlook and Walkthrough. Outlined the orderflow and my thought process on Daily profiles and expansion days. Marked out my thought process. And how I would execute in that very specific moment. One of my best examples. Go ahead check it out.

BTC bearish in Short termBTC has broken the 31 May low, so the short-term view is bearish.
It also made a head and shoulder pattern, which supports the view on the short side.
As gold and silver are bullish and DXY (dollar index) bearish, then a flat pattern (5 wave up) mentioned in the chart is also possible
In both cases, BTC is short-term bearish
Plz Follow me on X for more updates

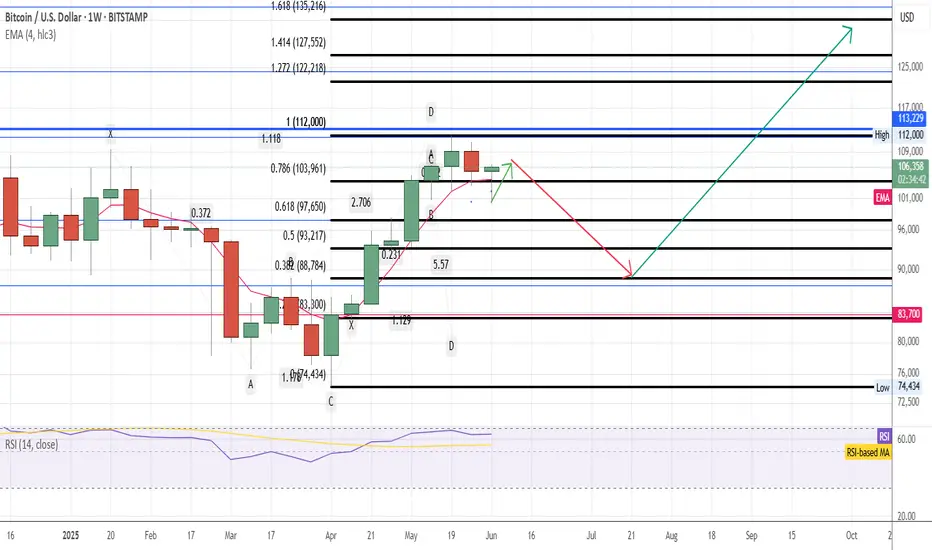
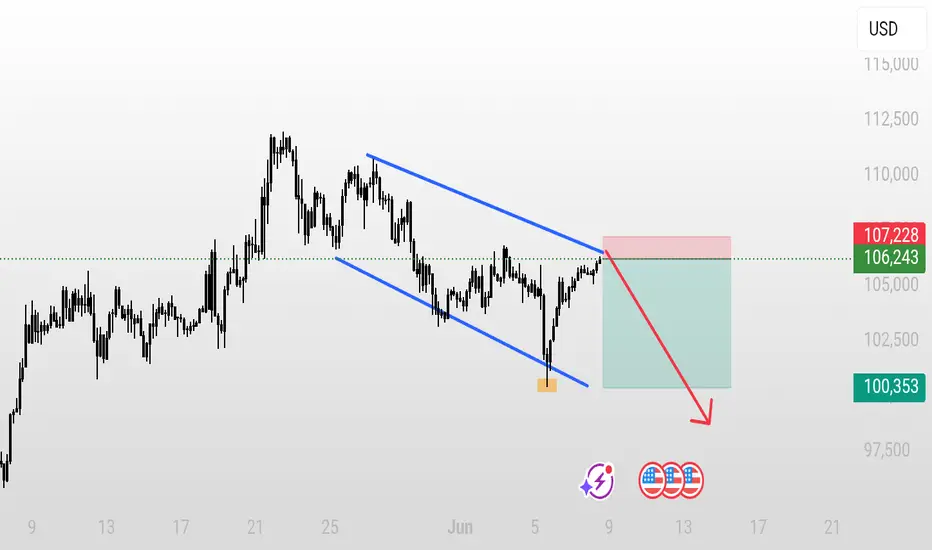
BTC next move BTC/USD – 4-Hour Time Frame Analysis
Bitcoin (BTC) is currently trading within a well-defined downward parallel channel on the 4-hour chart. The price action continues to respect both the resistance and support zones of this channel.
At present, BTC is approaching the upper boundary of the channel, which serves as a key resistance level. If the resistance holds, a rejection is expected from this zone, potentially leading to a significant downward move.
Traders should monitor this area closely for confirmation signals before entering short positions.
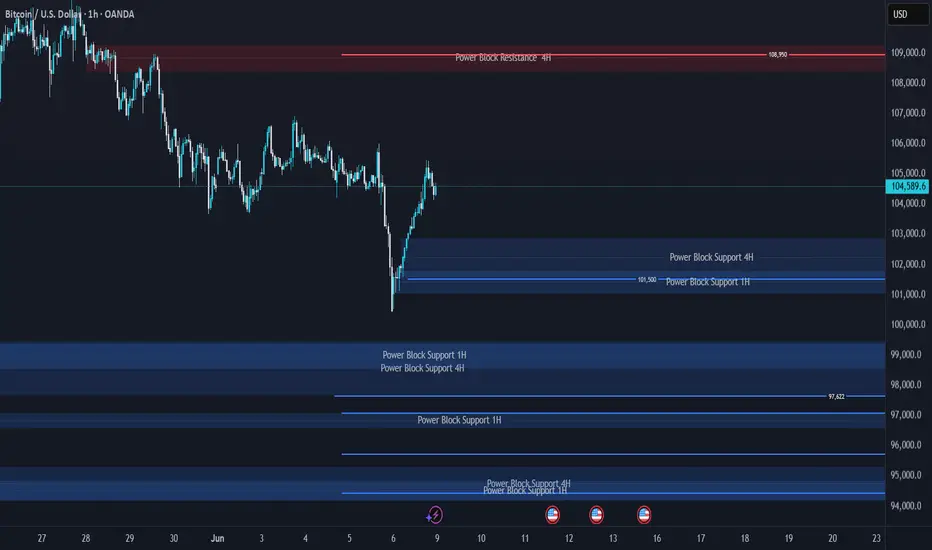
BITCOIN Support & Resistance Levels🚀 Here are some key zones I've identified on the H4/H1 timeframe.
These zones are based on real-time data analysis performed by a custom software I personally developed.
The tool is designed to scan the market continuously and highlight potential areas of interest based on price action behavior and volume dynamics.
Your feedback is welcome!
BTC Broadening Formation into Summer 2025BTCUSD has the potential to go to new ATH's in 2025 given it's recent trend higher, but I see a level of resistance from the broadening formation and a weak macro environment. I expect the USD to gain strength into summer/fall and as a result BTC and Equities become weaker, seeing this area on BTCUSD as a potential area to turn and trend lower.
- ERAZ

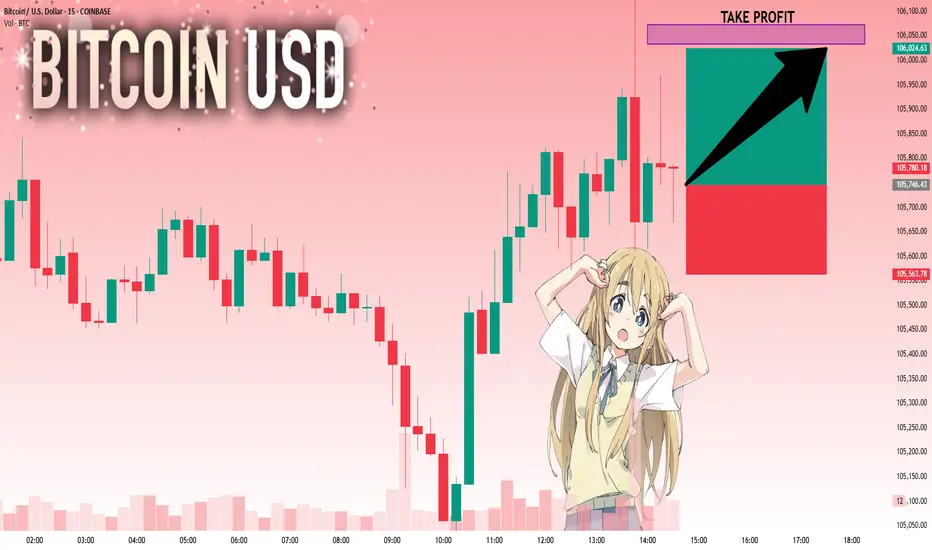
BTCUSD: Will Go Up! Long!
My dear friends,
Today we will analyse BTCUSD together☺️
The market is at an inflection zone and price has now reached an area around 105,746.43 where previous reversals or breakouts have occurred.And a price reaction that we are seeing on multiple timeframes here could signal the next move up so we can enter on confirmation, and target the next key level of 106,033.06.Stop-loss is recommended beyond the inflection zone.
❤️Sending you lots of Love and Hugs❤️
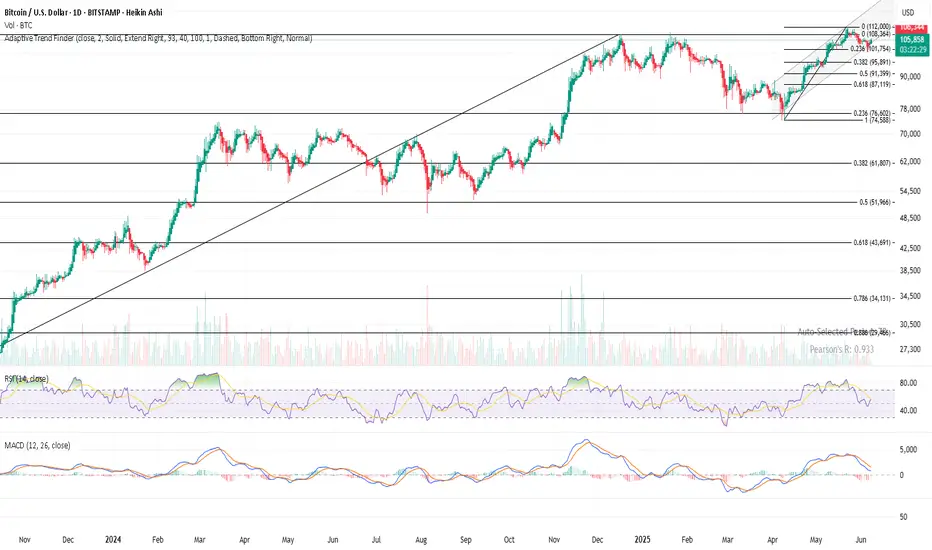
BTC Multi-Timeframe Analysis: Daily, Weekly & Monthly Structure📊 CRYPTOCAP:BTC Daily Chart
Price bounced cleanly off the 0.236 Fibonacci retracement at $104.6 and is now pressing into local resistance.
– Heikin Ashi candles turned green
– RSI is curling upward
– MACD remains weak, no confirmation yet
Key levels:
→ Break above $106.3 could open the way to $112K
→ Drop below $104.6 puts $100K back in play
📅 All eyes on tonight’s weekly close.
A candle close above $106K would confirm strength into next week.
BTCBTC is getting ready for next reaction level 107K and then will see the price action.
Disclosure: We are part of Trade Nation's Influencer program and receive a monthly fee for using their TradingView charts in our analysis.
Will BTCUSD see $90,000 ever again? Phoenix FX mid term analysisBTCUSD 4-Hour Outlook: The Week Ahead
🔴 Key Resistance Zones
First Resistance
$107 000–$108 500
Recent swing highs where price stalled before the last leg down. Clearing and closing above $105 000 on the 4H would open the door toward this zone.
Final Resistance
$111 000–$113 000 (If broken expect a run to $115,000)
The all-time-high area. Heavy sell-side liquidity lives here and past price action shows repeated FVG fills and wicks into this region.
🔵 Critical Support & Buy Zones
Discount Buy Zone:
$92 000–$89 000 (50% at $89 150)
A deeper weekly FVG and longer-term trend support. The ultimate “buy the dip” area if the premium zone gives way.
Premium Buy Zone:
$100 000 – $99 000 (50% at $99 450)
A 4H Fair Value Gap that aligns with our higher-timeframe trend support. The recent bounce here signals strength—and a possible launchpad back into resistance.
📊 Weekly Price Action Scenarios
Bullish Theory:
If BTC can close cleanly above $105 000 on the 4H, look for a run into $107 000–$108 500 (First Resistance). A follow-through push could then target $111 000–$113 000 (Final Resistance) by week’s end with a potential further move to $115 000 where the 8 year trend will be tested again.
Bearish Theory:
Failure to reclaim $105 000, or a clear rejection in the $107 000–$108 500 zone, could usher in a retest of the Premium Buy Zone (~$100 000). A break below $99 000 would shift focus toward the Discount Buy Zone around $92 000–$89 000.
💡 Trade Ideas for the Week
Potential Long Ideas
Entry: 4H candle close above $105 000
Targets: First take-profit at $108 500; stretch target $112 000–$113 000
Stop-Loss: Below $103 000
Zone Re-Entry Long
Entry: Bullish 4H candle close in $100 000–$99 000
Targets: $107 000 then $112 000
Stop-Loss: Below $97 500
Potential Short Ideas
Entry: Bearish price action (e.g., engulfing candle or wick rejection) in $107 000–$108 500
Targets: $100 000→$92 000
Stop-Loss: Above $109 000
Just a Heads-Up:
This is my take on the charts—not gospel, not financial advice, and definitely not a crystal ball 🔮.
Trading is part skill, part patience, and part “what just happened?” 😅
We all see things a little differently, and that’s the beauty of it.
So if you’ve got a hot take, wild theory, or just want to drop some chart wisdom—hit the comments!
Let’s grow, learn, and laugh through the madness together. 🚀📈
Each one, teach one.
— Phoenix FX Team 🔥🦅

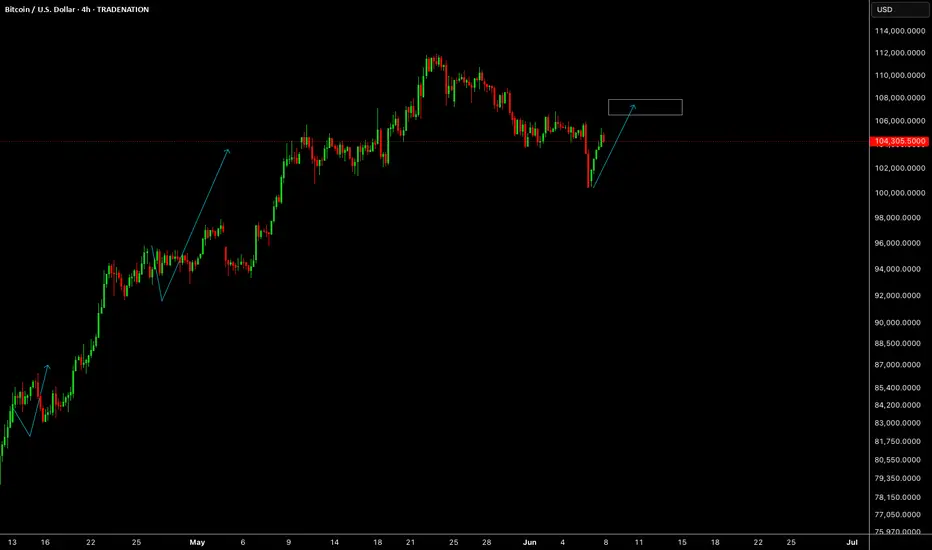
BTCUSD - Technical Setup Points to Renewed UpsideLooking at this Bitcoin/USD daily chart, the technical setup strongly favors upside continuation despite the recent pullback from the $113,000 highs. The cryptocurrency has demonstrated remarkable resilience by maintaining support above the $100,000 psychological level after its dramatic surge from the March lows around $60,000, representing an 80%+ rally that established a clear bullish trend structure. The current consolidation pattern around $104,000 appears to be a healthy correction within the broader uptrend, with the green arrow projection suggesting potential for further gains toward the $115,000+ region. Key supporting factors include the sustained break above multiple resistance levels, the formation of higher lows throughout the uptrend, and the relatively shallow nature of the current pullback compared to the magnitude of the preceding advance. While short-term volatility remains elevated, the overall momentum and trend structure indicate that buyers are likely to step in on any weakness, making a resumption of the uptrend the higher probability scenario.
Disclosure: I am part of Trade Nation's Influencer program and receive a monthly fee for using their TradingView charts in my analysis.

btcusd sell Scenario 2: SELL (Short Trade)
Trigger:
Price breaks below $105,498.93 (Support) with increased volume.
Rejection from $105,837.63 (Daily High) signals weakness.
Targets:
$104,900 (Strong Support)
$104,500 (Lower Range)
Stop-Loss: Above $105,837.63 (Daily High)
Rationale:
Failure to hold $105,700 could invite short-term sellers.
Low volatility and volume increase downside risks.

#202525 - priceactiontds - weekly update - bitcoinGood Day and I hope you are well.
comment: Full bear mode. Bulls still trying to make bears doubt it and we are not moving fast enough but we are also not making higher highs. We are close to my validation level for the bears, which is a daily close below 100k. I do think any print above 104k would invalidate my thesis. Targets for bears today/tomorrow are 98k and if we have enough momentum we see 90k.
We are still seeing bigger tails above daily bars which means bulls are trying but since are printing lower lows for two weeks, they are failing. Bears now need to move strongly below 100k and then we can start the acceleration down.
current market cycle: trading range until follow-through below 100k
key levels: 100k - 111k
bull case: Bulls are still hopeful, that’s why we are still above 110k but the next touch could break it and I doubt many will hold long or scale into new ones there. Best bulls can get right now is to go sideways for longer and stay above 100k. I mean… Staying above 100k is as bullish as it get’s if you be honest.
Invalidation is a daily close below 100k - next support below 100k is 98k and then comes 93k
bear case: Bears need to print below 100k and close below. That’s the whole story. Next targets below are then 98k and 93k, breakout-re-test prices. Until they achieve that, it’s slightly higher probability that we move sideways but this market won’t be able to hold above 100k if big indexes sell-off.
Invalidation is above 107k
short term: Bearish but could wait for confirmation below 100k. I doubt we get above 107k again and continue inside the range
medium-long term - Update from 2025-06-22: Daily close below 100k is confirmation. First target below 100k is 97k the breakout retest and after that is the 50% retracement around 93k. I have no bullish for the next weeks/months. Once the gap to 97k closes we are likely in a bear trend again and I expect to hit at least 85k over the summer.

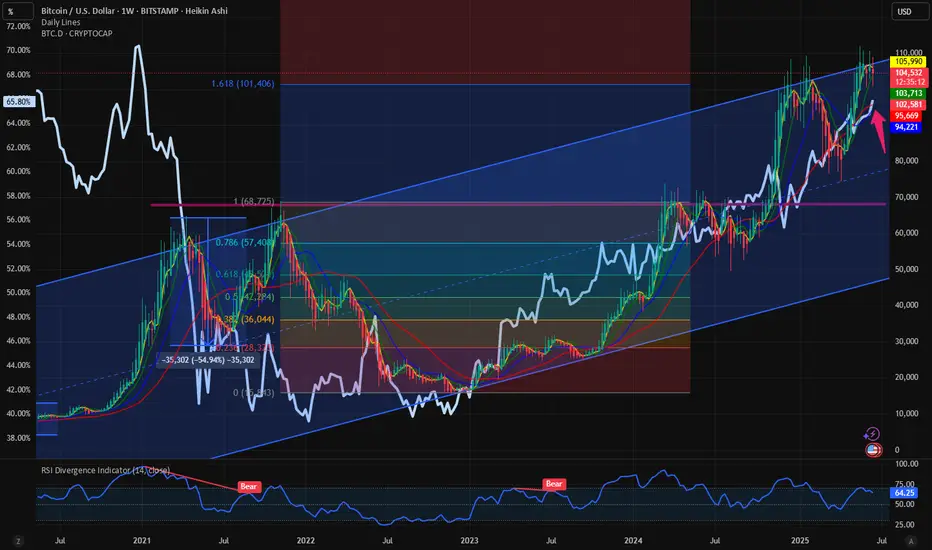
$BTC weathering the storm: $BTC.D close to 66%. $BTC to 160K. With all the volatility in the capital markets, Crypto is not immune to such swings. IN this space we have time and again analyzed the charts and have indicated that the best bet in the Crypto is to stay with CRYPTOCAP:BTC in these turbulent times. Even if CRYPTOCAP:BTC is above its previous cycle highs, this cannot be said about many altcoins like CRYPTOCAP:ETH , CRYPTOCAP:SOL , CRYPTOCAP:DOGE , CRYPTOCAP:LINK etc. A few days ago, on 15th June I wrote about the sloppy participation of CRYPTOCAP:TOTAL2 in case of an expanding $USM2.
CRYPTOCAP:TOTAL2 and ECONOMICS:USM2 : Correlation never broken. What now? for CRYPTOCAP:TOTAL2 by RabishankarBiswal — TradingView
Even if the ECONOMICS:USM2 is at an ATH CRYPTOCAP:TOTAL2 is still below its previous cycle highs. We asked the question what will CRYPTOCAP:BTC do if ECONOMICS:USM2 expands by 1-2T $. Even during the war and turbulent times CRYPTOCAP:BTC chart looks bullish as ever. It is still above its previous cycle highs; it is holding on to the psychological level of 100K $.
Now comes I think the most important chart in the crypto space is $BTC.D. The Dominance is currently above 65.5 %. Exactly here on 14th April we forecasted that CRYPTOCAP:BTC.D will go to 66%.
CRYPTOCAP:BTC.D to 66%, CRYPTOCAP:TOTAL2 / BTC down to 0.43 for CRYPTOCAP:BTC.D by RabishankarBiswal — TradingView
And again on May 20 I said the recent weakness in CRYPTOCAP:BTC.D is temporary and it will eventually reach 66%.
CRYPTOCAP:BTC.D : Have we seen the top or a local top in the CRYPTOCAP:BTC.D ? for CRYPTOCAP:BTC.D by RabishankarBiswal — TradingView
So where do we stand today. We are closer to 66% than to making a new local low. At 65.7% the path of least resistance is towards upside. And the USD valuation of CRYPTOCAP:BTC faces some resistance to breaking out of the upward sloping parallel channel which we have been following for the last few months. Currently the resistance level is 107K $ and we got rejected there.
Verdict : CRYPTOCAP:BTC.D goes to 66%. CRYPTOCAP:BTC consolidates here and 160K as Cycle top target.