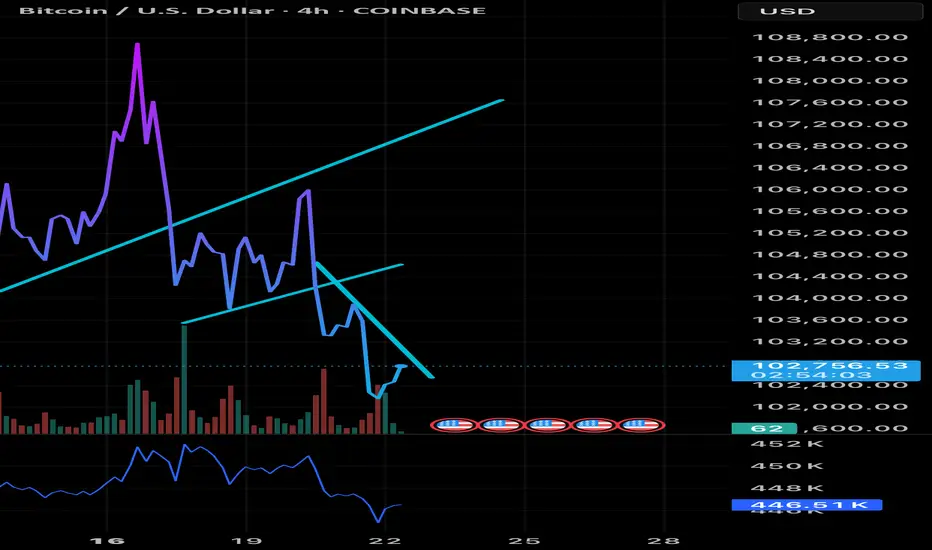
BTC had break down the 4H trend line Time for long term shortTrend line had been broken down not only once but more than 1 time shows a strong bearish bias momentum with strong volume
Which confirmed by retest the resistance twice and failed to break it out and the pressure still on the downward momentum after several attempts to push higher and successfully pushed down-so set your short positions SL above 105,600 to avoid any wicks attempts
Entry 102,600. / 102,800
SL. 103,600
TP1 @. 101,220
TP2 @ 100,250
TP3 @ 99,550
Runners to hold if you wish 98,500
Wish for all best of luck and well managed Trade setup , enjoy the trend movment
BTCUSD.PI trade ideas
BTC/USD Testing Channel Support – Bullish Rebound in Sight?Bitcoin is currently testing the lower boundary of the descending channel around the 101,844 support level. A strong bounce from this level suggests a potential bullish correction in the short term.
As long as the price holds above this key support, a move towards the next resistance levels at 103,449 and 104,411 remains likely. However, a clear break below 101,844 would invalidate the bullish outlook and resume the downward trend.
This setup offers a tactical opportunity for intraday traders to monitor price behavior around current levels.

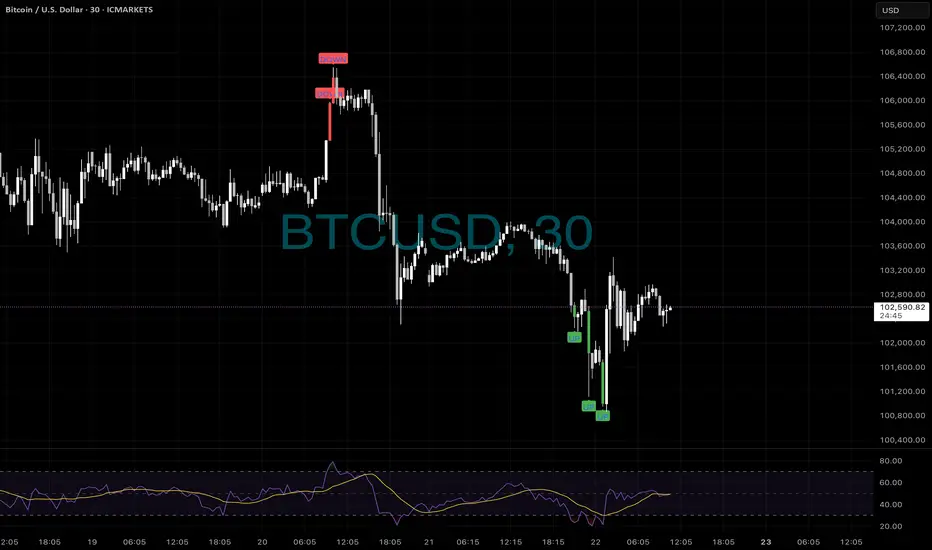
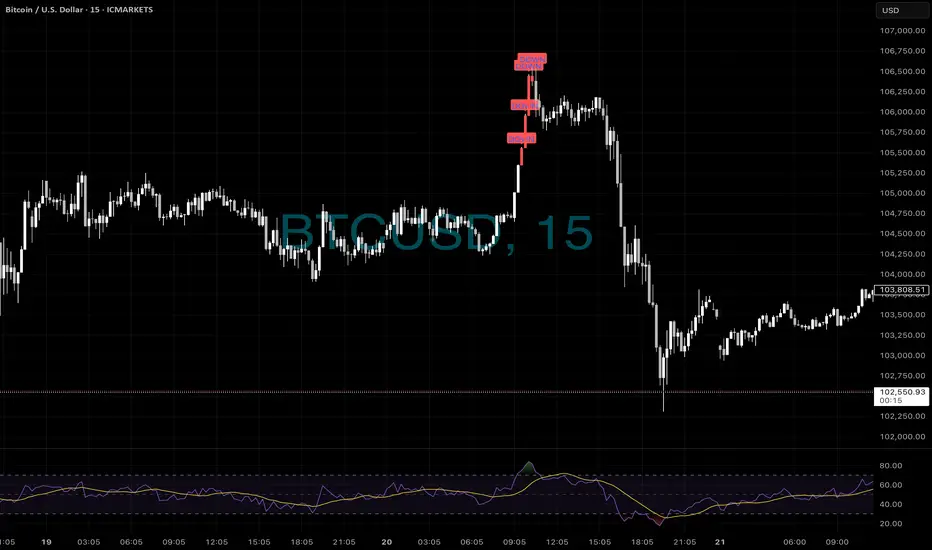
More BTC trades📊 BTCUSD 30m – Top AND Bottom Nailed with ELFIEDT
🔻 First, our system warned of a major top with double DOWN signals — just before the market dumped over 3,000 points.
🔼 Then, as panic set in, multiple UP signals printed near the low — before a clean reversal kicked in.
💡 This is the power of structured, data-backed reversals.
When price disconnects from value, and RSI confirms, our indicator steps in with laser precision.
🚫 No guessing.
🚫 No hype.
✅ Just consistently mapped turning points — visible in real-time.
🧠 If you’re still sitting on the sidelines or relying on lagging tools, it’s time to upgrade.
📲 Message us to get access and learn how to catch the turns, not chase the trends.
⸻
#BTCUSD #Bitcoin #CryptoReversals #ELFIEDT #RSIReversion #BTCSignals #CryptoTrading #BTC #TechnicalTrading #SmartEntries #TopAndBottom #NoLagJustEdge #ReversionStrategy #XReversion #BTC30min #CryptoEdge #TradingViewStrategies
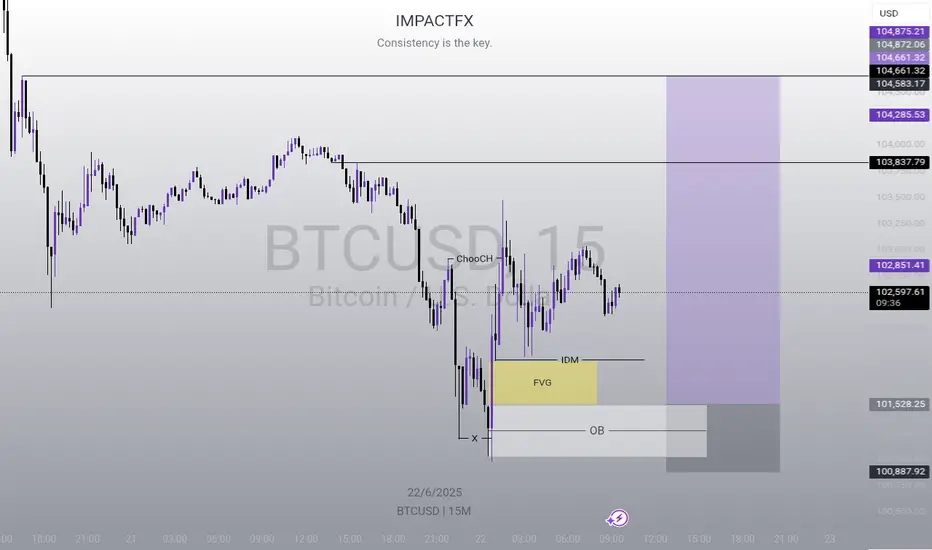
My analysis on BTCUSD I'm expecting a push to the up side from this zone marked on my chart. Please make your own research and if you're entering use a proper risk management
BTC - Also works💥 BITCOIN 15m – Top Sniped by ELFIEDT Reversion
This wasn’t luck. This was precision.
Just before Bitcoin tanked over $2,000…
🔻 Our indicator printed multiple “DOWN” signals right at the top.
🔁 RSI divergence confirmed fading strength — and the reversal was brutal.
📉 If you caught this with us, you already know:
When price is overstretched and RSI signals weakness, we strike.
No hype. No chasing. Just high-probability trades, marked in real time.
🧠 You could still be buying tops and hoping…
Or you could be trading with structure, confluence, and edge.
📲 DM us to get access to the full ELFIEDT system and start dominating crypto and indices alike.
⸻
#BTCUSD #BitcoinTrading #CryptoSignals #RSIDivergence #ReversionTrade #ELFIEDT #SmartTrading #TradingEdge #PriceAction #TopReversal #TradingViewIndicators #PrecisionTrading #BearishMomentum #XReversion #CryptoTraders #BTCShort
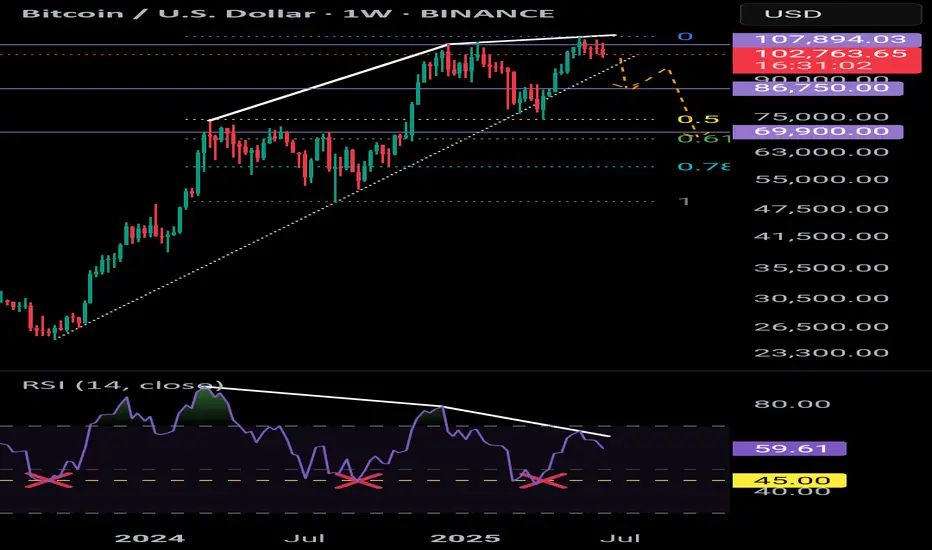
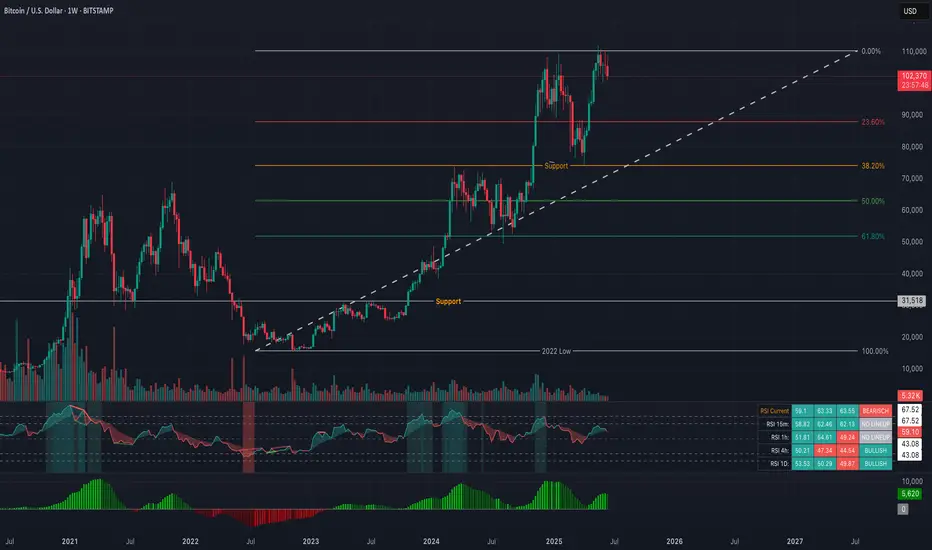
BTC - Macro RSI analysisHello 👋
Weekly TF
Bearish divergence currently playing out.
Observing the uptrend (dotted white line) we did see a brief break below this trendline in April. Another break could result in a correction to 67.5K - 69.9K price range which is the 618 fib and an area where price found resistance on multiple occassions.
Bitcoin has found support on the Weekly RSI @ 45 (yellow dashed line). I think if we lose this level we would see BTC moving into oversold territory.
The daily RSI was also recently "overbought".
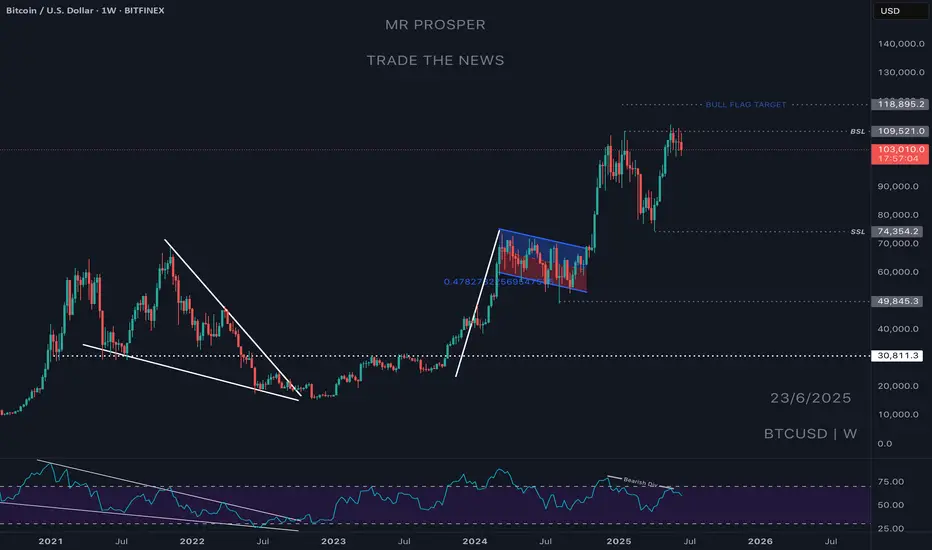
Bull Run Over, See you in 3 years Bitcoin Just took our previous resistance, and it's failing to displace or close above it; instead, it's rejecting and closing below it.
This to me signals a move to SSL and even lower prices for Bitcoin; I will be interested in Bitcoin around the year 2028.
Good bye crypto for now; I'm looking to stack up some funds until 2028 to buy cheap bitcoin around sub-40K levels.
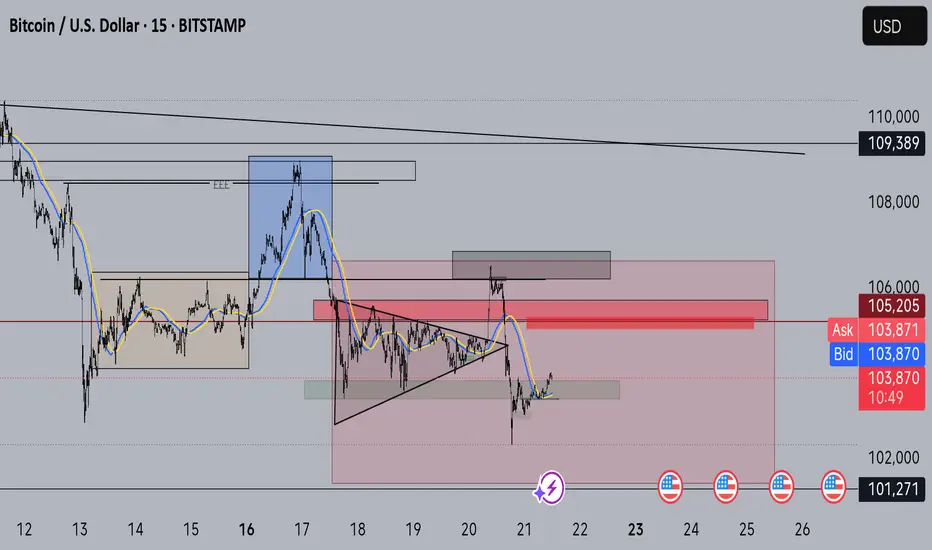
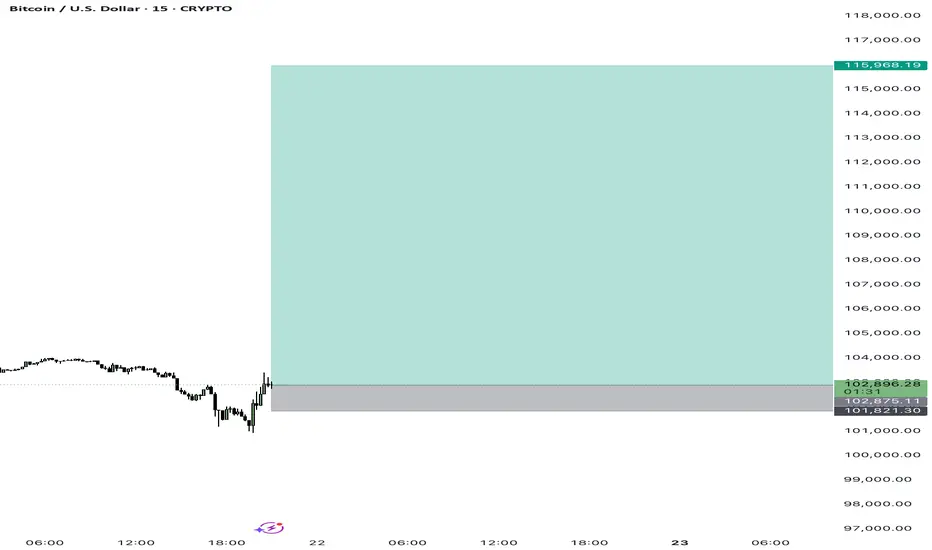
BTC Short-Term Reversal Possible from Key Support Zone – BullishBitcoin (BTC) is currently trading near a key horizontal support zone around $102,000, while still maintaining structure within a larger ascending channel pattern. After a period of consolidation and rejection from the channel resistance (near $110,000), price action appears to be attempting a bullish reversal from the lower channel boundary.
Technical Indicators: BINANCE:BTCUSD
Stochastic RSI (3,3,14,14)
Entered the oversold zone and showing a bullish crossover, suggesting a potential short-term reversal or bounce.
This crossover historically aligns with local price bottoms and upward momentum in BTC.
MACD (12,26,9)
The histogram is flattening and turning positive, and the MACD line is approaching a crossover above the signal line.
This is a classic early bullish signal that may indicate growing buying pressure in the coming sessions.
Chart Structure & Key Levels:
BTC is still respecting the ascending channel since late 2024.
The blue horizontal support near $102,000 has acted multiple times as a demand zone.
A blue arrow is placed to suggest a likely bullish move from this key level toward the top of the channel.
If support breaks down, the next strong horizontal support lies around $91,300.
Conclusion (Short-Term Bias):
Bullish signals from both momentum indicators support the idea of a short-term bounce or relief rally.
For confirmation, traders should watch for a daily close above $103,000–$104,000, which may trigger further bullish continuation toward $107,000–$110,000.
Risk remains if the price breaks below the ascending channel support; in such a case, downside targets are $97,000 and $91,300.
Note:
Traders may consider this as a "buy-the-dip" opportunity, but should wait for confirmation (e.g., bullish candle close, volume spike, or indicator confirmation) before entering. Proper risk management and stop-loss placement below the recent swing low are advised.

The influence of high-frequency data on price fluctuationsMajor Datasets for Price Trend Analysis: Types, Sources, and Applications
1. Financial and Market Datasets
Stock and Equity Markets:
Source: Bloomberg Terminal, Yahoo Finance, Alpha Vantage (API), Reuters Eikon.
Data Structure: Time-series data (daily/intraday prices, trading volumes, market capitalization) for stocks, indices (e.g., S&P 500, NASDAQ), and commodities (gold, oil).
Use Case: Analyzing stock price trends via technical indicators (MACD, RSI) or fundamental analysis, predicting market volatility using GARCH models.
Cryptocurrency Markets:
Source: CoinGecko, CoinMarketCap, Binance API, Kaiko (professional crypto data).
Data Structure: Real-time or historical price data for cryptocurrencies (BTC, ETH), trading pairs, order book depth, and blockchain transaction metrics.
Use Case: Studying price trends in decentralized markets, evaluating correlations with traditional assets, or developing algorithmic trading strategies.

Bitcoin Under Resistance: Neutral Core, Bearish Pressure.⊢
⟁ BTC/USD – BINANCE – (CHART: 4H) – (Date: June 22, 2025).
⟐ Analysis Price: $103,041.65.
⊢
⨀ I. Temporal Axis – Strategic Interval – (H4):
▦ EMA21 – (Exponential Moving Average 21-Period) – ($103,957.85):
∴ The current price is below the 21EMA, signaling weakness in short-term momentum;
∴ The slope of the moving average is negative, reflecting ongoing downward pressure;
∴ Recent attempts to reclaim the level were rejected, reinforcing its role as dynamic resistance.
✴️ Conclusion: The 21EMA acts as an active intraday resistance, and its breakout is a primary condition for any directional shift.
⊢
▦ EMA50 – (Exponential Moving Average 50-Period) – ($104,101.19):
∴ The 50 EMA remains above the price and the 21EMA, confirming a bearish trend alignment over the mid-term;
∴ The widening gap between EMA's suggests a well-established downward trend;
∴ A reclaim of both EMAs is required to revalidate bullish structure.
✴️ Conclusion: The 50EMA stands as a structural mid-term resistance, whose breakout would mark a tactical trend reversal.
⊢
▦ VPVR – (Volume Profile Visible Range) - (75, Up/Down):
∴ The POC (Point of Control) is concentrated around the $104,000 – $105,000 zone, just above the current price;
∴ This region reflects the highest volume concentration and tends to act as passive resistance or a redistribution zone;
∴ There’s a visible volume gap between $100,000 and $102,000, creating vulnerability to rapid price moves.
✴️ Conclusion: Price remains below institutional interest concentration, limiting upside potential unless volume reclaims the POC zone.
⊢
▦ BB – (Bollinger Bands - 20-Period SMA, 2.0 StdDev):
∴ The previous candle tapped the lower band and triggered a technical buy reaction (mean reversion);
∴ The mid-band aligns precisely with the 50 EMA (~$104,100), reinforcing confluence resistance;
∴ The channel shows slight downward expansion, suggesting volatility may continue to favor bears.
✴️ Conclusion: The recent bounce is technical relief; there is no structural reversal unless the price reclaims the mid-band.
⊢
▦ RSI – (Relative Strength Index) – (41.76):
∴ RSI is recovering from oversold territory but remains below the neutral 50 mark;
∴ The absence of a clear bullish divergence with price weakens the reversal thesis;
∴ RSI resistance lines sit between 45 and 50 – key levels that must be breached to confirm relief.
✴️ Conclusion: RSI signals technical relief, but still operates within a bearish zone — no clear evidence of dominant buying force yet.
⊢
▦ MACD – (Moving Average Convergence Divergence) – (MACD: –135.56 | Signal: –539.84):
∴ MACD line is crossing the signal line from below, generating an early bullish reversal signal;
∴ The histogram is contracting on the negative side, showing seller exhaustion;
∴ Readings remain deep in negative territory, requiring further confirmation.
✴️ Conclusion: MACD hints at momentum reversal, though structural validation requires a return to the positive zone.
⊢
▦ VOL – (Volume Bars):
∴ Volume increased significantly during the recent bounce, indicating reactive buyer demand;
∴ However, follow-through volume was not sustained — warning of potential bull trap;
∴ The absence of consistent volume undermines the durability of the bounce.
✴️ Conclusion: Volume shows reactive presence, but lacks sustained confirmation — recovery may be short-lived.
⊢
🜎 Strategic Insight – Technical Oracle:
∴ Bitcoin on the 4H chart is staging a relief move after recent sell-side pressure, yet remains below all key EMAs, under volume-based resistance, and without confirmation from momentum indicators.
∴ The structure is best defined as technical relief, not a confirmed trend reversal.
⊢
∫ II. On-Chain Intelligence – (Source: CryptoQuant & BGeometrics):
▦ Exchange Inflow Total - (All Exchanges) = (Latest Spike Zone ~103K):
∴ A recent uptick in Bitcoin inflows to exchanges is visible at local price levels, aligning with prior rejection zones;
∴ Increased inflows suggest potential intent to distribute, especially at resistance;
∴ Historically, such inflow patterns precede local price weakness or continuation of retracement.
✴️ Conclusion: Exchange inflow data warns of potential short-term sell pressure, supporting a cautious outlook near current levels.
⊢
▦ Funding Rate – (Binance Perpetual) – (Near Neutral to Slightly Positive):
∴ Current funding rates remain slightly positive but balanced, reflecting lack of directional conviction from leveraged traders;
∴ The absence of aggressive long bias reduces the risk of long squeezes but also suggests weak bullish momentum;
∴ Historically, neutral funding rates precede volatile expansions when followed by imbalances.
✴️ Conclusion: Funding rate indicates a neutral sentiment posture - not bearish, but lacking speculative bullish fuel.
⊢
▦ Open Interest – (All Exchanges) – (~$33.2B):
∴ Open Interest is elevated, marking one of the highest levels since April;
∴ The price is falling while OI remains high - a classic divergence signaling potential liquidation risk;
∴ This setup increases volatility probability and indicates the market is loaded with directional exposure.
✴️ Conclusion: Open Interest suggests a high-risk environment; either a cascade of liquidation or a sharp reversal is imminent.
⊢
▦ Realized Price – (Market: $103K | Realized: ~$47.5K):
∴ The gap between market price and realized price is vast, reflecting that most market participants are sitting on large unrealized gains;
∴ This positioning exposes the market to profit-taking impulses;
∴ The lack of compression between these metrics implies no capitulation is underway.
✴️ Conclusion: Market remains well above realized cost basis, implying latent sell-side risk and no evidence of fear-driven exits.
⊢
▦ UTXO Age Bands – (Realized Price by Age = 6m–3y clusters above $90K):
∴ Long-term holders (6m–3y) maintain positions well in profit, with realized values near or above $90K;
∴ No major movement from these cohorts detected — suggesting continued conviction or strategic dormancy;
∴ Younger UTXO bands are positioned lower, indicating recent accumulation remains underwater.
✴️ Conclusion: No signs of distribution from experienced holders — current structure favors hodler passivity, not capitulation.
⊢
▦ Miner Outflows – (Miner Transfer Volume Stable):
∴ Miner outflows remain stable, with no sharp spikes in transfers to exchanges;
∴ Implies no immediate operational selling pressure from mining entities;
∴ Miner behavior remains conservative, awaiting directional confirmation.
✴️ Conclusion: Miners are currently not a source of sell pressure, reinforcing structural equilibrium in supply flow.
⊢
🜎 Strategic Insight – On-Chain Oracle:
∴ The on-chain structure supports a technically vulnerable, yet fundamentally intact market; ∴ ∴ Exchange inflows and high Open Interest signal short-term caution, while the lack of miner selling, stable long-term holder behavior, and distance from realized price all point to no deep structural breakdown;
∴ Expect heightened volatility with directional resolution dependent on external catalysts or spot-driven pressure.
⊢
⌘ Codicillus Silentii – Strategic Note:
∴ Temporal framework reveals local reactive strength, but lacks structural realignment;
∴ On-chain flow warns of directional tension - neither resolve nor breakdown confirmed;
∴ Macro environment holds liquidity in suspension, awaiting a trigger;
∴ All vectors align under strategic ambiguity - stillness is not stasis, but anticipation.
⊢
𓂀 Stoic-Structural Interpretation:
▦ Structurally Neutral:
∴ The broader structure is intact - no systemic breakdown, yet no resumption of trend authority;
∴ Exchange inflows and high OI generate latent fragility, despite holder and miner resilience;
∴ The system holds - but without forward thrust, the architecture is stable, not ascendant.
⊢
▦ Tactically Cautious:
∴ Technical signals show reaction, not reversal - EMA's remain unbroken, volume is passive, RSI is capped;
∴ On-chain risk (inflows, OI) outpaces confirmation of strength;
∴ Action without structure is speculation - the trader must remain coiled, not extended.
⊢
⧉
⚜️ Magister Arcanvm (𝟙⟠) – Vox Primordialis!
𓂀 Wisdom begins in silence. Precision unfolds in strategy.
⧉
⊢

Bitcoin (BTC/USD) Technical Forecast🧭 Market Snapshot:
Bitcoin is showing signs of short-term weakness with price hovering around $102,800. The daily candle is forming an inside bar, suggesting indecision — typically a setup for a larger move ahead.
🔮 Forecast:
📅 1-Day Outlook:
BTC is expected to remain in a narrow consolidation range between $102,200 and $104,000. A breakout from this inside candle could push price toward $105K, but risk remains skewed slightly lower if support fails.
📅 1-Week Outlook:
With daily and 4H RSI trending under 45 and price below key EMAs, downside risk builds. If $100K fails, BTC may test the $98.5K zone, potentially down to EMA 144 near $96.5K.
📅 1-Month Outlook:
If BTC can base between $96.5K–$106K and reclaim the $105K resistance cluster, momentum may shift bullish. Until then, price action is likely to remain choppy and rangebound.
⚠️ Key Technicals:
Support Zones: $102,600 (EMA 55), $99,950 (EMA 89), $96,648 (EMA 144)
Resistance Zones: $105,000–106,000 (EMA 21/34 cluster)
Momentum: RSI < 50 across all timeframes → no bullish momentum yet
Volatility: Moderate, with ATR (14) = 2795
📌 Conclusion:
The bulls need a clear reclaim above $105K to regain control. Until then, expect range trading and possible tests toward $98K–$96K. Stay nimble, watch RSI and EMA reactions closely.

Bitcoin BUY by Market 102900-102450 SL: 101800 TP1&2:104250 110kBTCUSD
Buy By Market
102950-102450
SL: 101800
TP1: 104250
TP2: 110000
TP3: 116000
1% risk 💸
Bitcoin Trend AnalysisBITSTAMP:BTCUSD BINANCE:BTCUSDT COINBASE:BTCUSD INDEX:BTCUSD
BTCUSD trend shows multiple bearish indications.
- Monthly RSI bearish divergence. This is the 3rd monthly bearish divergence in the entire BTC history. The previous one was the ATH before the 2022 recession. BTC price dropped 70% in 2022.
- Weekly RSI downtrend.
- Weekly MACD downtrend.
- Weekly bearish momentum red candles and downtrend wicks.
If the history repeats itself and BTC drops 70% like in 2022, it will find its final support around 31,500, but we don't know for sure yet. Before that, a few key levels of support needs to be penetrated. 75,000 is a major support we need to watch for.
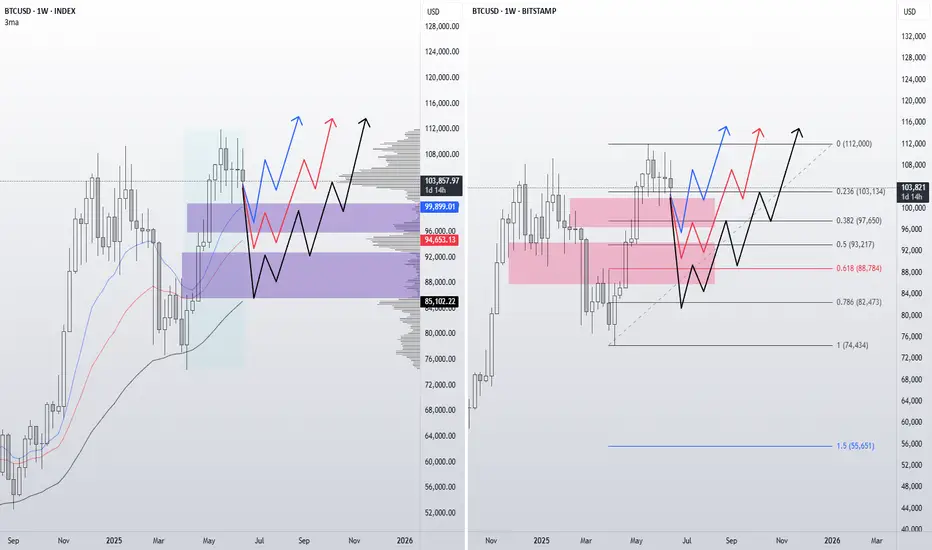
New 5 wave cycle?This is my idea for a new 5 wave cycle. Targets for each wave are in the chart. Could this be wave 1 of 5? Possible top for wave 5 in 2033 or around this time. After, our first real bear market, multiple years ( Maybe 5 or so)?

BTC USDT PLAN I favor a short-term pullback unless BTC can reclaim and close above the $111K–112K zone with strong volume.
If price breaks below $106K and confirms it as resistance, it could accelerate a move toward $100K and below.
Caution is warranted for bulls — this looks more like a distribution phase near the highs than a breakout.

BTC posibility if fundamental favoursBTC posibility if fundamental favours.
This baby has beenrushing downhill for afew days now.
As always, my thoughts are on the chart.
Please trade this RR of 1:1.69 with care
Bitcoin downside all but confirmed, sub 100k next- follow up analysis on this one:
- with the original analysis posted in late May, more than a month later and Bitcoin is still struggling near ATH levels
- with weekly bearish divergence now confirmed, odds of a downside move are very high
- Iran v Israel conflict acting as a strong headwind for all markets, should the USA get involved I expect that effect to increase tenfold
Needs to be said that a pullback to 90 or even the mid 80k region would still constitute a higher low on the very large time-frames. Structurally wise, as long as BTC is above 75k, the macro trend is still one of a bull nature.

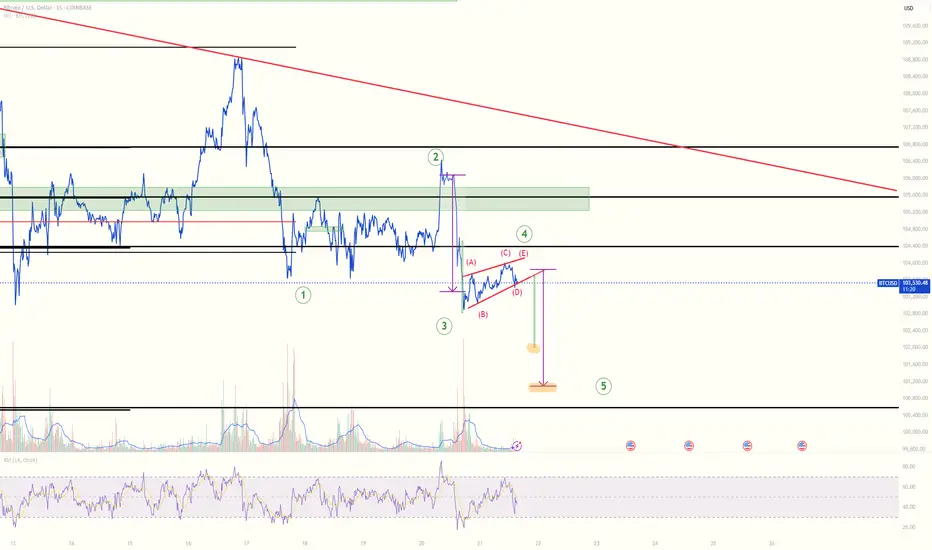
Short-Term BTC Short Setup Bitcoin is currently showing signs of completing a corrective wave (4) in a potential Elliott Wave structure. The current rising wedge (ABCDE) pattern suggests a likely short-term breakdown toward the $101,000–$100,000 support zone. This short position aligns with the ongoing short-term bearish momentum (wave 5 expected), but within a broader bullish trend. Long-term outlook remains positive, with the potential for a strong continuation upward once the correction is complete. ;D
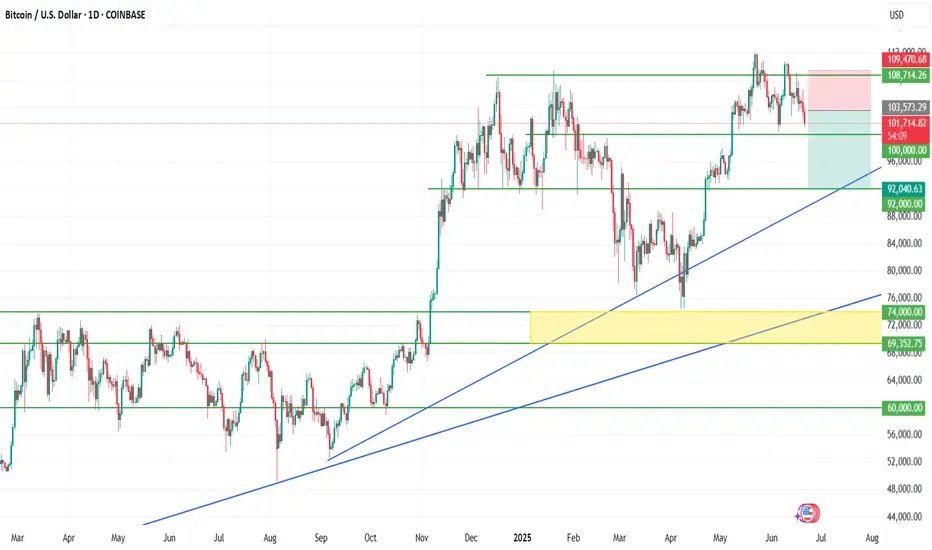
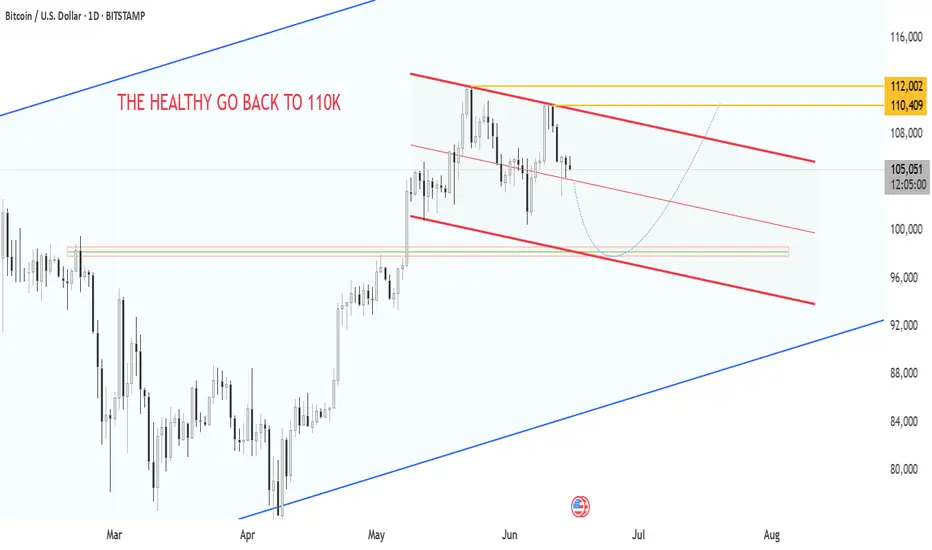
BITCOIN: The $110K Crossroads - Bull vs Bear Battleground! The Setup: "The Healthy Pullback Hypothesis
🔵 BLUE SUPPORT TRENDLINE (Rising from ~$76K)
The Foundation: This ascending support has held multiple tests
Current Status: Price dancing right on this crucial line
Psychology: Bulls' last stand
🔴 RED RESISTANCE CHANNEL (Descending from $112K peak)
The Ceiling: Two parallel resistance lines creating downward pressure
Pattern: Classic bearish channel formation
Volume Profile: Declining volume suggests exhaustion
🟡 YELLOW HORIZONTAL ZONES
Key Level 1: ~$98K (Previous resistance turned support)
Key Level 2: ~$112K (The rejection zone)
🟢 BULLISH SCENARIO (65% Probability)
Setup: Breakout above red channel resistance (~$108K)
🚀 Rocket Ship: Explosive move to $120K+
📉 Reality Check: Deeper correction to $95K-98K range
Entry: $97K - 98K (confirmed breakout)
Target 1: $104K
Target 2: $110K
Stop Loss: $95K
____________________________
⚠️ Risk Disclaimer: This analysis is for educational purposes. Always manage risk and never risk more than you can afford to lose. Markets can remain irrational longer than you can remain solvent! ⚠️
If BTC BullishIf I were a bull and perceived the current divergences to the main indicators as corrections, and not as a change in the market to bearish, then I would present support levels in this form.
In this form, where, as they say, all the stars came together.
Here are the gap levels, and EMA 13/26/52.
Fibonacci levels and mirror levels.
And three options in continuation of Bullish BTC.
Round and round, pick who you’ve found! ))
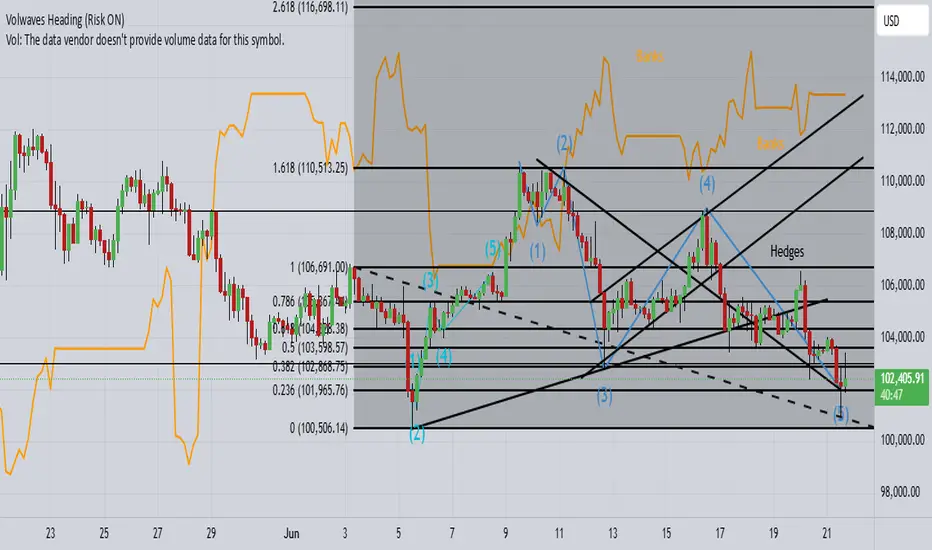
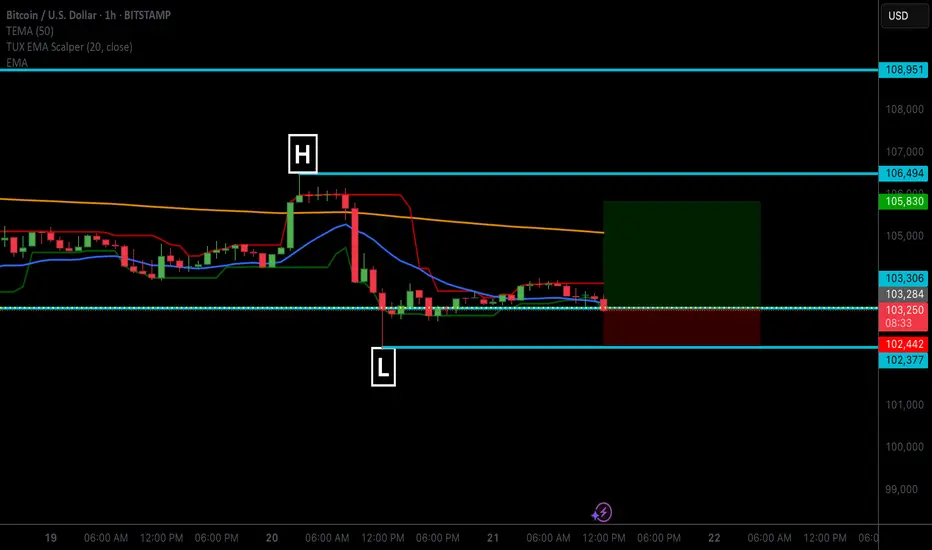
Bais.A.M.D: Accumulation Manipulation and Distribution.
H & S: Head and Shoulder
Accumulation.
BTC Accumulated Range 104139-106206
Manipulation
Manipulated Range 106247-109105
Forming a Head and Shoulder pattern.
Distribution
Currently in a Distribution phase.
After breaking below 106247 support to a low 102287. Heading to a Minor resistance range 105233-105731 for a more downside continuation below 102275.
IMO. DYOR