BTCUSD.PI trade ideas

BTCUSD Sell Setup – 4H Chart AnalysisEntry Zone: 103,061
🔹 Stop Loss: 105,120 – 105,095
🎯 Targets:
• TP1: 100,913
• TP2: 98,886
• TP3: 96,967
🔻 Analysis Summary:
Price recently broke a key support zone and is currently retesting it. A clean bearish rejection from this level provides a high-probability short setup. With clear risk-to-reward levels defined, this trade targets the next key supports.
🛑 Risk Management: Always use stop loss and proper lot sizing.

Trade Signal | Bitcoin (BTC) completed a setup for the next pumpHi dear members , hope you are well and welcome to the new trade setup of Bitcoin (BTC)
Recently we caught a nice trade of Bitcoin as below:
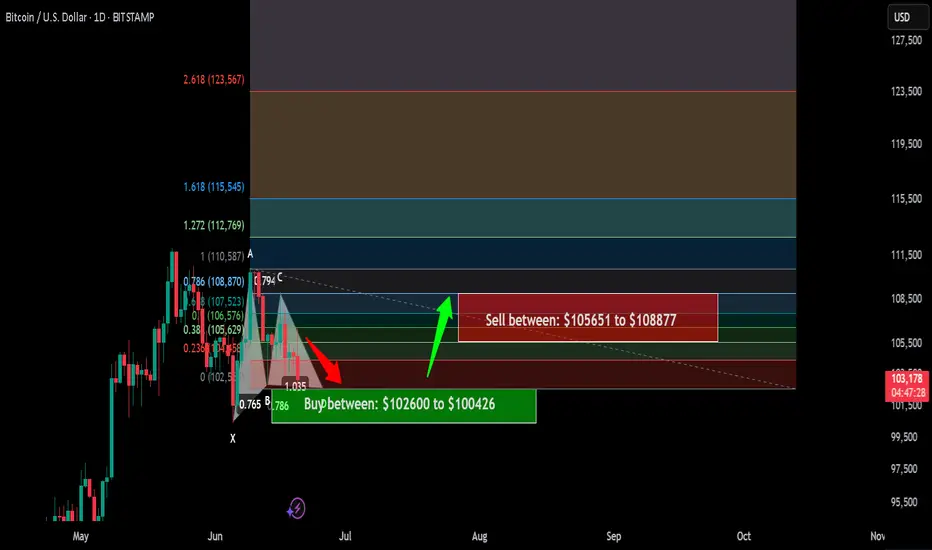
Now on a daily time frame, BTC has almost completed a bullish Butterfly move for the next pump.
Buy between: $102600 to $100426
Sell between: $105651 to $108877
Stop loss: Below $100426
Possible profit ratio:
As per above targets there is a profit possibility of upt 8% and a loss possibility is upto 2.50%.
Note: Above idea is for educational purpose only. It is advised to diversify and strictly follow the stop loss, and don't get stuck with trade.
BTC 1-hour .. Short Trade ActiveThought I'd post something. I have been doing a lot close door trading. Here's an inside peek.
Maybe the trade works?
Confidence shorting
#1 .. In a downtrend
#2 .. Momentum is still bearish
#3 .. Following Elliot Wave Leg #5
#4 .. Clear goals that are possible
Concerns
#1 .. Must Drop past recent LL
#2 .. Has all the right and power to Reverse
#3 .. Powell is speaking soon (this is nervousness)
I also wanted to see if "the feature of the Order" will show up in the Published Chart. What I mean is My Chart is showing the Trade.. and if I publish it.. will it show also?

Bitcoin Strategic Interval – Latency & Asymmetric Bias.⊢
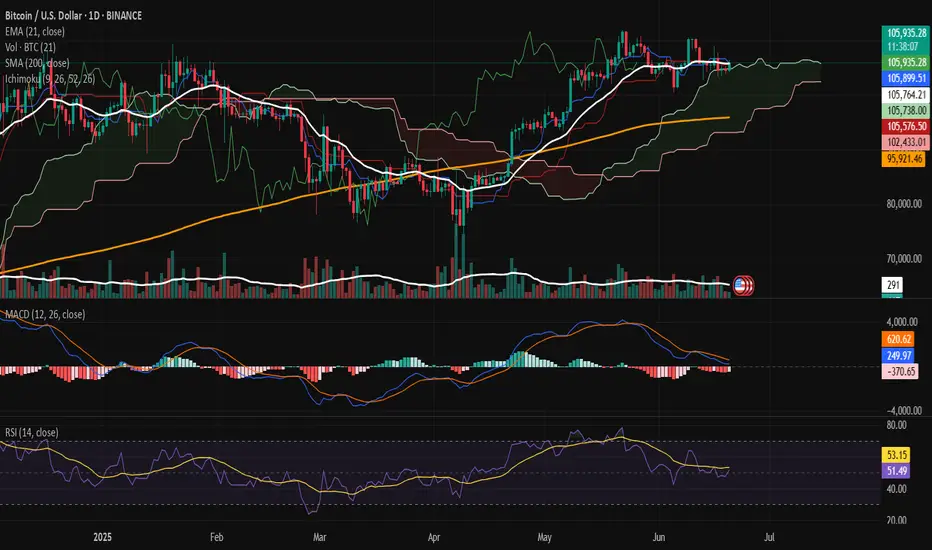
⟁ BTC/USD – Binance – (CHART: 1D) – (June 20, 2025).
⟐ Analysis Price: $106,025.88.
⊢
⨀ I. Temporal Axis – Strategic Interval – (1D):
▦ EMA21 – ($105,772.44):
∴ The price remains fractionally above EMA21, retaking the short-term reactive axis;
∴ Despite prior rejection, current candle shows renewed traction with a solid close above;
∴ The slope is flat–rising, signaling the potential reactivation of local trend continuation.
✴️ Conclusion: EMA21 is tentatively reclaimed – a short-term bullish signal under close scrutiny.
⊢
▦ SMA200 – ($95,921.92):
∴ Long-term structure preserved: price maintains a wide buffer over SMA200;
∴ The moving average exhibits a healthy upward slope, uninterrupted since Q4 2023;
∴ No technical threat detected to the macro-trend structure.
✴️ Conclusion: SMA200 acts as the primary institutional defense line. No stress present.
⊢
▦ Ichimoku Cloud – (105,899 | 105,738 | 102,433 | 105,576 | 106,025):
∴ Price is nestled precisely within the flat upper cloud band – a known zone of consolidation;
∴ Span A and B are beginning to flatten, suggesting temporary exhaustion of momentum;
∴ Chikou remains above price – confirming trend integrity.
✴️ Conclusion: Ichimoku signals a pause, not a break – directional clarity pending.
⊢
▦ MACD (12,26,9) – (Histogram: -364.87 | MACD: 257.20 | Signal: 622.06):
∴ Bearish histogram remains negative, but shrinking for three sessions;
∴ MACD line curling upward with initial convergence to Signal line;
∴ Reversal signal forming but not yet triggered.
✴️ Conclusion: Early signs of MACD cross; confirmation requires follow-through.
⊢
▦ RSI – (53.17 | Avg: 51.74):
∴ RSI reclaims neutral-positive zone, stabilizing above 50;
∴ Structure shows divergence fading, with momentum recovering slowly;
∴ Still far from exhaustion thresholds.
✴️ Conclusion: RSI favors the bulls with cautious optimism.
⊢
▦ Volume (Last 5 Days):
∴ Volume remains muted, averaging 110–120k Bitcoin/day;
∴ No aggressive buy or sell pressure confirmed;
∴ Current move lacks conviction – suggests passive spot activity.
✴️ Conclusion: Price is advancing without volume confirmation – fragility persists.
⊢
🜎 Strategic Insight – Technical Oracle:
∴ Structural trend remains intact and undisturbed on the macro scale;
∴ Short-term bullish reclaim of EMA21 within the cloud, but momentum and volume still lag;
∴ Absence of conviction demands validation from price action or macro catalyst.
⊢
∫ II. On-Chain Intelligence – (Source: CryptoQuant):
▦ 🝰 Exchange Inflow Mean - (MA7):
∴ Metric sits near historic lows (≈0.4 BTC), denoting multi-week suppression of inflows;
∴ Correlates directly with reduced sell-side pressure from whales and institutions;
∴ Price structure remains unchallenged by inflow spikes – consistent with strategic holding.
✴️ Conclusion: Absence of fear or distribution among large holders – bullish backdrop intact.
⊢
▦ 🜍 Estimated Leverage Ratio – (Current: 0.259):
∴ Leverage steadily increasing, now entering historical danger zone;
∴ Elevated risk of cascade liquidations on any sharp downside move;
∴ Suggests the current rally is not organically fueled by spot demand.
✴️ Conclusion: Price structure is leveraged, not grounded – risk of synthetic instability.
⊢
▦ 🝗 Exchange Reserves - (Binance) – (≈544.5K BTC):
∴ Continuous net outflows – multi-month drain confirmed;
∴ Reflects silent accumulation or self-custody migration;
∴ No exchange-driven supply pressure visible.
✴️ Conclusion: Structural supply depleting – passive bullish signal.
⊢
▦ ⚒ Miners’ Position Index - (MPI) – (-1.1):
∴ Readings below 0 indicate minimal miner distribution;
∴ Suggests miners are confident, or at least not forced to sell at current levels;
∴ Historically coincides with market support zones.
✴️ Conclusion: Miner behavior aligned with trend preservation – not resistance.
⊢
▦ 🜚 Funding Rate - (All Exchanges) – (+0.003):
∴ Rates mildly positive, indicating slight dominance of long positioning;
∴ No excessive funding imbalance – healthy sentiment baseline;
∴ Reflects controlled bullish bias with no speculative overheating.
✴️ Conclusion: Longs exist, but not in a way that endangers trend integrity.
⊢
🜎 Strategic Insight – On-Chain Oracle:
∴ On-chain metrics echo the technical chart: structurally sound, short-term vulnerable;
∴ Long-term holders remain disengaged from distribution behavior;
∴ The system is healthy, but carries hidden leverage that may trigger volatility.
⊢
⧉ III. Contextvs Macro–Geopoliticvs – Interflux Economicus:
▦ 🇺🇸 United States – Federal Axis & Risk Channels:
∴ Treasury Yield Curve remains slightly positive (+0.44%), removing short-term recession signal;
∴ 10Y yield elevated at 4.42% – reflects sustained inflation resistance and risk demand;
∴ Fed has signaled no rate cuts before September – QT policy remains;
∴ Speculative expectations for only 1–2 cuts in 2025;
∴ Trump administration signals potential military action in Iran, igniting geopolitical risk premium.
✴️ Conclusion: U.S. monetary regime is steady–tight; geopolitical volatility injects asymmetric risk into crypto valuations.
⊢
▦ 🇨🇳 China – Internal Stimulus & Soft Deflation:
∴ Industrial Production slows to +5.8% YoY – weakest in 6 months;
∴ Retail sales climb to +6.4% YoY due to stimulus programs ("618 event", consumption vouchers);
∴ PPI remains deflationary (-3.3% YoY), compressing industrial margins;
∴ Fiscal revenue down -0.3% YTD – signals internal fragility despite easing efforts.
✴️ Conclusion: China is applying targeted stimulus, but lacks decisive global impact – neutral crypto flow effect.
⊢
▦ 🇪🇺 European Union – Disinflation & Rate Reversal:
∴ HICP inflation falls to 1.9% – below ECB’s 2.0% target;
∴ ECB cuts deposit rate by 25bps – now 2.00%;
∴ PMI Composite remains below 50 – economic contraction underway;
∴ ECB forward guidance signals data-dependence and hesitation for further cuts.
✴️ Conclusion: Europe is easing rates amidst stagnation – weak driver for global risk flows.
⊢
🜎 Strategic Insight – Interflux Macro Oracle:
∴ U.S. tight policy + Iran tension = dual pressure point on risk assets;
∴ China’s mild stimulus is not yet globally inflationary – no volatility trigger;
∴ EU drifts silently – supportive, but irrelevant to Bitcoin in current configuration;
∴ Global system is stable in appearance, but tactically charged beneath – setup aligns with Bitcoin volatility potential.
⊢
IV. ♝ Market Sentiment - Media & Institutional Lens:
▦ The Block – Corporate Stockpiling Thesis:
∴ Ongoing accumulation of Bitcoin by public and private entities continues across Q2;
∴ Institutional wallets showing strategic DCA behavior – interpreted as positioning for either macro easing or geopolitical hedge;
∴ Unlike past cycles, no major corporate selloffs have been detected.
✴️ Conclusion: Institutional base remains in passive accumulation – potential catalyst insulation.
⊢
▦ CoinDesk – Sentiment Report – BTC at $92K Risk Threshold:
∴ Despite price climbing above $106K, analysts caution of technical rejection scenarios;
∴ Zones near $92K identified as high-liquidity, high-reaction clusters;
∴ Chart analysis frames current movement as vulnerable if macro catalysts turn hawkish.
✴️ Conclusion: Sentiment remains cautiously bullish but alert to correction windows.
⊢
▦ InfoMoney – U.S. Military Risk – Iran Strike Potential:
∴ Reported internal briefing of U.S. military planning toward Iranian targets;
∴ Trump’s media team leveraging geopolitical strength posture to influence sentiment;
∴ Markets (Dow Futures) showing pre-market decline on the headline.
✴️ Conclusion: Bitcoin holds narrative premium under geopolitical fear – but risk surge remains volatile.
⊢
🜎 Strategic Insight – Media Oracle:
∴ The crypto narrative is suspended between structural trust (institutional accumulation) and external fear (macro-political instability);
∴ Bitcoin presently benefits from asymmetric narrative positioning — but lacks transactional confirmation;
∴ Media flows suggest that sentiment will pivot swiftly if Powell’s tone confirms further hawkish stance or if Iran tension escalates.
⊢
⊢
⚜️ Magister Arcanvm (𝟙⟠) – Vox Primordialis!
⚖️ Wisdom begins in silence. Precision unfolds in strategy.
⊢
⌘ Codicillus Silentii – Strategic Note:
∴ The 1D reclaim of EMA21 inside the Ichimoku flat cloud reflects a market in suspended potential, where trend continuation and failure share equal weight;
∴ On-chain dynamics remain structurally undisturbed, yet veiled in a fragile layer of leveraged positioning;
∴ Exchange reserves continue their descent, detaching the market from traditional sell-side threat, but increasing reliance on thin liquidity zones;
∴ Macro vectors (Fed policy + Middle East tension) hover as dual shadows, capable of igniting volatility without prelude;
∴ Institutional accumulation remains active, but no longer decisive - the market awaits external ignition, not internal strength;
∴ Sentiment is asymmetrically bullish, yet explicitly unconfirmed in transactional volume and price aggression;
∴ The system is quiet - not because it is resolved, but because it is observing itself. This is a moment of ritual latency.
⊢
⌘ Market Status – Tactical Mode:
✴️ Strategic Position: “Structurally Bullish – Tactically Suspended”;
✴️ Primary Mode: “Observation Priority”;
✴️ Tactical Stance:
∴ No active positioning expansion without confirmation beyond Ichimoku flat zone;
∴ Watch for MACD confirmation and volume acceleration;
∴ Monitor geopolitical escalation and Powell’s tone – both capable of shifting structural balance.
✴️ Directional Bias: Neutral–Bullish, contingent upon validation;
✴️ Key Zone of Collapse Risk: $92,000;
✴️ Ascent Gate: $110,800 + (confirmation threshold).
⊢
BTC levels to watch for a breakoutMarkets are quiet, and Bitcoin is coiling. A potential breakout looms as we await the President’s Working Group crypto update by July 23. Will positive news trigger a rally to $121,000? Watch for key levels and triangle patterns.
This content is not directed to residents of the EU or UK. Any opinions, news, research, analyses, prices or other information contained on this website is provided as general market commentary and does not constitute investment advice. ThinkMarkets will not accept liability for any loss or damage including, without limitation, to any loss of profit which may arise directly or indirectly from use of or reliance on such information.

Market Shockwaves: DXY Surges, Gold Slips & Bitcoin Tests $100K This week delivered powerful market moves as the U.S. Dollar roared higher, gold struggled under macro pressure, and Bitcoin teetered on the $100K edge. In this must-watch market recap, we break down the key economic events, geopolitical tensions, and technical signals that drove DXY, XAUUSD, and BTCUSD — and more importantly, what it all means for the week ahead.
🔍 In this video, we cover:
✅ Why the dollar is rebounding and what’s fueling its strength
✅ The real reason gold is under pressure despite global risk
✅ Bitcoin’s next move: breakdown or bounce?
✅ Key levels and events to watch as we close out this week
✅ What traders and investors should prepare for next week
Whether you're a day trader, swing trader, or just watching the macro landscape — this recap gives you the edge.
👉 Don’t forget to like, comment, and subscribe for weekly insights!
#DXY #Gold #Bitcoin #MarketRecap #TradingInsights #MacroTrends #TechnicalAnalysis

BTC bouncing of Support. BTC bouncing of the 1D diagonal support line at $104k but needs to flip $106k to continue the rally , don’t see it happening until July .
BTCUSDbuying btc
sl 103,166
tp 110,578
1% risk on this trade
like an follow
note: if you like btc trading like me lets be friends, if your a new trader also
i will be down to be friends dont be shy

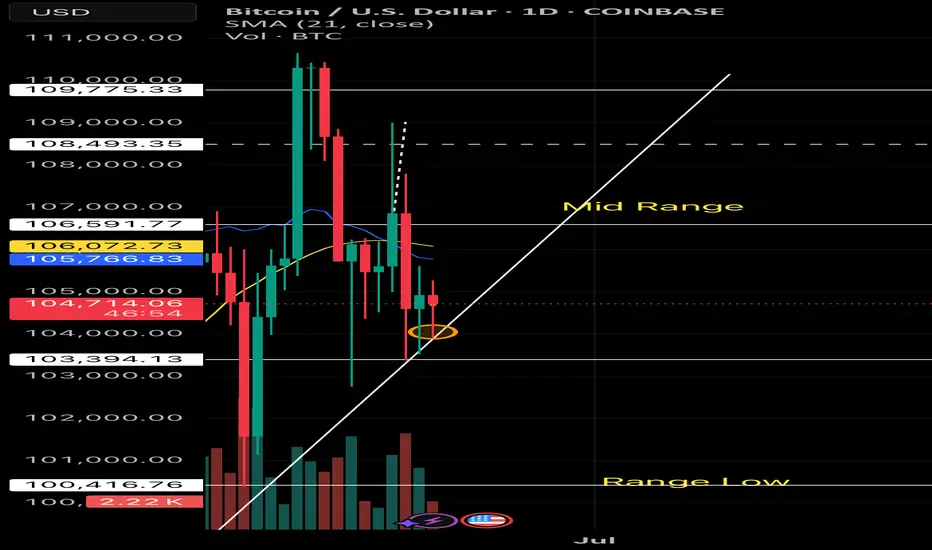
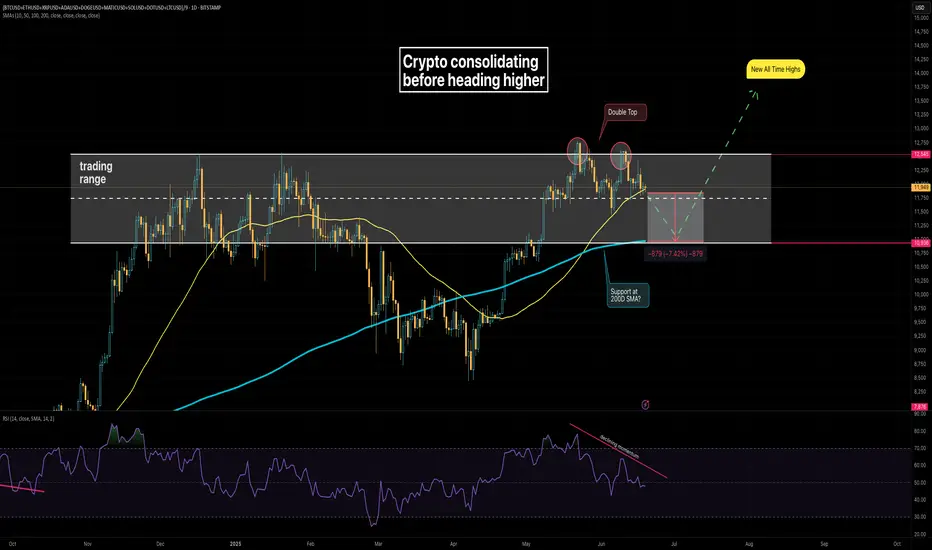
Crypto consolidating ahead of rally towards All Time HighsWith US equity markets closed for Juneteenth, I'm checking in on an equal weight basket of cryptos. Recently I said crypto looked to be heating up for a run at new highs.
As I look today, prices appear range bound on the daily chart. There's a bearish double-top formation, beside declining momentum. The bottom of the range resting at the 200 Day Moving Average, and a test of it seems likely.
Should there be a bounce off the 200 Day SMA, and a break through the top end of the range we might get a shot at those new All Time Highs.
BTCUSD – CME Gap Gravity & AVWAP Staircase🕯️ 4H Chart Analysis | June 19, 2025
🎯 Targeting: $93.3K CME Gap | Confluence: AVWAP zones + Structure breaks
Thesis:
We're currently hanging off the edge of a volume profile cliff. Price is coiled beneath a broken rising wedge, hugging the POC from the prior rally. The key idea: liquidity has shifted, and the next high-probability move is a breakdown through key VWAP levels into the CME gap at ~$93.3K.
📉 Funding Shift:
Funding remains slightly negative or flat across major venues — signaling late longs are trapped and paying to hold.
📊 Open Interest Still Elevated:
– Total BTC OI: $69.41B
– CME OI: $16.50B (23.77%)
– Binance OI: $11.67B (16.8%)
– Bybit OI: $7.66B
– OKX OI: $4.02B
– CME is now the largest BTC derivatives venue by notional OI — institutionals dominate this range.
– Despite the recent drop, OI only fell -0.6% (24h) system-wide — leverage still bloated and vulnerable.
💱 CME Basis Compression:
June front-month futures trade only ~$35 above spot — basis compressed to ~0.03%. Carry trade is gone; CME gap below is now magnetic.
🛡️ Macro Narrative: Credential Meltdown
Today marks the largest password leak in digital history (16 billion credentials). If this leads to broader cybersecurity fear, crypto might feel downstream de-risking effects.
📉 Spot vs. Derivatives Skew:
Derivatives OI/volume is high; spot demand remains muted. Suggests price is levitating on leverage — not sustainable without real buyers.
📍 Invalidation Levels:
– Short-term: 4H close above $106.6K = invalidates immediate breakdown setup.
– Macro: Weekly close above $109K with rising OBV = negates CME gap gravity.
✍️ Execution Logic:
If $103K breaks alongside a $500M+ OI flush → scale into short
TP1: $100.3K, TP2: $97.6K, TP3: $93.3K CME gap
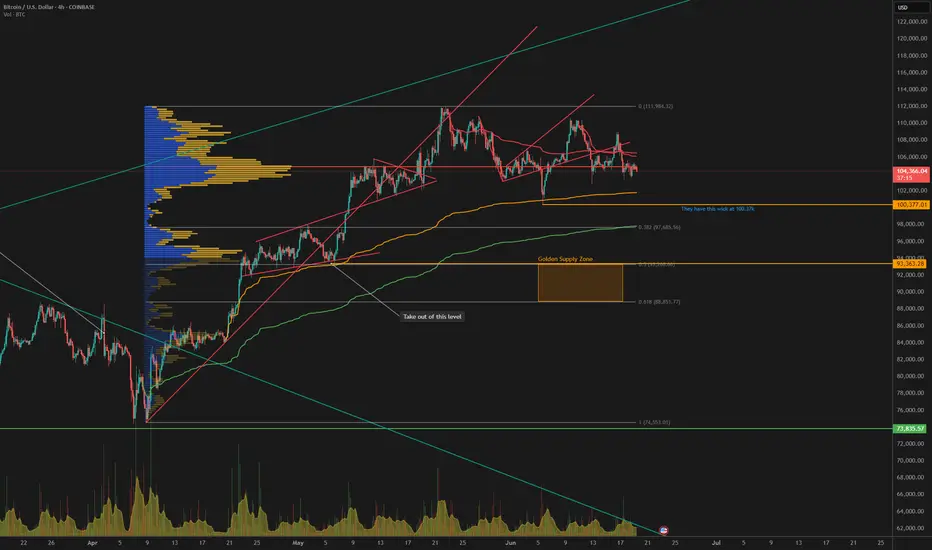
🟠 AVWAP targets:
- $102K (orange line) – currently being tested.
- $97.6K – Fib 0.382 zone + AVWAP cluster.
- $93.3K – CME Gap + “Golden Supply Zone” + Fib 0.5.
📉 Liquidity Logic:
- Shorts got squeezed early June — now the longs are stuck. Thin air below. If we nuke through $102K, the dominoes fall cleanly: AVWAP by AVWAP until CME gap closes.
Volume & Profile:
🟦 High-volume node just got pierced.
📉 We’re slipping below the POC — next major support is structurally far below.
Price Levels to Watch:
Immediate breakdown: $100.3K wick zone
Support fade targets:
🔹 $97.6K (Fib & AVWAP)
🟠 $93.3K (Gap)
🟢 $88.9K (Fib 0.618, possible overshoot)
Narrative Summary:
Shorts are gone, longs are sweating. This is the AVWAP death ladder scenario. CME gap acts like gravity when no major buyers step in. Until price reclaims above broken trend structure, every bounce is suspect.
CHECK BTCUSD SIGNAL READ CAPTANbtcusd buy now ✅
entry point (105000) (104800)
TAKE PROFIT 1: (105.300)
TAKE PROFIT 2: (105.800)
LAST TARGET (106300)
STOP LOSS (104300)

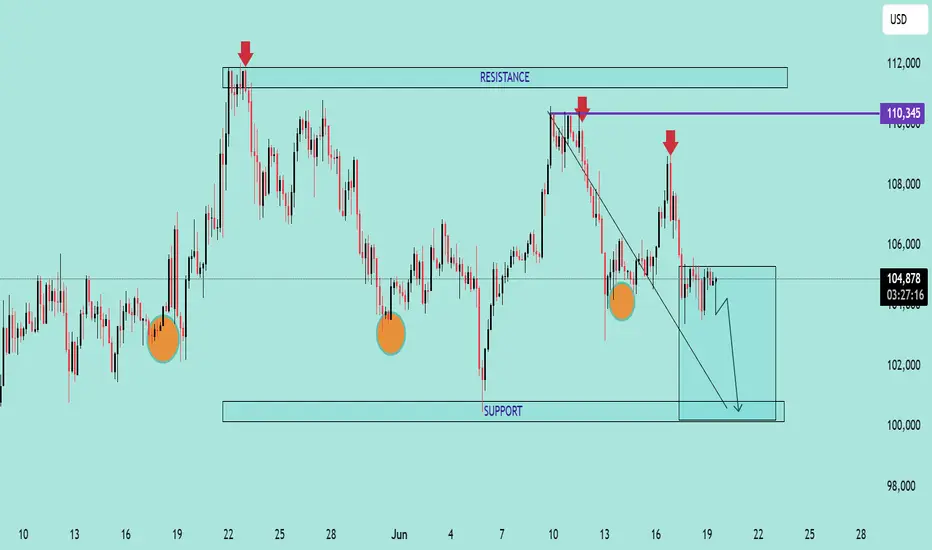
BTC/USD Bearish Outlook AnalysisBTC/USD Bearish Outlook Analysis 📉🧠
📊 Technical Overview:
The BTC/USD chart is showing signs of a bearish structure formation, suggesting increased downside momentum in the short term.
🔻 Resistance Zone:
Clear resistance is identified near $110,345, marked by multiple price rejections (🔴 red arrows).
Price failed to break above this zone several times, indicating strong selling pressure.
🔸 Support Zone:
Strong support lies near the $100,000 psychological level.
Price has respected this zone multiple times (🟠 orange circles), indicating buyer interest.
📉 Current Price Action:
A descending trendline breakout attempt failed and price is now consolidating just below $105,000.
Price is forming a bearish flag/consolidation structure after recent rejection.
A breakdown from the current box range is likely to push BTC toward the support zone at $100,000.
📉 Bearish Scenario:
If BTC breaks below $104,000, expect continuation towards $100,000.
A daily candle close below support could signal further downside.
📈 Invalidation:
Bullish invalidation occurs if BTC reclaims and closes above $108,000, with volume, retesting resistance at $110,345.
🧭 Summary:
BTC/USD is exhibiting a lower highs structure within a descending channel. Unless it breaks above the resistance zone, the bias remains bearish with a high probability of retesting support.
The GENIUS Act: A Historic Breakthrough in Stablecoin RegulationIn the fast-evolving world of cryptocurrencies, stablecoins have carved out a unique role, acting as a bridge between digital assets and traditional finance. Until recently, however, the regulatory framework for these instruments remained fragmented and unclear. The adoption of the GENIUS Act marks the first major step toward establishing a coherent regulatory system for stablecoins in the United States — an event already being hailed as a historic breakthrough.
What Is the GENIUS Act?
The GENIUS Act (short for "Guaranteeing Effective National Incorporation of Ubiquitous Stablecoins") is a legislative initiative designed to set clear rules for the issuance, backing, and circulation of stablecoins. Its primary goal is to ensure transparency, stability, and security for users, investors, and financial institutions engaging with these digital assets.
The bill has received bipartisan support, demonstrating a broad political consensus on the need to bring order and trust to the digital asset market.
Why Is It a Breakthrough?
Before the GENIUS Act, the legal status of stablecoins existed in a regulatory "gray area." Issuing companies often faced uncertainty: were they subject to banking laws, SEC oversight, or fintech regulations? This ambiguity led to high-profile lawsuits, account freezes, and declining institutional trust.
The GENIUS Act introduces:
A licensing framework for stablecoin issuers, requiring 100% reserves in fiat currency or secure liquid assets
Mandatory audit and reporting standards, including independent verification and public disclosures
Clear separation between fiat-backed and algorithmic stablecoins, acknowledging their different risk profiles
Mechanisms for coordination with the Federal Reserve, paving the way for stablecoin integration into the broader financial infrastructure
Impact on the Market
The passage of the GENIUS Act has already had a ripple effect. Major issuers like Circle (USDC) and Paxos have expressed their readiness to comply with the new standards. Meanwhile, less transparent players are beginning to lose market share.
Institutional investors — including banks and asset managers — are increasingly viewing stablecoins as a reliable instrument for payments and capital storage. This growing confidence could be the key to the mass adoption of Web3 apps, decentralized finance (DeFi), and digital commerce.
Global Significance
The GENIUS Act also sets a precedent for other countries. Just as the U.S. once led the way in traditional financial regulation, it is now establishing benchmarks for digital assets. The EU, UK, Singapore, and others are closely analyzing the bill’s elements for adoption in their own jurisdictions.
Conclusion
The passage of the GENIUS Act represents a historic step toward crypto market maturity. It not only eliminates regulatory uncertainty but also lays the groundwork for sustainable digital economic growth. For the first time, stablecoins have a clear, institutionally recognized legal status — marking the transition from chaotic innovation to structured trust.


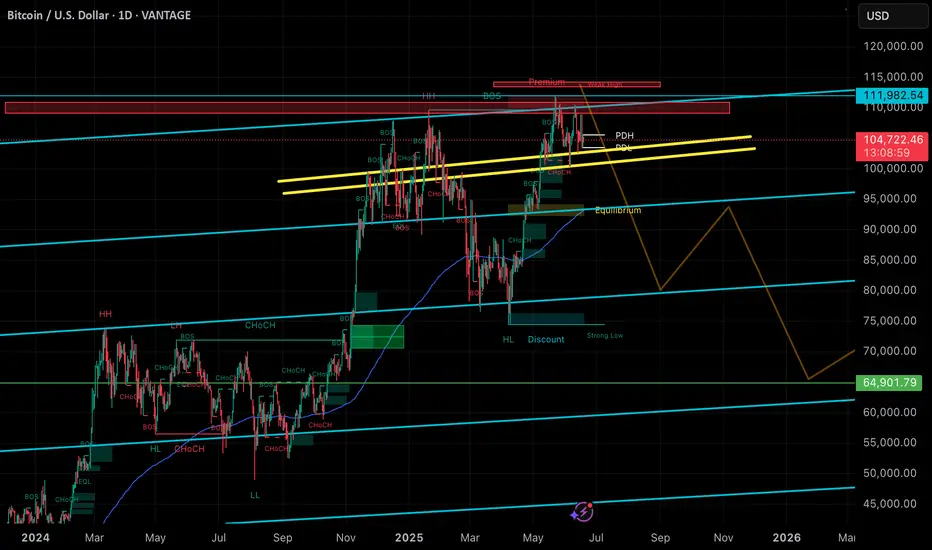
BTC Predictions for Q3 and Q4 for this year and early next yearI believe we have topped out on BTC, and we are waiting to grab liquidity at around 113-115k before we make a bottom to 65k.
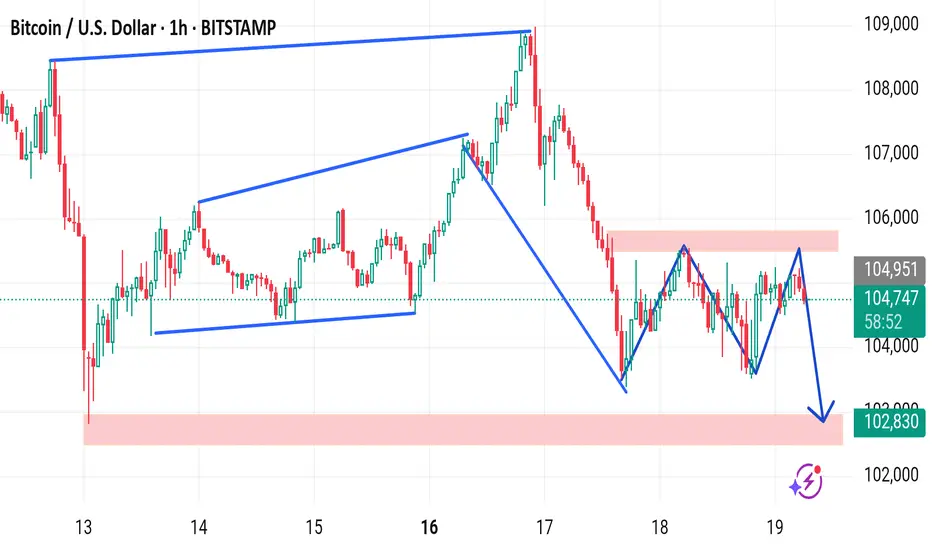
BTC market update 19 6 ,2025The chart you've shared is a 1-hour BTC/USD (Bitcoin to USD) chart from Bitstamp, and it illustrates several technical patterns and a possible bearish setup:
Key Observations:
1. Rising Wedge Pattern (Bearish):
From June 13–17, a rising wedge pattern formed (higher highs, higher lows, converging trendlines).
This pattern broke down sharply around June 17, which typically signals bearish momentum.
2. Bear Flag/Range Consolidation:
After the drop, BTC entered a sideways consolidation (highlighted in a red box), forming a rectangular range between ~104,950 resistance and ~102,830 support.
This could be interpreted as a bear flag or a distribution phase, suggesting continuation of the prior downtrend.
3. Bearish Projection:
The blue zig-zag line with the downward arrow suggests the analyst expects a break below the 102,830 support.
If this happens, further downside is likely. The measured move target could be projected from the height of the range (~2,100 points) below the breakdown point.
Summary:
Short-Term Bias: Bearish
Key Support: 102,830
Key Resistance: 104,950
Next Move: Breakdown below 102,830 could lead to a drop toward ~100,700 or lower, if the bear flag confirms.
Would you like a trading idea or stop-loss/take-profit suggestions based on this pattern?
Bitcoin extended cycle, $120,000-$140,000 next july-augustBitcoin looks like its gonna be a good summer imo, too much people say it will a boring summer and we top in oktober-dec but what if we top in august and drop 50%, and sep-dec will be correction month, and we continue the bullrun end 2025 till q1 2026 and we print a top in q1 2026,

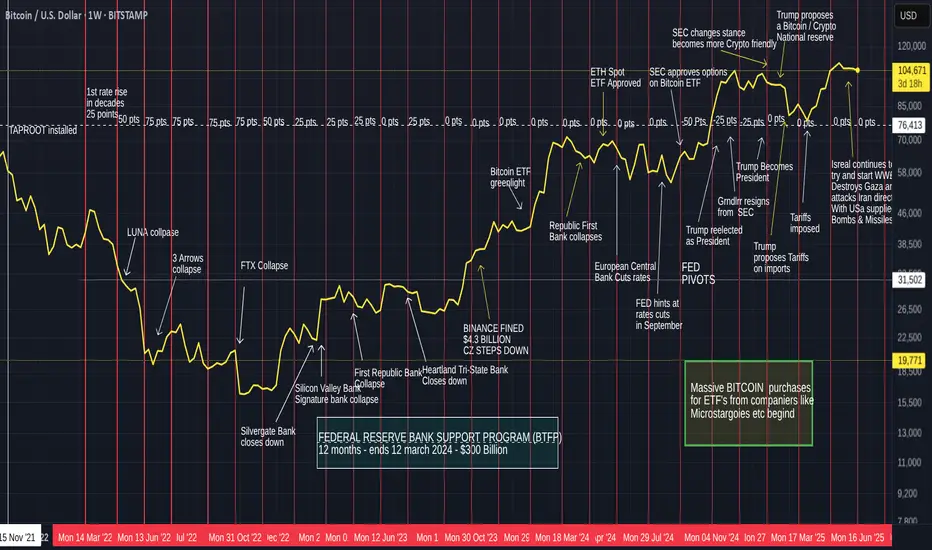
Bitcoin, Interest rates & Key fundamental points since 2021
The Growing question is just how much does the American Federal Reserve interest rate changes effect Bitcoin.
We can see how in 2022, it appears they did but from late 2022 and early 2023, it doesn't seem to.
Bitcoin began its rise even while rates were being put up.
The Fundimental Key points may have had more impact but again, there are moments were we can see something that should have been Great for BTC, had little effect and Visa Versa.
Has Bitcon Truly Broken away from being effected by the worlds "largest" economy ?
We are currently seeing the ever growing threat of WW3 and Rates being Kept artificially High by the US Fed Reserve. The EU Central banks has already reduced its rate twice while the USA remained with no change )
And Bitcoin remains stable.
And Bitcoins international adoption continues.
STACK SATS
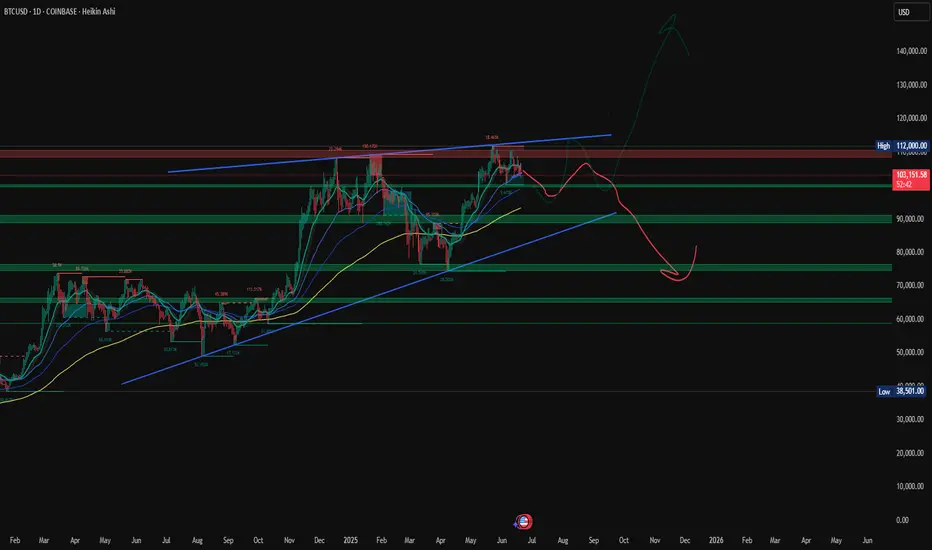
₿itcoin: SetbackBitcoin has come under selling pressure in recent hours. We cannot rule out that a deeper dip may precede the next leg higher into the upper blue Target Zone between $117,553 and $130,891. Once green wave B concludes in this range, we anticipate a wave C decline into the lower blue Target Zone between $62,395 and $51,323 to complete the larger orange wave a. From there, a corrective rally in orange wave b is expected, which should set the stage for a final leg lower to finalize blue wave (ii). Meanwhile, we’re still monitoring the alternative scenario (30% probability), in which blue wave alt.(i) is still in progress. In this case, BTC would stage an immediate breakout above resistance at $130,891.
📈 Over 190 precise analyses, clear entry points, and defined Target Zones - that's what we do.

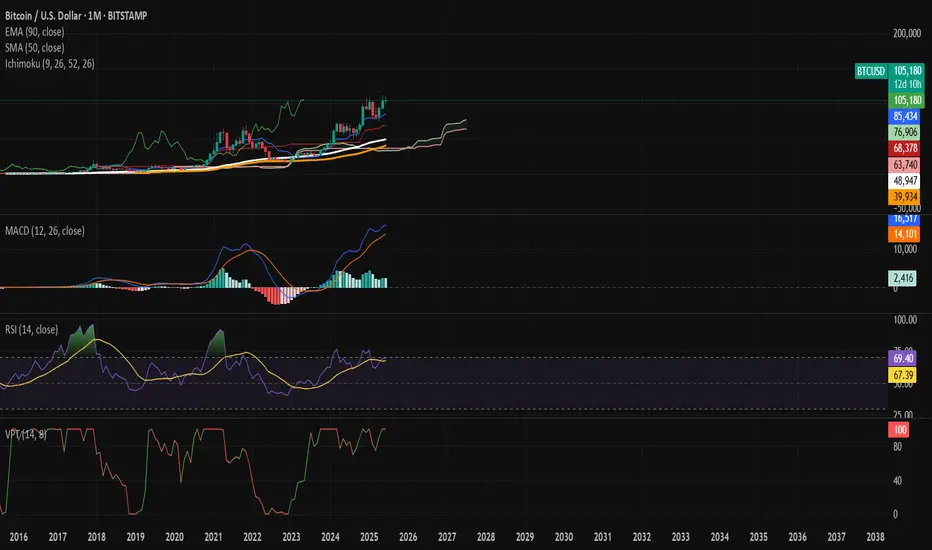
Bitcoin - The Elevated Cycle and the Silence Before Powell.⊢
⟁ BTC/USD – Bitstamp – (CHART: 1M) – (June 18, 2025).
⟐ Analysis Price: $104,044.00
⊢
⨀ I. Temporal Axis – Strategic Interval – (1M):
▦ EMA90 – ($39,909.00):
∴ Rising steadily, serving as long-cycle structural support since 2020;
∴ Price remains well above this average, with no signs of downward pressure;
∴ The positive slope confirms ongoing bullish macro structure.
✴️ Conclusion: EMA90 holds the foundational base of the long-term uptrend with ample buffer.
⊢
▦ SMA50 – ($48,924.00):
∴ Key axis of mid-to-long-term structure, validated by multiple touches during 2022–2023;
∴ Current price distance suggests technical room for retracement;
∴ Still rising with no sign of flattening or decay.
✴️ Conclusion: SMA50 confirms trend integrity, though overextension calls for caution.
⊢
▦ Ichimoku (Kumo & Lines) – (85,434 | 68,378 | 104,044 | 76,906 | 63,740):
∴ Price remains well above the Kumo cloud – full bullish confirmation;
∴ Tenkan and Kijun are aligned in bullish configuration, widely spread;
∴ Future cloud projects bullish momentum continuation.
✴️ Conclusion: Complete Ichimoku structure signals dominant cycle strength.
⊢
▦ MACD (12,26,9) – (2,344 | 16,426 | 14,083):
∴ MACD line remains above the signal, maintaining a monthly buy signal;
∴ Histogram shows mild expansion, but slower than previous bull cycles;
∴ Momentum is positive but decelerating.
✴️ Conclusion: Momentum remains intact, but peak cycle force may have passed.
⊢
▦ RSI (14) – (68.82 | MA: 67.35):
∴ RSI approaching overbought threshold, hovering near 70;
∴ Momentum is firm but shows resistance to further extension;
∴ Historical comparison to 2020 suggests possible ignition or exhaustion point.
✴️ Conclusion: RSI signals potential tension zone - breakout or reversal ahead.
⊢
▦ VPT (14,8) – (100):
∴ Volume Price Trend has plateaued at its max threshold;
∴ Lack of new highs despite price advance suggests fading directional volume;
∴ Often a signal of accumulation slowdown or redistribution.
✴️ Conclusion: Buyer strength may be waning beneath the surface.
⊢
🜎 Strategic Insight - Technical Oracle:
∴ Market structure remains bullish across all core indicators;
∴ Overextension from key moving averages and flattening momentum call for tactical caution;
∴ Any macroeconomic pressure could trigger a local top, without compromising the broader trend.
⊢
∫ II. On-Chain Intelligence – (Source: CryptoQuant):
▦ Realized Price & LTH – ($47,000):
∴ Market price is well above the realized price baseline;
∴ Indicates majority of holders are in profit — structurally bullish;
∴ However, this also creates a risk of profit-taking if confidence drops.
✴️ Conclusion: Strong support floor, but latent pressure exists.
⊢
▦ SOPR - (Spent Output Profit Ratio) – (1.013):
∴ Above 1 means active profit-taking;
∴ Downward slope shows this is starting to cool;
∴ Critical to monitor for a break below 1 - would shift dynamic.
✴️ Conclusion: Still healthy, but at the edge of distribution risk.
⊢
▦ NUPL – (Net Unrealized Profit/Loss) - (0.554):
∴ Unrealized profit remains dominant;
∴ Readings above 0.5 historically precede consolidation or pullbacks;
∴ Still distant from euphoric tops, but entering alert zone.
✴️ Conclusion: Market still in profit expansion phase - but under surveillance.
⊢
▦ MVRV - (STH vs LTH) – (STH: 1.0 | LTH: 3.1 | Global: 2.2):
∴ STH neutral, LTH moderately elevated but not excessive;
∴ Market is mature, but not overheated;
∴ Still in a zone that supports further upside with restraint.
✴️ Conclusion: Healthy balance between holders - no imminent top confirmed.
⊢
▦ CME Futures Open Interest:
∴ Sharp rise in open interest across expiry horizons;
∴ Sign of speculative leverage building;
∴ Historically correlates with volatile price action post-FOMC or macro events.
✴️ Conclusion: Liquidity pressure is rising - extreme caution warranted.
⊢
🜎 Strategic Insight - On-Chain Oracle:
∴ On-chain structure mirrors technical signals - strong trend, but cautious undertone;
∴ No major signs of reversal, but profit saturation could act as gravity if macro shocks occur;
∴ Market is exposed, not exhausted.
⊢
⧉ III. Contextvs Macro–Geopoliticvs – Interflux Economicus:
▦ Fed Chair Powell (Upcoming):
∴ Powell speaks today (June 18); core expectation is rate hold;
∴ Market bracing for hawkish tone: fewer projected cuts and emphasis on inflation resilience;
∴ Historically, Bitcoin has reacted with -2% to -5% dips to hawkish FOMC tone.
✴️ Conclusion: Macro tension peak. Powell’s tone may dictate the next 30-day candle.
⊢
⚜️ 𝟙⟠ Magister Arcanvm – Vox Primordialis!
⚖️ Wisdom begins in silence. Precision unfolds in strategy.
⊢
⊢
⌘ Codicillus Silentii – Strategic Note:
∴ The technicals are strong, the on-chain base is stable, and the macro setup is explosive;
∴ This is a tension point, not a resolution point - silence before decision;
∴ Precision now is not found in action, but in observation.
⊢
⌘ Market Status:
✴️ Position: " Cautiously Bullish. "
✴️ Tactical Mode: Observation Priority – No immediate entry without Powell clarity.
⊢
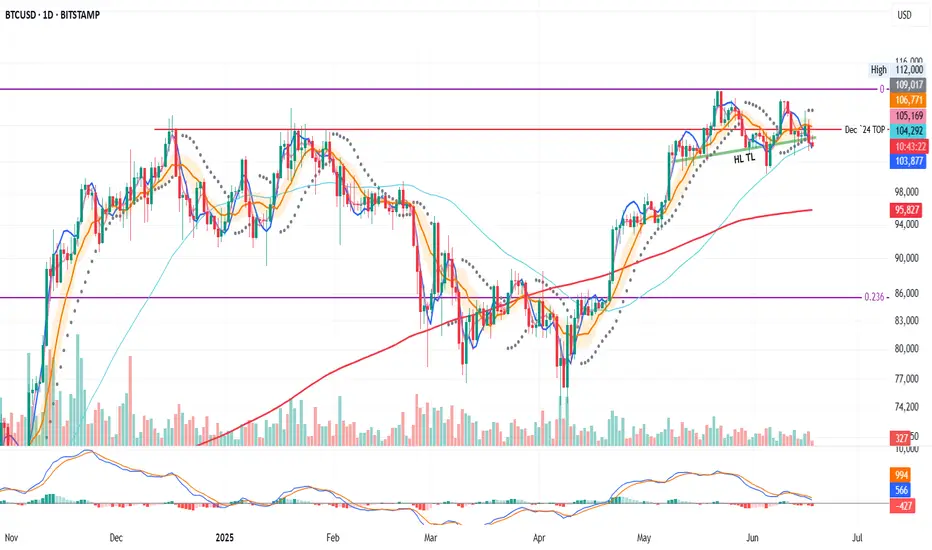
BTC on the Daily: Bearish Structure Locked In?So, on the daily, price is in a clear bearish context.
PSAR is bearish
MLR < SMA < BB center
We're about to close below the 50MA
Price already broke below the Higher Lows trendline and the December 2024 top
At this point, it all depends on the macro situation and the FOMC tone tonight.
If the outcome is positive, there's a chance price rebounds.
If not, the chart looks ready to dive.