Bitcoin - Trend Shift Confirmed, Eyes on $102.8K LiquidityMarket Context
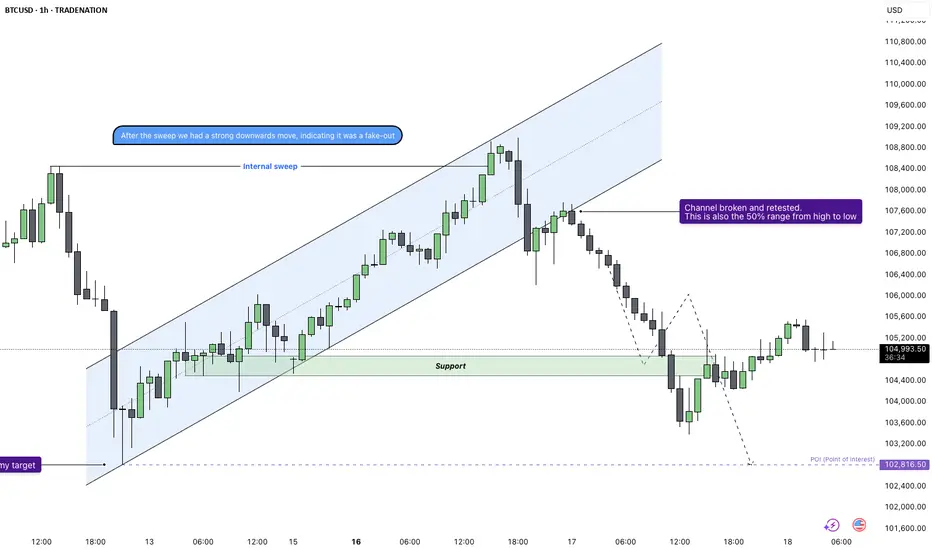
Bitcoin showed signs of exhaustion after a strong short-term rally within a clean upward channel on the 1H chart. Price action had been respecting the trend structure until a key deviation occurred near $108,500, where we saw an internal liquidity sweep that hinted at potential distribution.
Fake-Out Confirmation and Shift in Momentum
After taking out local highs around $108.5K, price failed to continue higher and instead reversed sharply, confirming the sweep as a classic fake-out. This kind of internal liquidity grab is typically used to trap breakout buyers before reversing and targeting previous lows.
Break of Structure and Channel Retest
The rising channel was broken convincingly, and price has now retested the underside of the channel, aligning with the 50% equilibrium of the entire high-to-low range. This reinforces the bearish bias and suggests the market has likely shifted from accumulation to distribution.
Downside Targets and Key Levels
Immediate support sits around $104.6K, which served as a consolidation base during the earlier run-up. If this level fails to hold, the next key target would be a sweep of the previous significant low at $102.8K. This area is marked as a point of interest and could offer a reaction or reversal.
Price Expectations and Trade Outlook
As long as price remains below the broken channel and under $107K, the bearish scenario remains in play. I’m watching for bearish continuation into $104.6K first, and a potential full sweep toward $102.8K if that support fails.
Conclusion
The internal sweep followed by impulsive rejection, combined with a clear channel breakdown and retest, shifts the bias to bearish. A move into the $104.6K region seems probable, with a lower liquidity target at $102.8K in sight if downside pressure accelerates.
Disclosure: I am part of Trade Nation's Influencer program and receive a monthly fee for using their TradingView charts in my analysis.
___________________________________
Thanks for your support!
If you found this idea helpful or learned something new, drop a like 👍 and leave a comment, I’d love to hear your thoughts! 🚀
BTCUSD.PI trade ideas
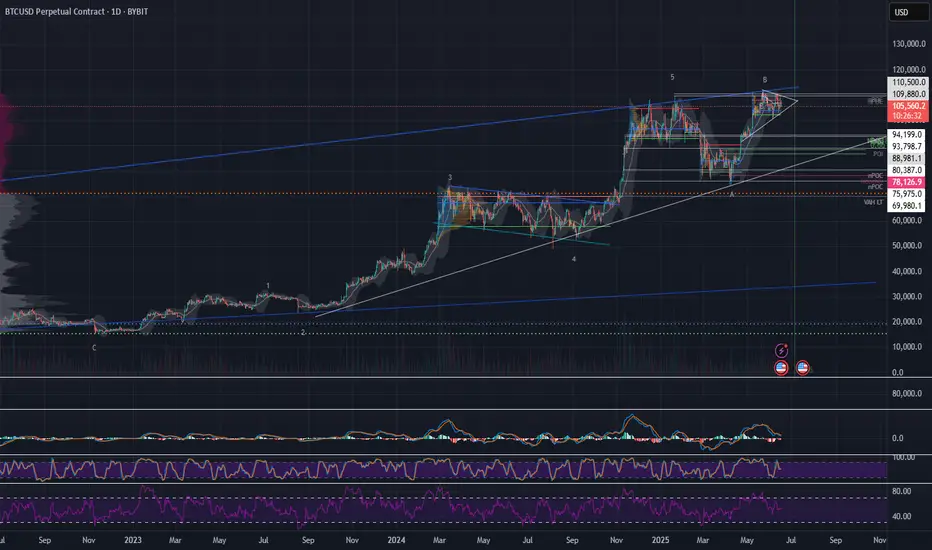
Bitcoin minor downtrend?B t c seems to be looking and a larger downttrend on a minor level.
Feed replacement fifty per cent around 93/94k..
100k down to wave 3 impulsive wave..4 and 5 up to 104k then last leg down two 93k?
BTC/USD Potential Bullish ReversalBTC/USD Potential Bullish Reversal 🟢📈
🔍 Technical Overview:
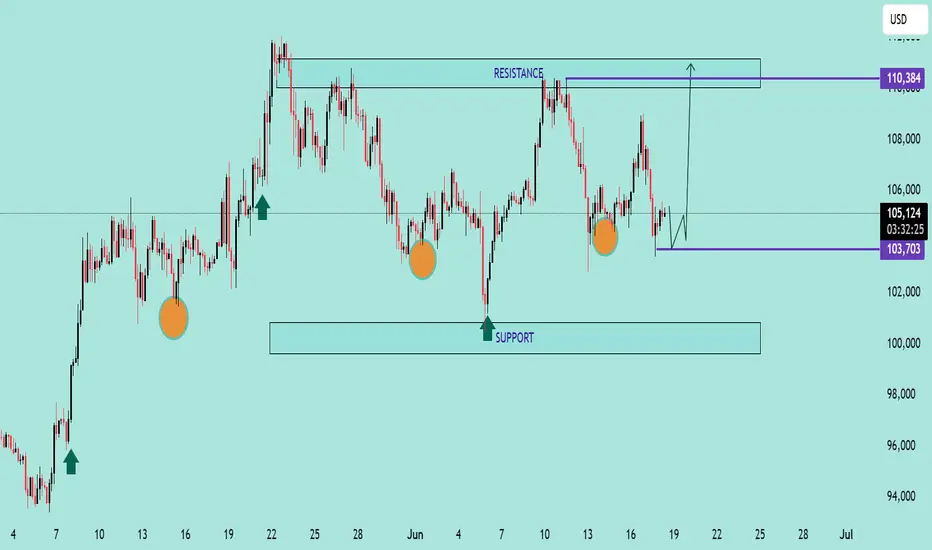
The chart shows a potential bullish reversal pattern forming near a key support zone. Price action has consistently bounced from the support range between $100,000 – $103,700, marked by multiple higher lows (🟠 orange circles), suggesting strong buyer interest.
📌 Key Levels:
Support Zone: $100,000 – $103,700 🛡️
Immediate Resistance: $110,384 🔼
Current Price: $105,202 💰
📊 Pattern Observed:
The price structure shows a possible inverted head and shoulders pattern forming, with the right shoulder currently developing. If this structure completes and breaks the $106,000–$107,000 neckline region, we can expect a bullish breakout toward the resistance target of $110,384 or higher.
📈 Bullish Confirmation:
Bullish rejection from support area ✅
Clean structure with repeated higher lows 📈
Potential breakout arrow suggests move toward the top resistance zone
⚠️ Watch For:
Price must hold above $103,700 to maintain bullish bias
Break below this level may invalidate bullish setup and retest the broader support zone near $100,000
📌 Conclusion:
BTC/USD is setting up for a potential upside breakout if the neckline is broken. Traders should monitor for bullish confirmation before entering long positions.
🔔 Strategy Suggestion:
Buy Zone: $103,700 – $104,500 (on bullish confirmation) 🛒
Target Zone: $110,000 – $111,000 🎯
Stop-Loss: Below $103,000 🛑

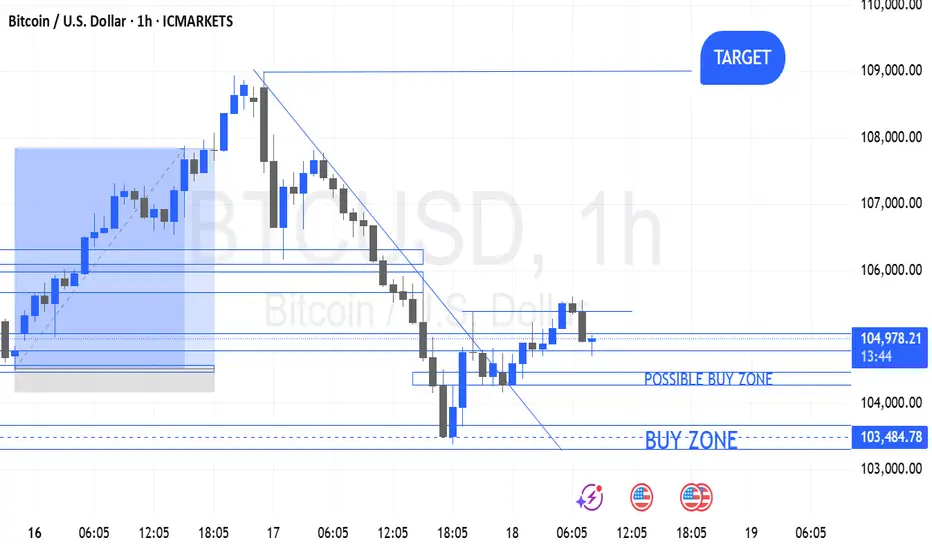
BITCOIN OUTLOOK FOR TODAYThose two zones are my possible buy entries for bitcoin today
Let's see how it plays out
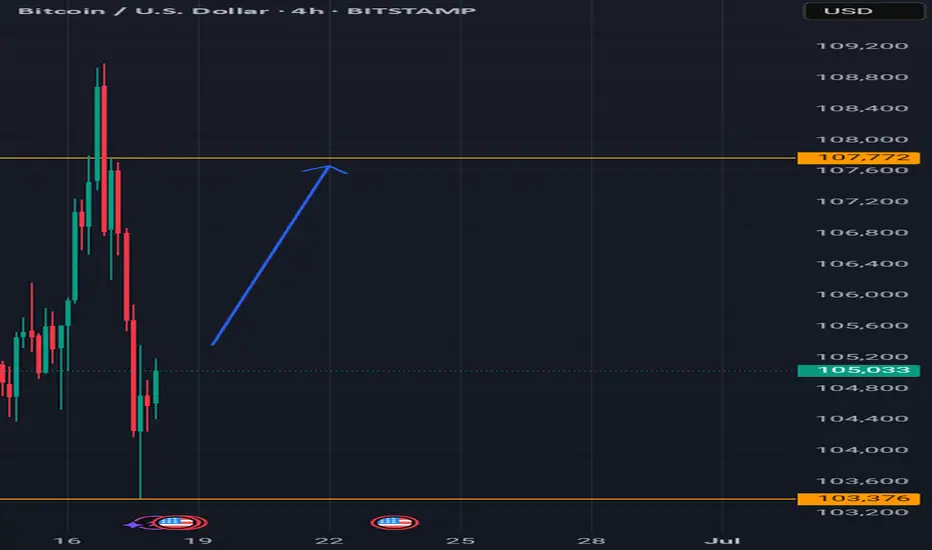
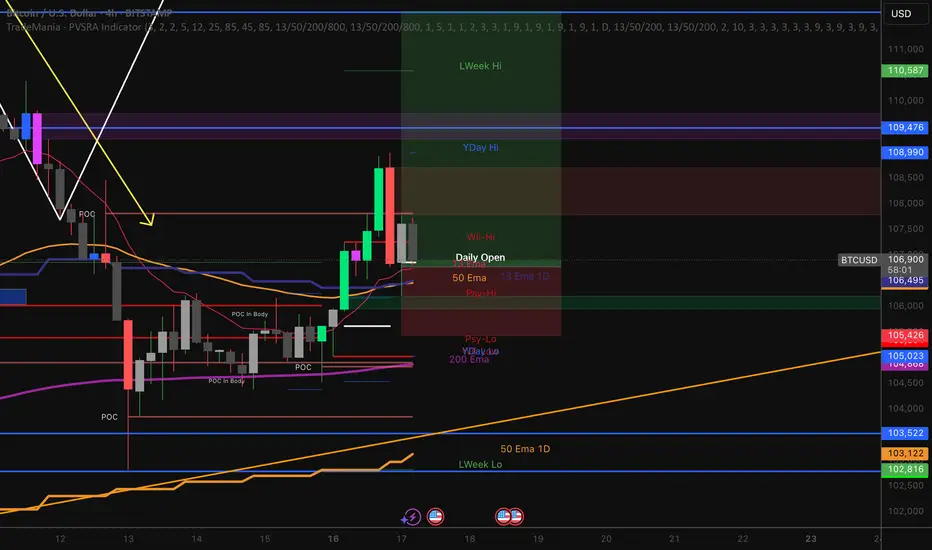
Bitcoin buying today Hi traders. Tonight is FOMC and Bitcoin daily candle opened above yesterday closing making it a clear buy for the day. My secret for FOMC is to analyse the market at 6h30 and start trading at 7h00 to catch the direction that FOMC is going to take as this happen every month during this event.
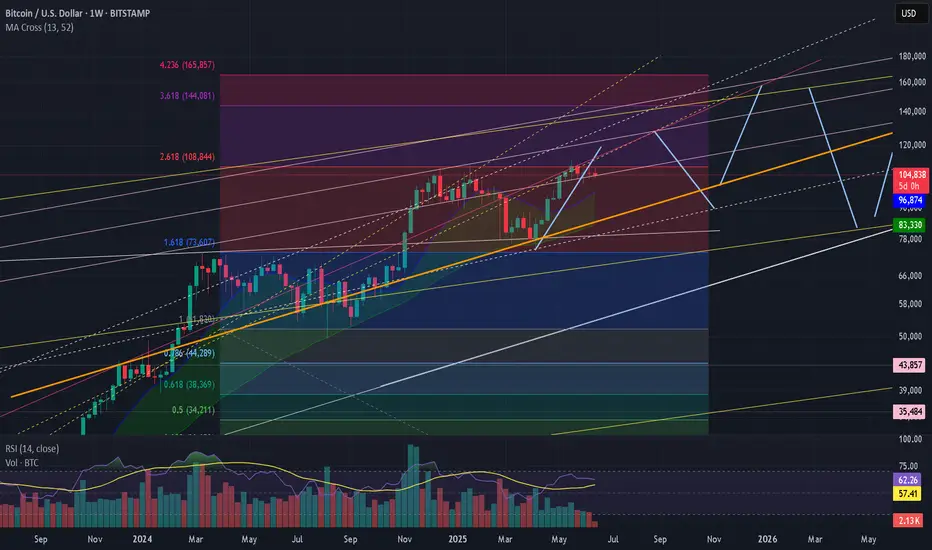
Targets in chart128k to 90k to around 160k
I think a lot of people will be caught on the wrong side of the trade once we head from 128k to 90k which will cause the price to move up fast once we bottom around 90k. Around 160k or so for this cycle top.
BITCOIN BEARISH DIVERGENCE CRYPTOCAP:BTC ,this is concerning me a little..markets can remain in an uptrend longer than expected so,im not calling anything in here but to be more positive about the outcome I would like to see new highs on price,supported by volume and a RSI breaking above previous peaks!

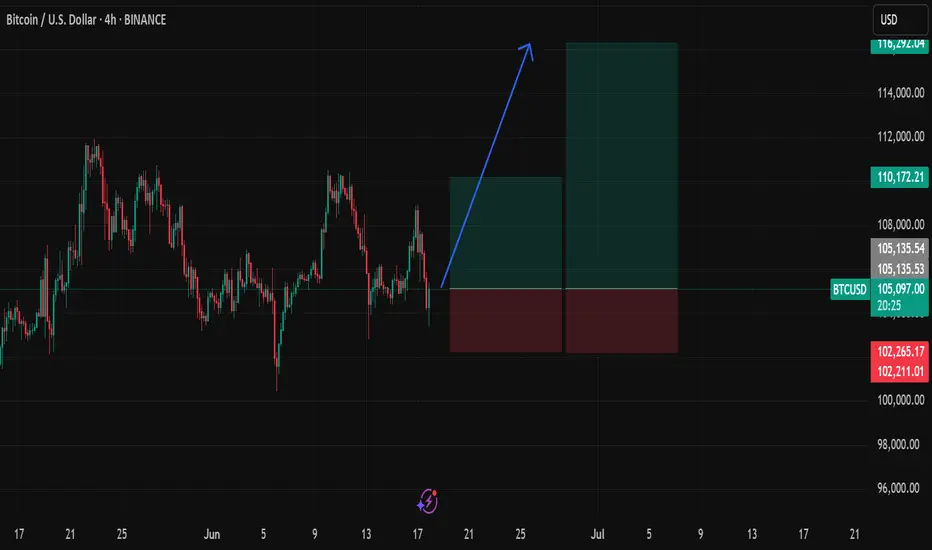
btc/usd good risk/reward bullish move!No need for words — just follow the arrow and check the risk/reward.
I'm starting a signal room soon, but for now, it's all free. Watch and decide for yourself.
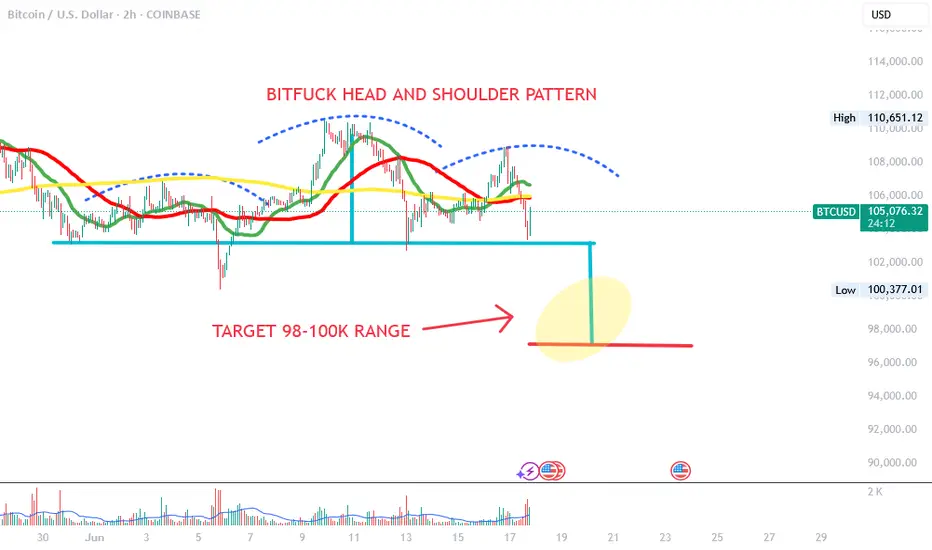
BITFUCK HEAD AND SHOULDER PATTERNHello everyone, here is my view of the current market, bitcoin has a head and shoulder pattern
good luck,
target : in the 98-100k range
greetings,
The Short Master
PS: see my other charts on my page, thank you
BITCOIN UPDATE: Not looking good for Bitcoin ladies and gentlemen . Its going down too fast and it just started the 1hr Bearish TIME Cycle, bears have plenty of TIME to do damage to the trend.
This is the drop that I was talking about the one that can cause serious damage to the trend.
Will see how it ends up at end of week.
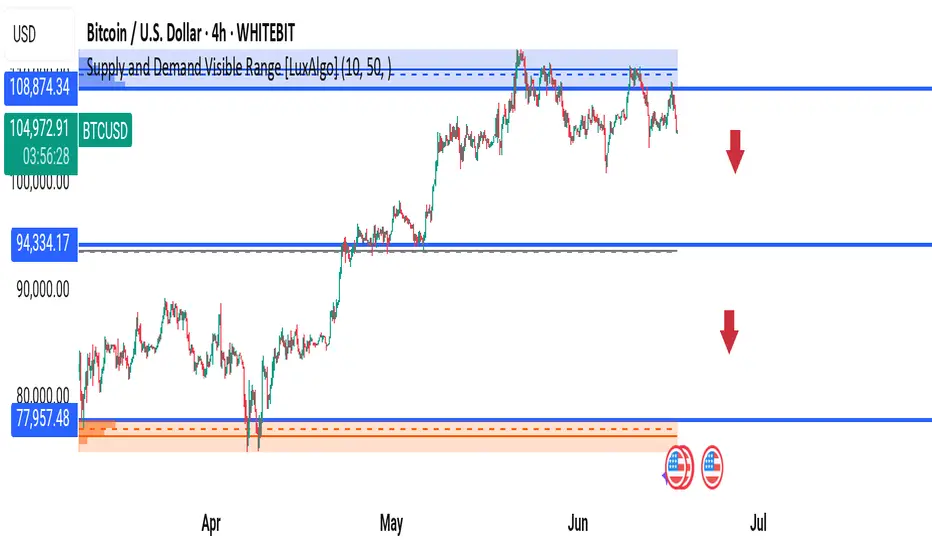
BTC/USD Analysis – Is the Pullback Just Beginning?Bitcoin has recently faced strong resistance at the $108,874 zone, a high-volume supply area identified by the LuxAlgo Visible Range. Price was rejected sharply, and now BTC is trading at $104,746 after a -1.32% move down.
---
🔍 Technical Breakdown:
🟥 Supply Zone:
$106,800 – $108,800
Price has tested this area multiple times but failed to break above it.
🟦 Key Support Zones to Watch:
1. $94,334: Mid-level support; if broken, it confirms bearish strength.
2. $77,957 – $80,000: Strong demand zone; potential reversal or consolidation area.
📉 Bearish Signals:
Lower highs forming after rejection at resistance.
Red arrows indicate potential drop targets.
Volume fading on recent rallies – suggesting weakening bullish momentum.
---
🎯 Potential Trading Plan:
🔻 Short Setup:
Entry: $104,500 – $105,000 (below current structure)
TP1: $94,300
TP2: $80,000
SL: $106,800 (above resistance zone)
🟠 Long Setup (if price reaches demand):
Entry: $78,000 – $80,000
SL: $76,000
TP: $94,000 / $100,000
---
⚡News Catalyst:
⚠️ Major U.S. and global economic events expected soon. Be ready for volatility spikes (icons indicate calendar impact).
---
📊 What I'm Watching:
Volume divergence
Price reaction to $94k level
Fed announcements and macro impact on crypto
---
💬 Do you think BTC will bounce from $94k or head to $80k?
Comment below your trade setup 👇
---
🔖 Hashtags for Reach:
#BTCUSD #BitcoinAnalysis #CryptoTrading #SupplyAndDemand #LuxAlgo #BTCShort #PriceAction #BitcoinCrash #CryptoTA #BTCTradeSetup #tradingviewcommunity
---
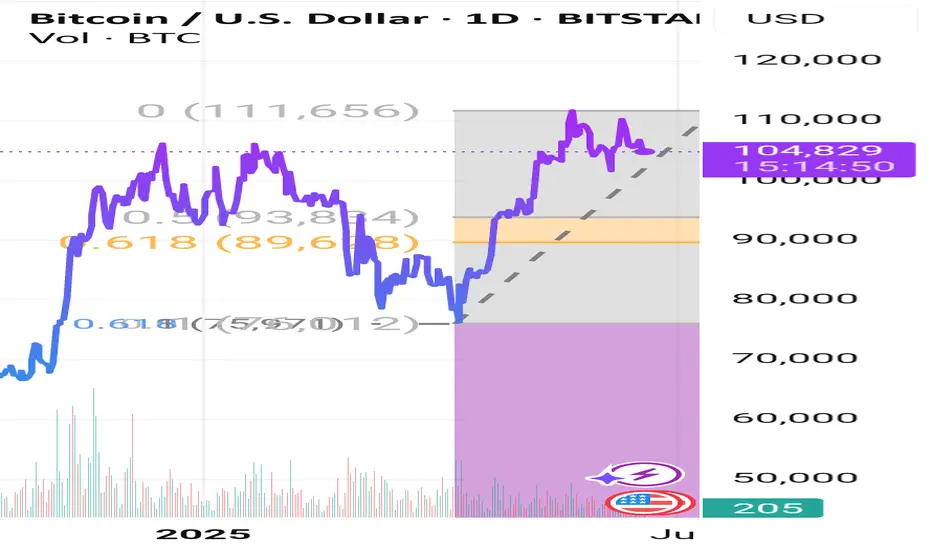
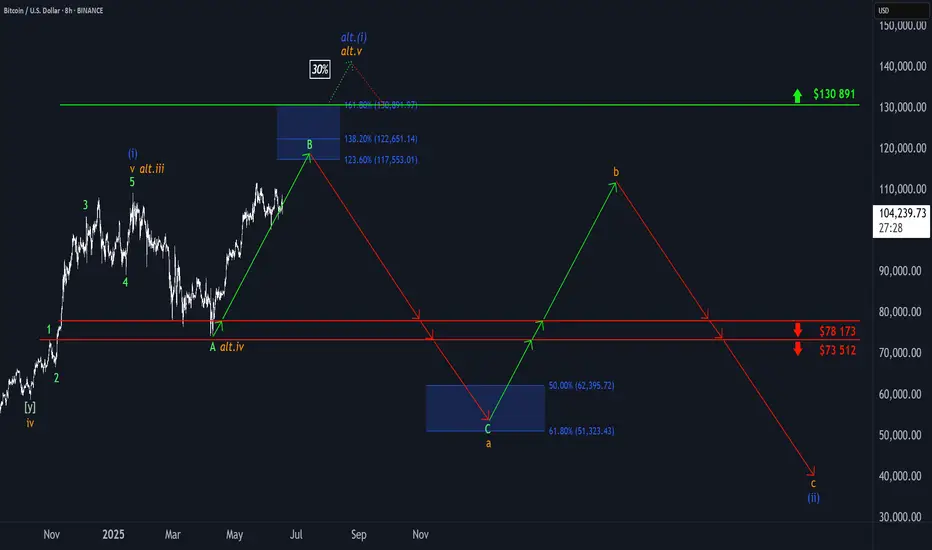
₿itcoin: Directly or with a Detour?!Under our primary scenario, Bitcoin remains on track to climb into the upper blue Target Zone between $117,553 and $130,891 during green wave B. The key question at this stage: will the crypto giant head straight for the zone – or take a detour below the $100,000 level first? Either path remains structurally consistent with the broader outlook. Once wave B concludes, we expect a pullback to unfold in wave C, with the low of that move – and the bottom of orange wave a – anticipated in the lower blue Target Zone between $62,395 and $51,323. From there, orange wave b should initiate a corrective rally, likely rebounding toward the $100,000 mark. This would set the stage for the final leg down in blue wave (ii). Meanwhile, our alternative scenario remains intact on the 8-hour chart. This 30% likely scenario suggests Bitcoin is still advancing within blue wave alt.(i) , rather than correcting in wave (ii). A confirmed breakout above $130,891 would validate this outcome.
📈 Over 190 precise analyses, clear entry points, and defined Target Zones - that's what we do.
Elliot Wave Count Bitcoin - BTCElliot Wave count BTC. Last wave up could be 1st of 5th wave, but think it's a B wave, in expanded flat wave B can take on an impulsive structure and consist of five waves, allowing it to rise above the starting point of wave A. Supported by Elliot Wave count in Equity where probably wave 5 is also placed. And by latest lower high what could be start of market structure change. Invalidation above more or less 113-116k. Fib.time 0.66 gives turning point on July 6th in confluence with end of wedge. World is mega bullish with lot of fresh Longs (big-time in ETF's) waiting for overnight millions. Lets see how this count works out.
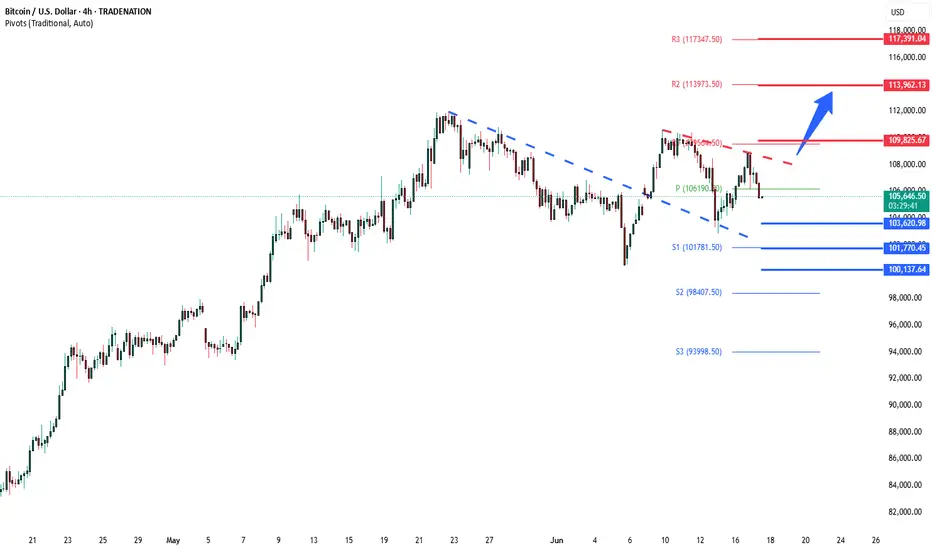
BTCUSD bullish breakout consolidation support at 103,620Trend Overview:
Bitcoin BTCUSD remains in a bullish trend, characterised by higher highs and higher lows. The recent intraday price action is forming a continuation consolidation pattern, suggesting a potential pause before a renewed move higher.
Key Technical Levels:
Support: 103,620 (primary pivot), followed by 101,770 and 100,140
Resistance: 109.830 (initial), then 113,960 and 117,390
Technical Outlook:
A pullback to the 103,620 level, which aligns with the previous consolidation zone, could act as a platform for renewed buying interest. A confirmed bounce from this support may trigger a continuation toward the next resistance levels at 109,830, 113,960, and ultimately 117,390.
Conversely, a daily close below 103,620 would suggest weakening bullish momentum. This scenario would shift the bias to bearish in the short term, potentially targeting 101,770 and 100.140 as downside levels.
Conclusion:
Bitcoin BTCUSD maintains a bullish structure while trading above the 103,620 support. A bounce from this level would validate the consolidation as a continuation pattern, with upside potential toward the 109,830 area. A breakdown below 103,620, however, would invalidate this view and suggest deeper corrective risk.
This communication is for informational purposes only and should not be viewed as any form of recommendation as to a particular course of action or as investment advice. It is not intended as an offer or solicitation for the purchase or sale of any financial instrument or as an official confirmation of any transaction. Opinions, estimates and assumptions expressed herein are made as of the date of this communication and are subject to change without notice. This communication has been prepared based upon information, including market prices, data and other information, believed to be reliable; however, Trade Nation does not warrant its completeness or accuracy. All market prices and market data contained in or attached to this communication are indicative and subject to change without notice.
Current StructureHere is the 4H and 1D structures. Multiple smaller pennants within larger pennants. IMO, this is forming 106 as the base for the next, and possibly last, leg higher for this present cycle. Will be fun to watch the next few weeks to months play out.
Hold fast. Keep faith. Remain vigilant.

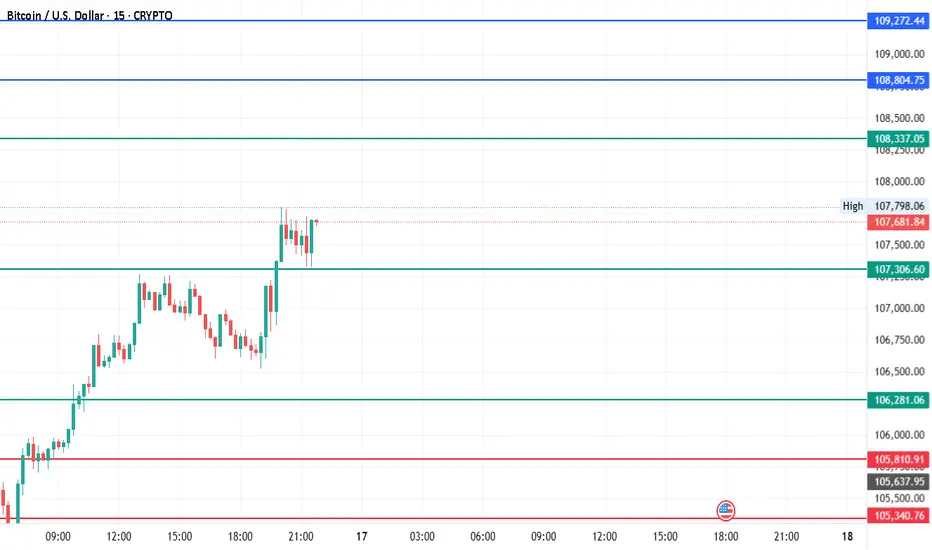
#Bitcoin - Pivot Point is $107306.60 & Expecting 3000 Pts MoveDate: 16-06-2025
#Bitcoin Current Price: 107650
Pivot Point: 107306.60 Support: 106281.06 Resistance: 108337.05
#Bitcoin Upside Targets:
Target 1: 108804.75
Target 2: 109272.44
Target 3: 110009.63
Target 4: 110746.82
#Bitcoin Downside Targets:
Target 1: 105810.91
Target 2: 105340.76
Target 3: 104603.57
Target 4: 103866.38
Bitcoin full analysis, what's going on?Bitcoin has been trading horizontally since May 8th, with occasional breakouts both upward and downward. This trend is largely attributed to two factors: institutional buying and miners selling. The low trading volume on exchanges, combined with a decrease in daily trades from its recent peak in February 2024, has led to increased volatility, although these fluctuations have been relatively small compared to past swings.
In my opinion, the bull run began in October 2023, as evidenced by increasing volumes and a steady rise in prices. Unlike previous cycles, this market has priced in the halving in advance, leading to gains year-to-date from approximately 15800 USD to a new all-time high (ATH) of approx 112,000 USD. By any standards, this is an excellent return and shows that Bitcoin is performing well and should be held.
However, it's worth noting that this bull run has lasted 590 days, which is longer than previous cycles that typically lasted less than 585 days, depending on how one defines the start and end. What is keeping Bitcoin from skyrocketing? The answer seems to be that the bears are currently in control, with major overhead resistance at 112k. Bitcoin has struggled to stay above 108k for any significant period. Additionally, the accumulation/distribution metrics are leveling off, daily trading volumes are decreasing, and the Net Unrealized Profit/Loss (NUPL) is high, indicating that profits are being taken. The Relative Strength Index (RSI) shows signs of bearish divergence, and we are observing a flag pattern that appears to be forming a descending triangle following a double top. All these indicators suggest we may be nearing the end of this cycle.
On a positive note, Bitcoin short positions are not particularly high, nor are long positions, indicating market uncertainty about the direction. Geopolitical tensions, a weak U.S. Dollar Index (DXY), and tariff chaos could act as catalysts for price movement. The successful Circle IPO demonstrated that there is market appetite for crypto. Bitcoin has also built considerable support in the 95k-107k range, and the flag pattern suggests a potential rise to 115k in the next breakout.
In my analysis, the bearish outlook feels stronger. Although there are positive signals for the upside, the return on investment this next upward move could only be 115k. As a result, I have stepped out of Bitcoin and into other assets that I deem more stable during this global period. I plan to re-enter Bitcoin when it reaches around 44k or lower (50-70% correction, depends on when and I will DCA), which would present a more attractive entry point. More importantly, if Bitcoin is maturing and behaving like gold or another stock, I will treat it as such. Legislation remains uncertain, and I have experienced being on the wrong side of crypto in too many cycles. When FOMO kicks in, it's often the right time to exit.
As I look at the charts and say the phrase "moon BABY," I realize my spaceship is not yet ready. Safe trading, everyone! These are my thoughts on Bitcoin. Let me know if you agree or if you think I am completely off the mark. Not trading advice.

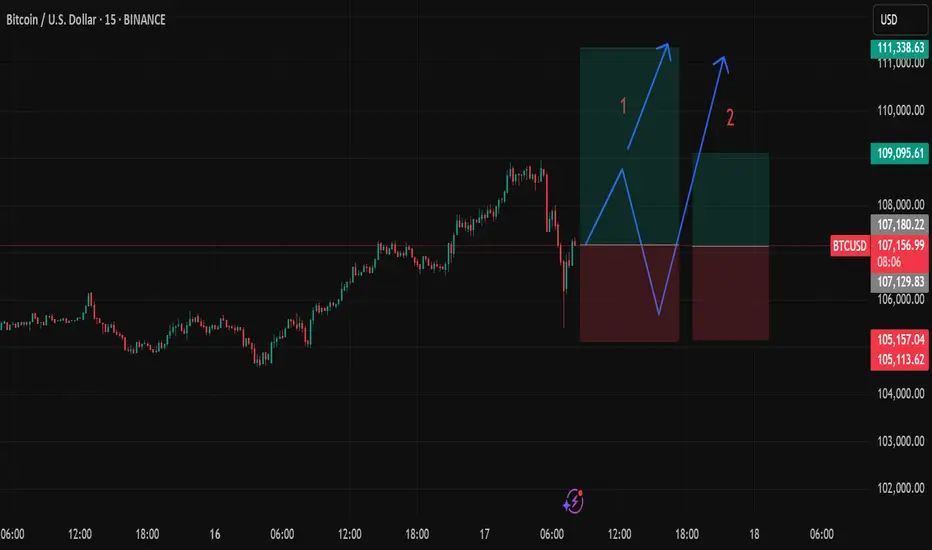
Clean Shot Short-Term buy BTCScenerio 1: go new high risk/reward very good.
Scenerio 2: go to top and go down one more time and then up to new high.
BTCUSD LONGBTC has recently broken its last lower timeframe High, shifting market structure and indicating Buyers are currently in control. This break opened up a clear Demand Zone below, a small base or last bearish candle before the rise, which is a key area where unfulfilled buy orders may be resting.
Entry:
I’m looking to buy from this Demand Zone on the pullback, adding to go long when price enters this area. This lets me enter at a discount price while trading in direction of the newly established upward momentum.
Target:
The first Target Profit (TP) is set at the next supply Zone above, where selling pressure might emerge.
Stop Loss:
To control risk, the Stop Loss (SL) is placed just below the demand Zone.
If price drops below this area, it would invalidate the demand’s ability to hold, signalling a potential reversal.
✅ Summary:
• Market has shifted to bullish after breaking last high.
• Demand Zone below is a key area to watch for buying opportunities.
• Buy upon retracement into Demand, with Stop Loss below and Target at supply above.

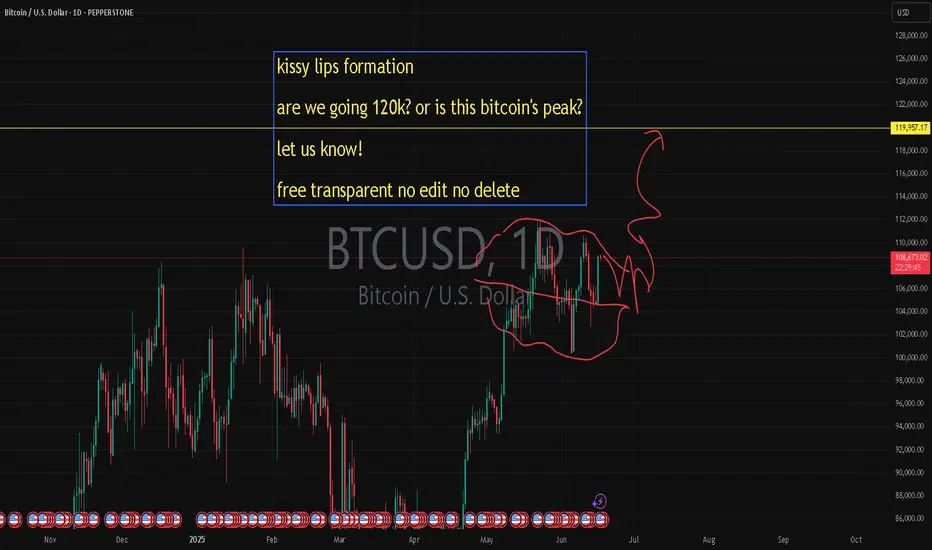
kissy lips formation are we going 120k? or is this btc's peak?kissy lips formation
are we going 120k? or is this bitcoin's peak?
let us know!
free transparent no edit no delete
🐉We value full transparency. All wins and fails fully publicized, zero edit, zero delete, zero fakes.🐉
🐉Check out our socials for some nice insights.🐉
information created and published doesn't constitute investment advice!
NOT financial advice
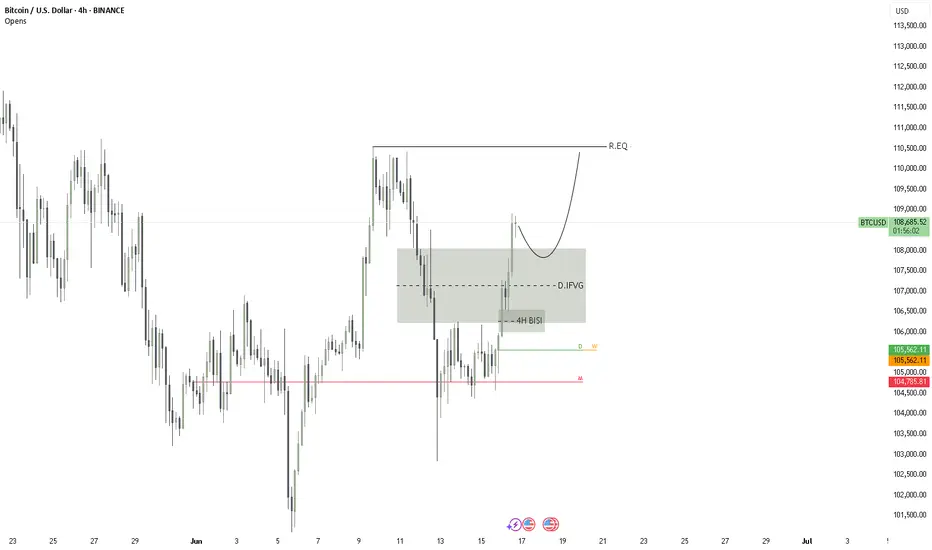
BTC UPDATEstill bulish in btc
waiting to inv THE D.BISI
gona be a good opportunity to add more trades
already have 1/1 RR in my first trade ( previous post )
gonna hold this to 1/2 RR
and the new trade to the ATH