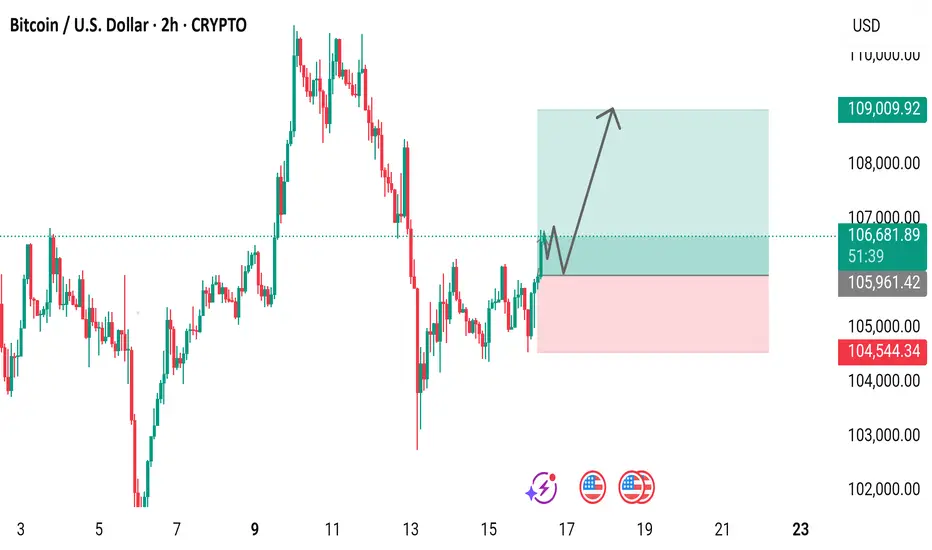
Bitcoin/USD 2-Hour Price ChartChart showing Bitcoin's 2-hour price movement against USD, currently at $106,647.03 (+0.96%), with a recovery trend from $105,000 and key levels at $109,000.92 and $104,544.34.
BTCUSD.PI trade ideas
Macromics Group: Market Trends Overview (June 2025)Global Economic Landscape: What Has Changed?
June 2025 marks significant shifts in the global economy. After several years of instability caused by the pandemic, inflation, and geopolitical tensions, markets are gradually stabilizing. However, new challenges are emerging: rising risks in Asia, digital transformation in Europe, and strategy shifts in the U.S.
China and India continue to show strong growth rates—5.8% and 6.5% respectively. Europe, by contrast, is lagging behind due to slow recovery and persistent inflation. The U.S. maintains a steady course driven by consumer spending and innovation, reporting 2.1% GDP growth.
Macromics Group continues to deliver in-depth analytics and strategies for clients seeking to understand and capitalize on these changes. We analyze trends across more than 120 industries, helping companies adapt and thrive.
Macroeconomics and Monetary Policy: A Shift Toward Stabilization
Financial regulators have begun cautiously lowering interest rates after the peaks of 2024. The U.S. Federal Reserve has dropped its rate to 4.5%, while the ECB has reduced its rate to 3.75%. This is made possible by a decline in inflation: 2.7% in the U.S. and 3.1% in the EU.
Meanwhile, developing nations like Turkey and Argentina are still grappling with high inflation. These countries risk falling behind the global recovery unless decisive steps are taken.
Overall, the global course is toward soft stabilization: interest rates remain high but steady. This creates favorable conditions for investment and long-term planning.
Financial Markets: From Caution to Moderate Optimism
Stock markets in June 2025 show mixed performance. U.S. indexes such as the S&P 500 and Nasdaq hit new highs, thanks to the booming tech sector. Stocks of companies involved in AI, quantum computing, and cybersecurity are particularly strong.
European markets are less active but relatively stable. Growth is limited by high costs, demographic issues, and the transition to ESG standards. In Russia and CIS countries, markets are under pressure due to sanctions, currency restrictions, and reduced investment.
On the currency front, the U.S. dollar and Chinese yuan dominate. The ruble is volatile, the euro is stable, and the yen is strengthening as a safe haven asset.
Technology: The Engine of New Markets
The main trend in 2025 is AI and automation. Companies are deploying neural networks in logistics, marketing, finance, and HR to cut costs and boost efficiency. Demand for AI professionals and developers is surging.
5G infrastructure has matured in most developed countries, unlocking new potential in IoT, telemedicine, and remote work. At the same time, quantum computing is advancing rapidly, with commercial solutions expected by 2026.
Macromics Group invests in next-generation analytical platforms, enabling clients to access real-time insights and forecast trends before they go mainstream.
Energy and Sustainability: ESG and the “Green” Shift
Energy markets have stabilized after the turbulence of 2024. Oil prices remain between $70–$85 per barrel—comfortable for both producers and consumers. Meanwhile, renewable energy—solar, wind, and hydrogen—is seeing record investment.
Corporations are increasingly reporting according to ESG standards. It’s not just a trend, but a new business reality. Investors demand transparency, consumers prefer socially responsible brands, and regulators impose mandatory reporting.
Macromics Group supports clients in transitioning to sustainable models by developing ESG strategies, assessing risks, and offering financial solutions.
Conclusion: Outlook for the Second Half of 2025
The first half of 2025 showed that markets are learning to operate in a new reality. The global economy is no longer chasing rapid growth, but adapting to volatility. Key focus areas are technology, sustainability, and smart resource management.
For businesses, this means quick adaptation, innovative thinking, and reliance on data-driven decisions. In this context, Macromics Group serves not just as an analyst but as a strategic partner.
Our recommendation: act proactively. In times of uncertainty, those who plan years ahead and use quality data will win.
Automated Trading with Pine ScriptIn the digital age, trading is gradually shifting from manual analysis to automated solutions. A key player in this process is Pine Script — a programming language developed for the TradingView platform, enabling users to create custom indicators, strategies, and automated signals. Its simplicity and powerful capabilities have made it especially popular among retail traders.
What is Pine Script?
Pine Script is a language developed by the TradingView team specifically for financial market analysis. Unlike general-purpose languages like Python or C++, Pine Script is designed for tasks related to technical analysis and trading automation.
It is used for:
Creating custom indicators;
Writing trading strategies;
Visualizing data on charts;
Setting up trading alerts (notifications).
Why Automate Trading?
Automated trading eliminates the human factor, which is crucial in volatile markets. Key advantages include:
Speed of reaction — the algorithm reacts instantly to signals.
Discipline — automated strategies do not succumb to emotions.
Scalability — one strategy can be applied to dozens of instruments.
Historical analysis — the ability to test ideas on past data (backtesting).
Structure of a Pine Script
Every script starts with a version declaration and the type of tool being created:
pinescript
Copy
Edit
//@version=5
indicator("Sample Indicator", overlay=true)
@version=5 — Pine Script version.
indicator(...) — indicates that the script is an indicator.
overlay=true — places graphics over the price chart.
For strategies, the strategy keyword is used:
pinescript
Copy
Edit
strategy("My Strategy", overlay=true)
Example of a Simple Automated Strategy
Let’s build a script that generates buy and sell signals based on the crossover of two moving averages:
pinescript
Copy
Edit
//@version=5
strategy("MA Strategy", overlay=true)
fastMA = ta.sma(close, 9)
slowMA = ta.sma(close, 21)
longCondition = ta.crossover(fastMA, slowMA)
shortCondition = ta.crossunder(fastMA, slowMA)
if longCondition
strategy.entry("Buy", strategy.long)
if shortCondition
strategy.entry("Sell", strategy.short)
plot(fastMA, color=color.green)
plot(slowMA, color=color.red)
This code:
Opens a long position when the fast MA crosses above the slow MA.
Opens a short position when the fast MA crosses below the slow MA.
Strategy Backtesting
TradingView automatically runs a backtest on historical data. In the Strategy Tester tab, users get:
total number of trades;
average profit;
win rate;
maximum drawdown;
risk/reward ratio.
This is a vital tool to evaluate the effectiveness of a strategy before deploying it in live trading.
Adding Stop Loss and Take Profit
To manage risk, strategies can include loss and profit limits:
pinescript
Copy
Edit
strategy.entry("Buy", strategy.long)
strategy.exit("Exit Buy", from_entry="Buy", stop=100, limit=200)
stop=100 — stop loss at 100 points.
limit=200 — take profit at 200 points.
This enhances both automation and risk control in the trading process.
Setting Up Alerts
While Pine Script cannot place real trades by itself, it can generate alert signals, which can be linked to external systems or brokers.
pinescript
Copy
Edit
alertcondition(longCondition, title="Buy Signal", message="Buy signal")
alertcondition(shortCondition, title="Sell Signal", message="Sell signal")
After adding these conditions to the chart, users can set up alerts that arrive via email, mobile notifications, or webhooks—useful for integration with bots or APIs.
Automated Trading via API
For full automation (from signal to trade execution), Pine Script is often used in conjunction with other technologies:
Webhook — TradingView sends an HTTP request when an alert triggers.
Server or bot — receives and processes the request, then sends an order to the broker.
Broker’s API — executes the order (open, close, modify positions).
Examples of brokers with API access: Binance, Bybit, Interactive Brokers, Alpaca, MetaTrader (via third-party bridges).
Tips for Writing Trading Strategies
Start simple. Use just 1–2 indicators.
Avoid overfitting. Don’t tailor your strategy too closely to past data.
Test on different timeframes. Ensure strategy stability.
Account for fees and slippage. Especially important on lower timeframes.
Add filters. For example, trend direction, volume, or volatility conditions.
Pine Script Limitations
While powerful and beginner-friendly, Pine Script has some limitations:
No tick-by-tick data access. Scripts execute on bar close.
Resource limits. Limits on script length and processing power.
No direct trade execution. Only possible via external integration or supported brokers.
Conclusion
Pine Script is an excellent tool for traders who want to automate their trading ideas. It allows you to create, test, and visualize strategies—even with minimal programming knowledge. While it’s not a full-fledged programming language, its capabilities are more than sufficient for most retail trading needs. With Pine Script, traders can improve efficiency, consistency, and reduce the emotional impact of trading decisions.
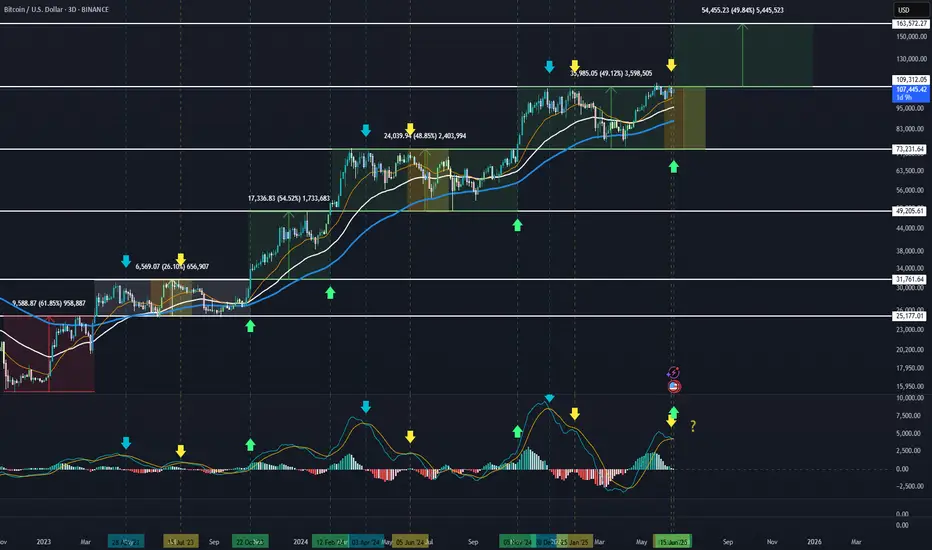
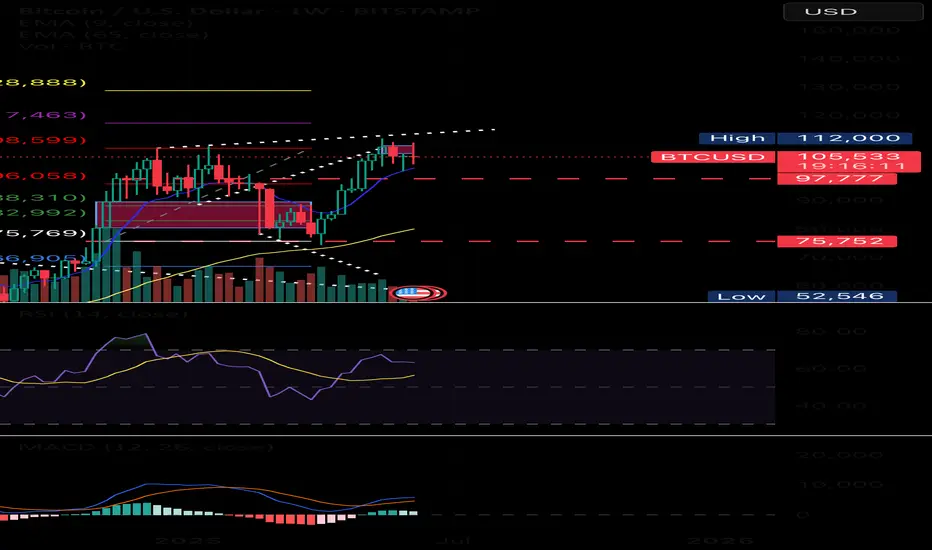
BTC climbs the stairsFrom the bear market lows(red) we entered into consolidation phase(white) in 2023 and in october 2023 the bull market was ignited(green). Since then BTC has climbed these ~50% steps up and right now we are at the verge of entering the last 50% step up of this bull phase taking us up to 160k. Are we going to see the last step up on upcoming months or are we going to see a rejection and keep consolidating inside the current box?
If we compare the previous two steps up(green arrow) to the current situation, the set up is a little bit different now than before. Previously, BTC has practically blasted through the box resistance without hesitation but now we have spent more time just underneath the box resistance with two failed attemps(3D) of breaking the resistance. Also, what concerns me, is the fact that during this cycle the summer months june-july(marked inside the box) has not been strong for BTC and we have witnessed MACD forming bearish divergences during these months due to a rejection from the highs towards the bottom of the box. This very thing is happening again and if confirmed, no new ATHs for this summer. Of course, a solid strong candle close above the resistance clarifies the future and set us on our way to 160k.
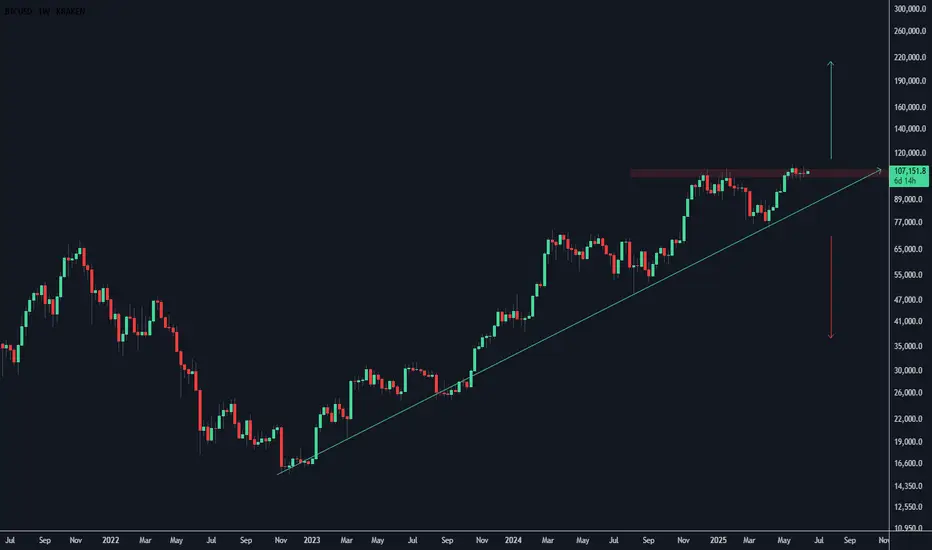
BTC Weekly ChartJust consolidating around ATHs at this point.
Its bound to see a huge move either way eventually.
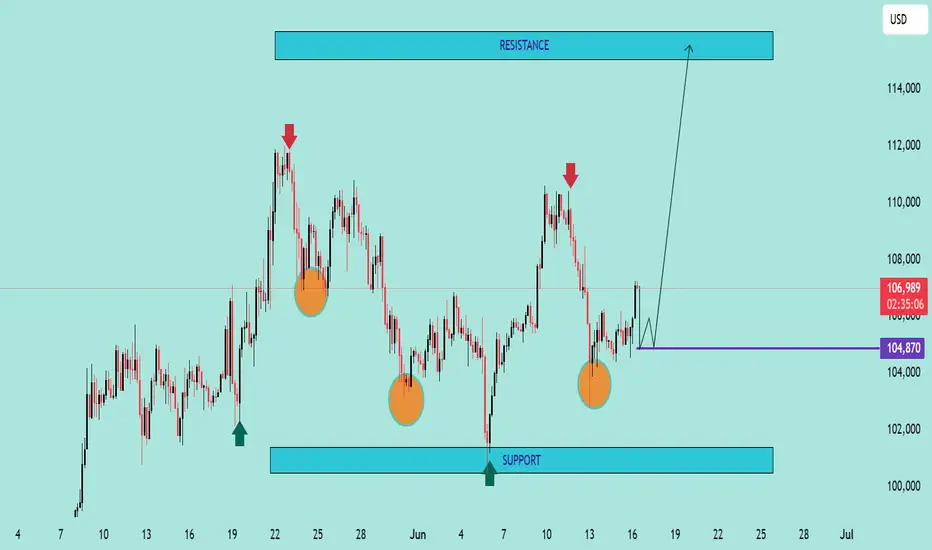
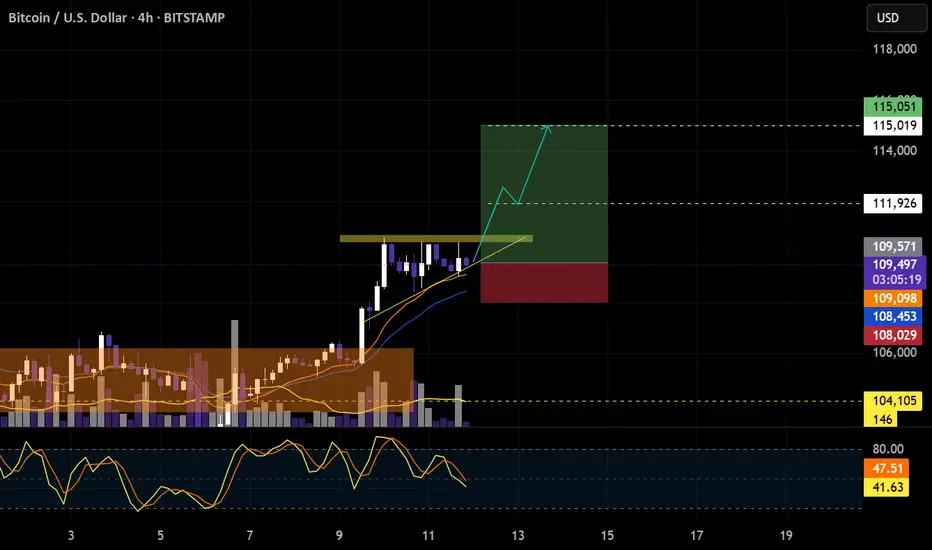
BTC/USD Potential Reversal & Bullish Breakout SetupBTC/USD Potential Reversal & Bullish Breakout Setup 🔄🚀
Technical Analysis Overview:
🔹 Pattern Formation:
The chart displays a potential Triple Bottom pattern (🟠), a classic reversal signal forming at the $104,870–$100,000 support zone 🛡️. This structure suggests a strong base is being established for a potential upside move.
🔹 Support Zone:
📉 The price has consistently bounced off the major support area around $100,000–$104,870, indicating strong buying interest.
🔹 Resistance Zone:
📊 The key resistance level lies around the $114,000–$115,000 range 🔵, which has been tested multiple times in the past (🔴 arrows) and could act as a future profit target.
🔹 Price Action & Projection:
Currently, price is trading near $107,025 and is showing signs of bullish continuation after forming a higher low. If the price consolidates above the $104,870 zone and holds support, we could see a potential breakout targeting the $114,000 resistance 📈.
📌 Key Takeaways:
✅ Triple Bottom formation signals trend reversal.
🔄 Bullish structure confirmed above $104,870.
🎯 Next target: $114,000 if breakout holds.
⚠️ Watch for potential consolidation before continuation.
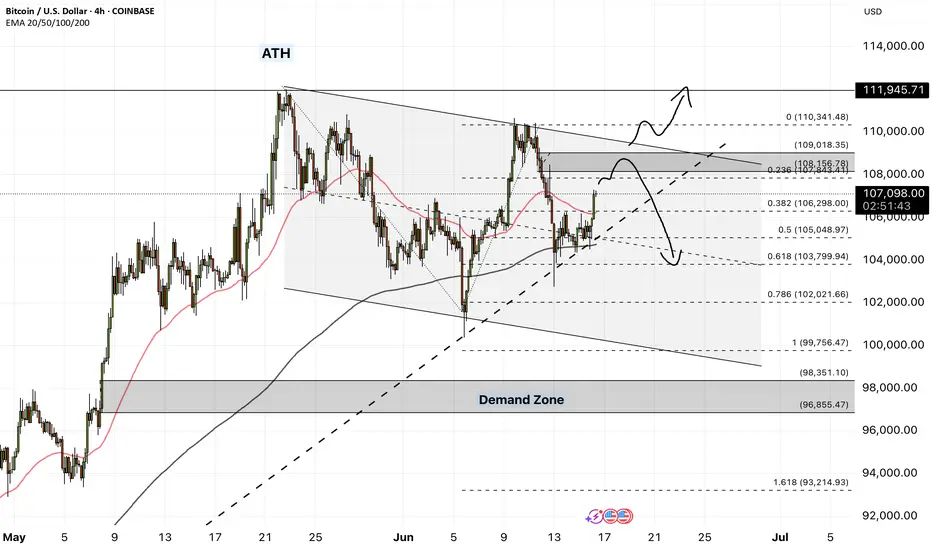
Bitcoin - Will Bitcoin Reach Previous ATH?!Bitcoin is above EMA50 and EMA200 on the four-hour timeframe and is in its short-term descending channel. We can look for Bitcoin short positions from the specified supply range. If this range is broken, the path to the rise and a new ATH for Bitcoin will be presented.
It should be noted that there is a possibility of heavy fluctuations and shadows due to the movement of whales in the market and capital management in the cryptocurrency market is required, more than we would like. If the downtrend continues, I can buy in the desired range.
Bitcoin is now approaching its all-time high, yet unlike previous bullish cycles, we have not seen widespread profit-taking so far. The market’s whales currently seem uninterested in large-scale selling at these levels and appear to be waiting for higher price targets.
Since the start of January 2024, cumulative inflows of over $60 billion have poured into crypto-related investment products in the U.S., including ETPs and ETFs. In addition, retail investor futures trading volumes have recently surpassed their one-year average. Indicators of retail activity suggest that a significant number of smaller investors have become active in the futures markets.
The total assets under management by crypto investment funds surged to an unprecedented $167 billion in May. This impressive growth was fueled by net inflows of more than $7 billion into these funds. Meanwhile, global equity funds recorded $5.9 billion in outflows, and gold funds, for the first time in 15 months, also saw capital leaving.
The year 2025 could turn out to be the most dangerous year yet for cryptocurrency holders. Already, more than 25 incidents involving physical attacks on crypto owners have been reported, and the year isn’t even over. These attacks have targeted individuals whose digital asset information or identities were compromised, leading to thefts, kidnappings, physical threats, or assaults.
On another front, the total value of circulating stablecoins has surpassed $250 billion, more than doubling from its mid-2023 low of $123 billion. USDT remains the market leader with a 62% share, followed by USDC at 24%, while other stablecoins such as USDe, DAI, and BUIDL are also expanding their presence.
It is worth noting that average spot trading volumes on centralized exchanges have dropped to their lowest levels since October 2020.This kind of pattern typically precedes a significant price move—whether that’s a sharp rally or a deep correction. It’s also possible that this phase of uncertainty could persist for several more weeks.
Possible descending triangle, likely will break to downside.Despite Bitcoin (BTC) maintaining a price above $100,000 for several weeks now, it is clearly being supported by institutional buyers propelling the market. This is very bullish for the long term; however, BTC does need to correct in order to grow further. Volume continues to drop, and as soon as institutional buyers take a break, the price could crash.
Given that this cycle has introduced new market players, ETFs, and considering the current economic climate, a decline of over 60% down to its support level of $44,000 seems likely in the next year. We all know how it goes: when Bitcoin goes through tough times, it can seem like it’s dead, and that could be the best time to buy.
In the long run, if you're dollar-cost averaging (DCA) and have no intention of selling, I am confident that BTC will reach $250,000 in the next cycle, if not $500,000. However, it must correct to strengthen the lower supports and flush out over-leveraged traders.
Remember the saying: "When the tide goes out, we see who is swimming naked." This will happen again; it's Bitcoin!

Bitcoin - Inverse Head & Shoulders on 4h (Neckline broken)Looking forward to a new ATH shortly IF the neckline holds.
BITSTAMP:BTCUSD
BINANCE:BTCUSD
COINBASE:BTCUSD
CRYPTOCAP:TOTAL
CRYPTOCAP:OTHERS
BINANCE:ETHUSD
COINBASE:ETHUSD
BINANCE:SOLUSD
OANDA:XAUUSD
FX_IDC:XAUUSD

when Jerome says spike, the markets asks how low/high"Watch what they do, but also how they say it."
In the high-stakes world of central banking, few things move markets like the subtle wording of a Fed statement, But beyond the headlines and soundbites, one market absorbs this information faster—and with greater clarity—than almost any other: the bond market.
💬 What Is "Fed Speak"?
"Fed speak" refers to the nuanced and often deliberately vague language used by U.S. Federal Reserve officials when communicating policy expectations. It includes:
FOMC statements
Dot plot projections
Press conferences
Individual speeches from Fed officials
nerdy tip: the Fed aims to influence expectations without committing to specific outcomes, maintaining flexibility while steering market psychology.
📈 The Bond Market as a Decoder
The bond market, particularly the U.S. Treasury market, is where real-time interpretation of Fed policy plays out. Here's how it typically reacts:
1. Short-Term Yields (2Y, 3M) = Fed Expectation Barometer
These are the most sensitive to near-term interest rate expectations. If the Fed sounds hawkish (more rate hikes), short-term yields jump. If dovish (hinting cuts), they fall. At the May 7, 2025 FOMC meeting, the 2-year Treasury yield (US02Y) experienced a modest but clear reaction:
Just before the release, yields were hovering around 3.79%.
In the first hour following the 2:00 PM ET (20:00 UTC+2) statement, the yield ticked up by approximately +8 basis points, temporarily reaching about 3.87%.
Later that day, it eased back to around 3.79%, ending the day roughly unchanged—a sharp, immediate spike followed by a reversion.
2. Long-Term Yields (10Y, 30Y) = Growth + Inflation Expectations
Longer-dated yields reflect how the market sees the economy unfolding over time. After a Fed speech:
Rising long-term yields = stronger growth/inflation expected
Falling yields = fears of recession, disinflation, or policy over-tightening
3. The Yield Curve = Market's Policy Verdict
One of the best tools to read the bond market's verdict is the yield curve—specifically, the spread between 10Y and 2Y yields.
Steepening curve → Market thinks growth is picking up (Fed may be behind the curve)
Flattening or Inversion → Market believes the Fed is too aggressive, risking a slowdown or recession
📉 Example: After Jerome Powell’s hawkish Jackson Hole speech in 2022, the 2Y-10Y spread inverted deeply—markets were pricing in recession risks despite a strong Fed tone.
🧠 Why Traders Must Watch Bonds After Fed Speak
🪙 FX Traders:
Higher yields = stronger USD (carry trade advantage)
Falling yields = weaker USD (lower return for holding)
📈 Equity Traders:
Rising yields = pressure on tech/growth stocks (higher discount rates)
Falling yields = relief rally in risk assets
📊 Macro Traders:
The MOVE Index (bond volatility) often spikes around FOMC events
Forward guidance shifts = big rotation opportunities (e.g., bonds > gold > dollar)
(BONUS NERDY TIP) 🔍 How to Analyze Fed Speak Through Bonds
✅ Step 1: Watch the 2Y Yield
First responder to new rate expectations.
✅ Step 2: Check the Fed Funds Futures
Compare market pricing pre- and post-statement.
✅ Step 3: Look at Yield Curve Movement
Steepening or inversion? That’s the market’s macro take.
✅ Step 4: Track TLT or 10Y Yield on Your Chart
Bond ETFs or Treasury yields reveal sentiment instantly.
🧭 Final Nerdy Thought : Bonds React First, Talk Later
When the Fed speaks, don't just read the words. Read the yields. The bond market is often the first to interpret what the Fed really means—and the first to price in what comes next.
So next FOMC meeting, instead of watching only Powell’s facial expressions or CNBC pundits, open a chart of the 2Y and 10Y. That’s where the smart money’s listening.
put together by : @currencynerd as Pako Phutietsile
courtesy of : @TradingView

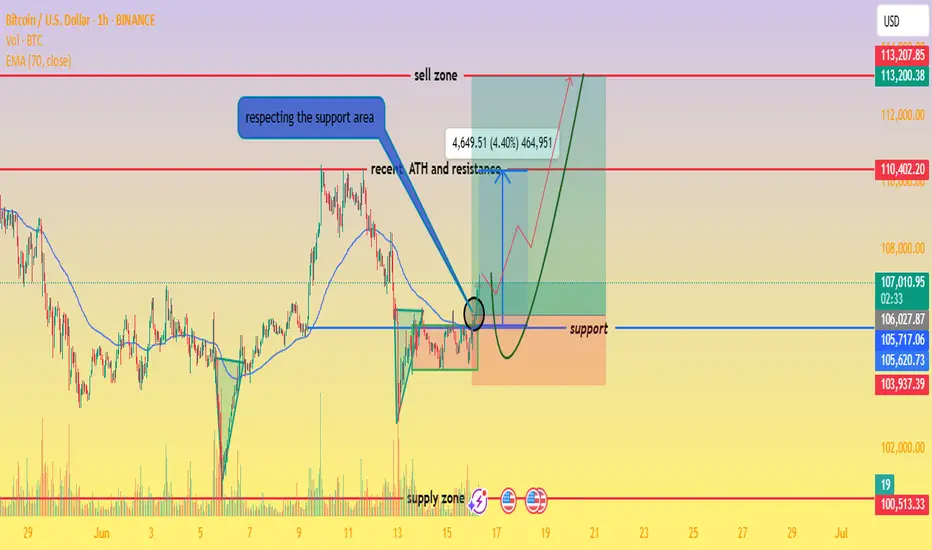
Bitcoin Bounce & Breakout PlayChart Analysis:
🔹 Support Holding Strong:
BTC is respecting a key support area (~$105,600), which previously acted as resistance (marked by recent ATH).
🔹 EMA 70 (Blue Line):
Price is hovering above the EMA, adding bullish confirmation.
🔹 Bullish Projection Path:
The chart shows a projected bullish move toward the sell zone near $113,200 – $113,300, representing a potential 4.4% gain from the breakout.
🔹 Key Zones:
Support Zone: $105,600
Supply Zone: $100,500
Sell Zone (TP Zone): $113,200+
📌 Outlook:
If BTC breaks and holds above the resistance (~$107,000), a strong upward rally could follow. Entry near support or on breakout, with tight risk management, offers a favorable risk/reward.
✅ Entry Options:
Breakout Entry:
Trigger: Break and close above $107,200
Confirmation: Retest and hold above the breakout zone
Entry: $107,300 – $107,500
Support Bounce Entry:
Trigger: Pullback to support zone (~$105,600) with bullish reversal candle
Entry: $105,600 – $105,800
🎯 Target Zones (TP):
TP1: $110,400 (minor resistance)
TP2: $113,200 – $113,300 (major sell zone)
TP3 (aggressive): $114,000+
🔻 Stop Loss (SL):
For breakout entry: SL below $106,200
For bounce entry: SL below $105,200 or $104,800 (structure break)
📈 Risk–Reward Ratio:
Approx. 1:2.5 to 1:3+ depending on entry and target
🧠 Trade Management:
Move SL to breakeven after hitting TP1
Partial profit booking at TP1
Trail remaining with manual or dynamic SL (e.g., below EMA or recent low)
⚠️ Risk Notes:
Avoid chasing price without breakout confirmation
Watch for fakeouts and heavy selling near TP zones
Adjust position size based on your risk tolerance
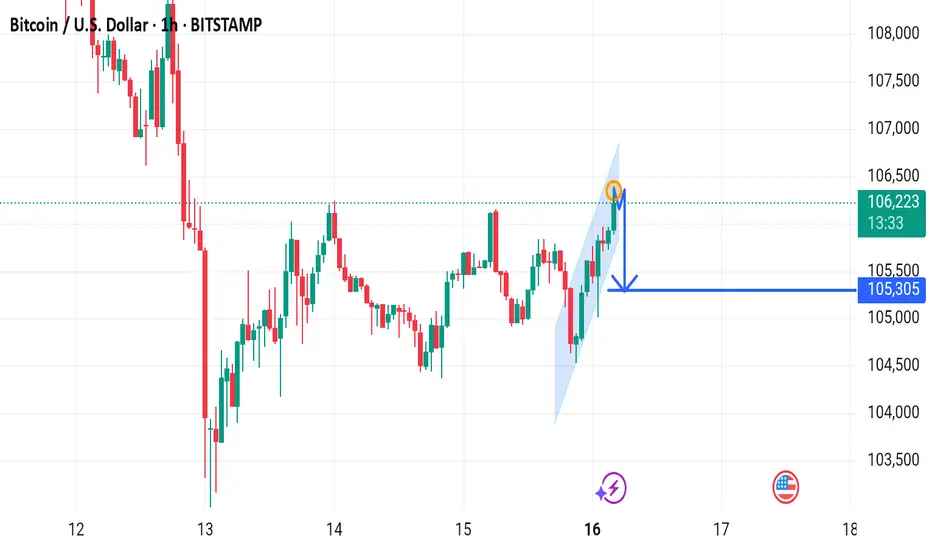
BTCUSD Enter point 106200 target 105200 stop loss 107000New trade setup for BTCUSD:
- Entry: 106,200
- Target: 105,200
- Stop Loss (SL): 107,000
You're going short on BTCUSD. What's driving your bearish sentiment? Market trends, technical indicators, or something else?

6/15/2025Come Tap into the mind of SnipeGoat, as he gives you a magnificent Full Top-Down Analysis, breaking down the market in its simplest form.
_SnipeGoat_
_TheeCandleReadingGURU_
#PriceAction #MarketStructure #TechnicalAnalysis #Bearish #Bullish #Bitcoin #Crypto #BTCUSD #Forex #NakedChartReader #ZEROindicators #PreciseLevels #ProperTiming #PerfectDirection #ScalpingTrader #IntradayTrader #DayTrader #SwingTrader #PositionalTrader #HighLevelTrader #MambaMentality #GodMode #UltraInstinct #TheeBibleStrategy

B/$A little trading from my kitchen
If you are interested, just say so and you will enjoy a taste of the kitchen of a winning trader
BTC Trading in a Range.Support & Resistance Levels:
R1: ~106,300
R2: ~109,000
R3: ~111,600
S1: ~102,800
S2: ~100,000
Bearish RSI Divergence
Price made higher highs earlier (around June 10-11).
RSI made lower highs, indicating bearish divergence.
Price Action
BTC bounced back from below S1 (~102,800) and is now hovering around R1 (~106,300).
If it breaks and sustains above R1, we could see a move toward R2 (109k).
However, failure at R1 can lead to a pullback to S1 or S2 levels.
Strategy Suggestions:
📌 If Bullish:
Wait for a clean breakout above R1 (~106,300) with volume.
Potential targets: R2 (109k) and R3 (111.6k).
📌 If Bearish:
If price fails to hold R1 and rejects, consider short opportunities.
Targets would be: S1 (102.8k) and S2 (100k).
Keep an eye on RSI — if it forms another divergence or crosses down the MA, bearish bias increases.
⚠️ Risk Factors:
BTC is still within a consolidation range between R1 and S1.
No clear breakout yet; be cautious with position sizing.
Watch for macroeconomic news/events, as they can spike volatility.

Ready for the plunge. Market meltdown incoming!⚠️ UPDATED ASSESSMENT - MAXIMUM RISK
Escalation Level: MAXIMUM RISK - The conflict has now reached unprecedented scale with 720+ military facilities attacked, confirmed US involvement, and potential for regional Islamic coalition forming against Israel.
Financial Market Risk: 95/100 - We are approaching systemic financial risk with oil supply chains threatened, nuclear facilities under massive attack, and potential for regional war involving multiple Islamic nations.
Critical Factors: Scale of destruction (170+ targets), nuclear program targeting (80+ sites), US military involvement confirmed, calls for Islamic unity, and expert warnings of broader regional war.
Immediate Concerns: Complete breakdown of Middle East oil supply, global energy crisis, nuclear contamination risks, and potential World War III scenario if regional Islamic coalition forms.

Greed as LiquidityBitcoin isn’t rising — it’s baiting. Retail believes it’s a breakout. Smart money sees exhaustion. Momentum is draining, liquidity is drying. Prepare for a drop. Not with fear, but with positioning.

Bitcoin Bitcoin is showing strong momentum to keep moving up.
📊 But for it to truly explode, we need to see inflation spike past 3%.
🔥 Why? Because Bitcoin thrives in high-inflation environments it’s the hedge, the leverage, and the escape route.
#Bitcoin #Crypto #InflationHedge #BTC #Macroeconomics #TradingSignals
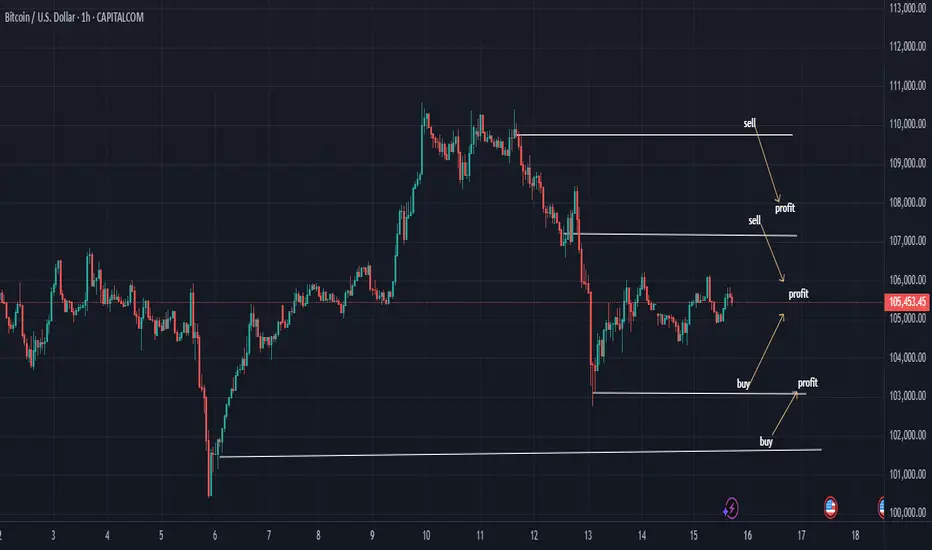
BTC/USD Approaching Key Buy Zone – Watching 104,845 for Reaction
Bitcoin has broken out of a descending channel and is now approaching a potential buy zone between 105,176.89 and 104,845.01. This zone aligns with previous support and trendline confluence, making it a critical area to monitor for bullish reactions.
If price finds support within this zone and confirms with a bounce or bullish pattern, a move toward the 106,268.53 resistance is a possible scenario.
However, a confirmed break below 104,296.67 could signal a shift in momentum and potentially invalidate the bullish setup.
🔹 Buy Zone: 105,176.89 – 104,845.01
🔹 Bearish Invalidator Level: 104,296.67
🔹 Target Area: 106,268.53
🔹 Timeframe: 1H chart
🔹 Trend Context: Price broke previous bearish structure and entered a short-term bullish phase.
This is a technical observation for educational purposes only.

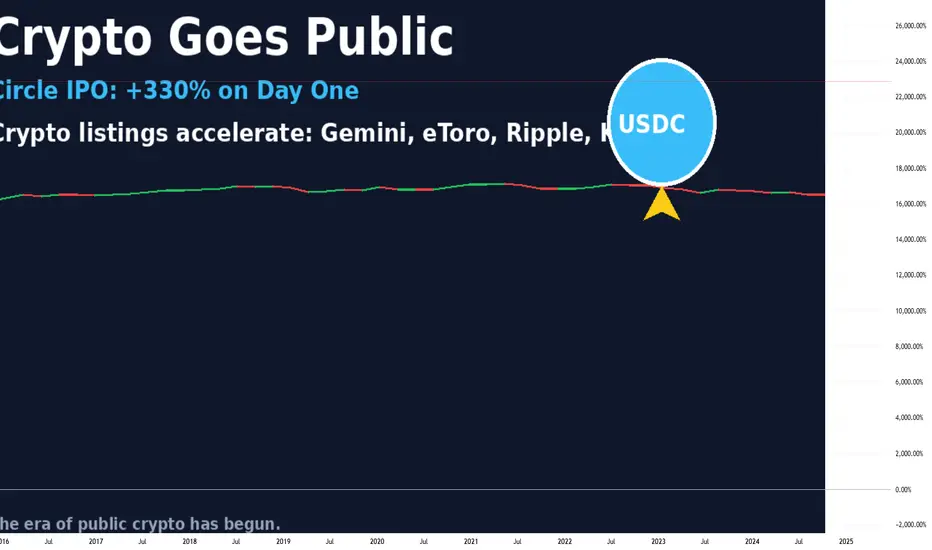
Circle’s IPO and the Crypto Listing Wave: The Market EntersOn June 14, 2025, the U.S. stock market witnessed a pivotal moment for the crypto industry. Circle, issuer of the USDC stablecoin and a major player in the sector, successfully went public. Shares opened at $31 and soared to over $134 by the end of the first trading day—an explosive 330% gain.
This isn’t just a one-off success. It marks the beginning of a new chapter: the public crypto era, where leading crypto companies are stepping into the spotlight of traditional finance.
Why It Matters
Circle’s IPO signals the maturation of the crypto market. Just three years ago, crypto companies were seen as high-risk, unregulated tech startups. Now, they’re structured fintech firms with clear business models, institutional backing, and regulatory compliance.
Who’s Next in Line
Following Circle, a wave of major crypto firms is preparing for their own IPOs:
eToro – the social trading platform with crypto features has finalized its SPAC merger and is set to debut on NASDAQ.
Gemini – the exchange founded by the Winklevoss twins filed for an IPO in mid-May.
Galaxy Digital and Ripple – both confirmed listing plans for the second half of 2025.
Kraken is exploring a listing in Europe, where requirements are more flexible than in the U.S.
These companies are waiting for the right moment—regulatory clarity, growing interest in crypto ETFs, and progress in U.S. Congress (with the CLARITY and GENIUS bills gaining momentum).
What It Means for the Industry
Increased Investor Trust – Public companies must disclose financials, pass audits, and comply with regulations. This builds confidence in the broader crypto sector.
Institutional Capital Inflow – IPOs unlock access to capital from pension funds, hedge funds, and asset managers that cannot invest in private crypto startups.
Marketing Power – Going public draws media attention and boosts brand awareness. Every IPO is a PR win for the entire industry.
Risks and Challenges
Regulatory Uncertainty – Despite progress, the SEC could change direction, especially with potential political shifts.
Overvaluation Concerns – Circle’s stock is already raising eyebrows, with a P/E ratio over 200 and trading volume growing faster than revenue.
Crypto Market Dependency – If crypto prices crash, the valuations of these companies could quickly collapse.
What’s Next
Expect up to 10 more crypto IPOs over the next 6–12 months, including players in DeFi, blockchain infrastructure, and Web3. This is the next stage in crypto’s journey toward mainstream legitimacy.
What was once the domain of tech rebels and early adopters is now becoming a business—with a stock ticker and quarterly earnings. And that changes everything.
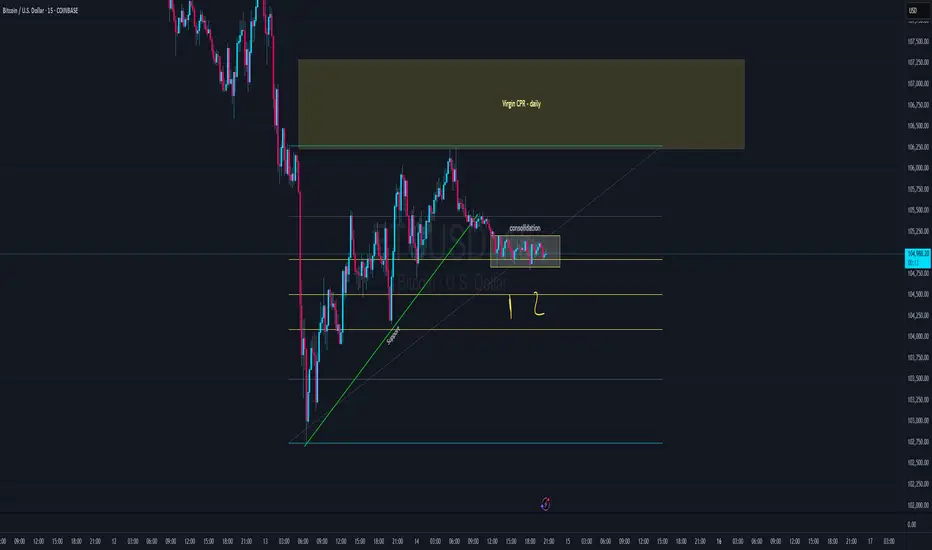
Bitcoin in 15 mints time frameCurrently, it's in the consolidation zone
Once it breaks the zone, we can watch the next support/ resistance level