Bitcoin(BTC/USD) Daily Chart Analysis For Week of June 13, 2025Technical Analysis and Outlook:
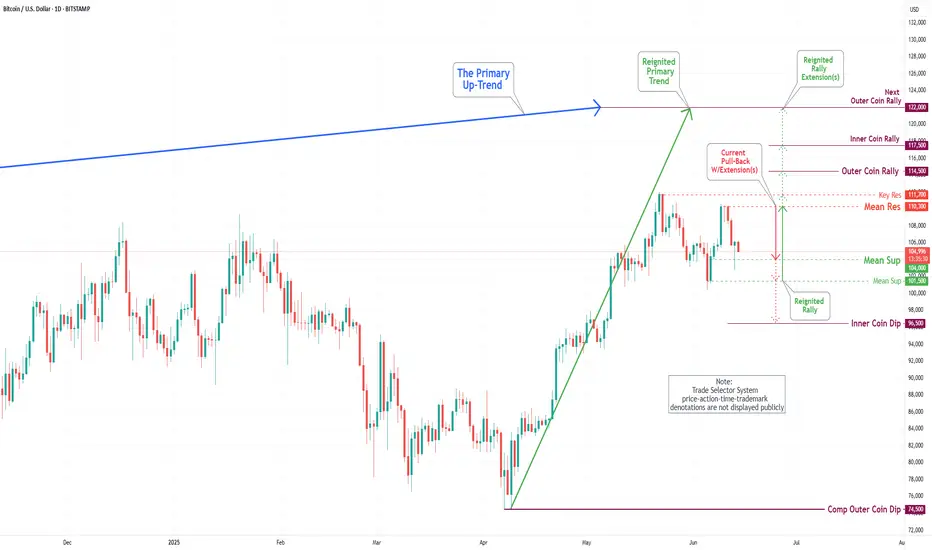
Throughout the past week, Bitcoin has exhibited considerable volatility. After reaching a peak at the first Mean Resistance level of 109500, the cryptocurrency experienced a significant decline. Nevertheless, on Friday, Bitcoin demonstrated a notable recovery, ascending to a newly established resistance now designated as the new Mean Resistance level marked at 110300.
At this juncture, Bitcoin is retracing downward as it retests the initial Mean Support level of 104000 while aiming to target the Mean Support at 101500 and the ultimate Inner Coin Dip at 96500. It is essential to recognize the potential for an upward rally from the Mean Support levels of $ 104,000 and/or $ 101,500, which could culminate in a retest of the Mean Resistance level of $ 110,300.
BTCUSD.PI trade ideas
BTCUSD Hey everyone,
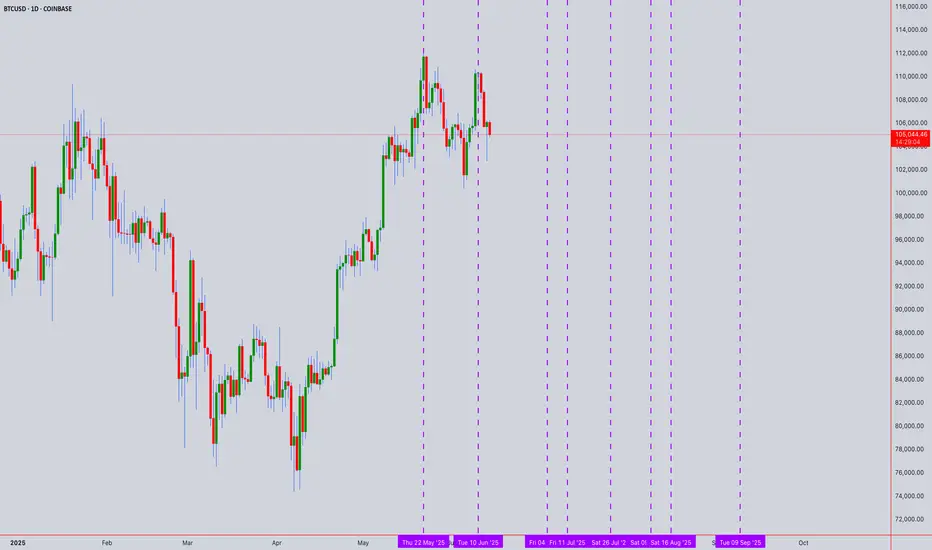
Taking a closer look at the BTCUSD chart, I've plotted some interesting price levels that could act as significant support and resistance in the coming weeks. This analysis aligns with what appears to be a trend-based Fibonacci time analysis, and I've also marked some crucial dates where we might see major market changes.
Based on our observations, we're seeing a range of important price action. For instance, notice the cluster of highs around the 112,048 to 113,343 area. These levels, particularly those marked with an asterisk such as 112,167, 112,503, and 113,006, have previously shown strong upward movements, suggesting they could serve as notable resistance if price attempts to push higher.
Conversely, on the downside, the levels from 111,952 down to 110,665, with points like 111,833, 111,499, and 110,832 highlighted, have historically seen bounces or significant slowing of downward momentum. These could very well act as crucial support areas, preventing further declines.
As we move forward, it will be crucial to observe how price interacts with these levels, especially around the following dates where we might see major market shifts:
July 4th, 2025
July 11th, 2025
July 26th, 2025
August 9th, 2025
August 16th, 2025
September 9th, 2025
The higher resistance points reaching up to 118,793 and lower support extending to 105,407 define a broader range we'll be watching closely.
Keep an eye on these zones for potential reversals or breakthroughs, particularly around the dates mentioned, which could signal the next significant move for Bitcoin. As always, manage your risk accordingly.
What are your thoughts on these levels and potential turning points? Share in the comments below!
Want to Level Up?
Join Shunya Trade’s Mentoring Program to master these strategies and sharpen your technical analysis skills.
Your Feedback Matters!
Let me know how this analysis works for you—your insights will shape future reports!
Let’s navigate the markets together—wisely and proactively.
Trade safely!
⚠️ Disclaimer: This post is educational content and does not constitute investment advice, financial advice, or trading recommendations. The views expressed here are based on technical analysis and are shared solely for informational purposes. The stock market is subject to risks, including capital loss, and readers should exercise due diligence before investing. We do not take responsibility for decisions made based on this content. Consult a certified financial advisor for personalized guidance.
Price High Price Low
112048 111952
112084 111916
*112167 *111833
*112335 *111666
*112503 *111499
*112670 *111332
*112838 *111165
*113006 *110998
*113174 *110832
*113343 *110665
114017 110001
*114693 *109339
115372 108678
116052 108020
116734 107364
*117419 *106709
118105 106057
118793 105407
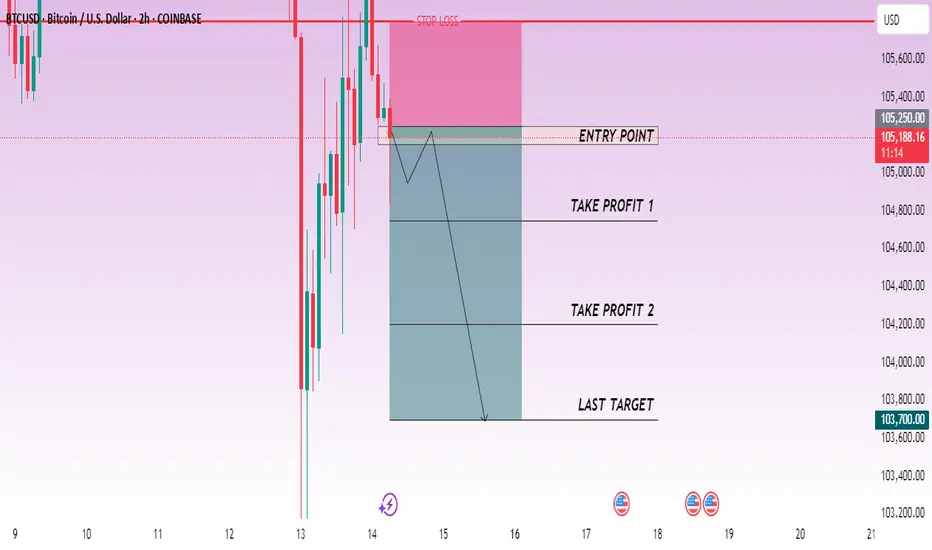
CHECK BTCUSD SIGNAL READ CAPTAINbtcusd sell now ✅
entry point (105.250) (105.150)
TAKE PROFIT 1: (104.750)
TAKE PROFIT 2: (104.200)
LAST TARGET (103.700)
STOP LOSS (105.800)
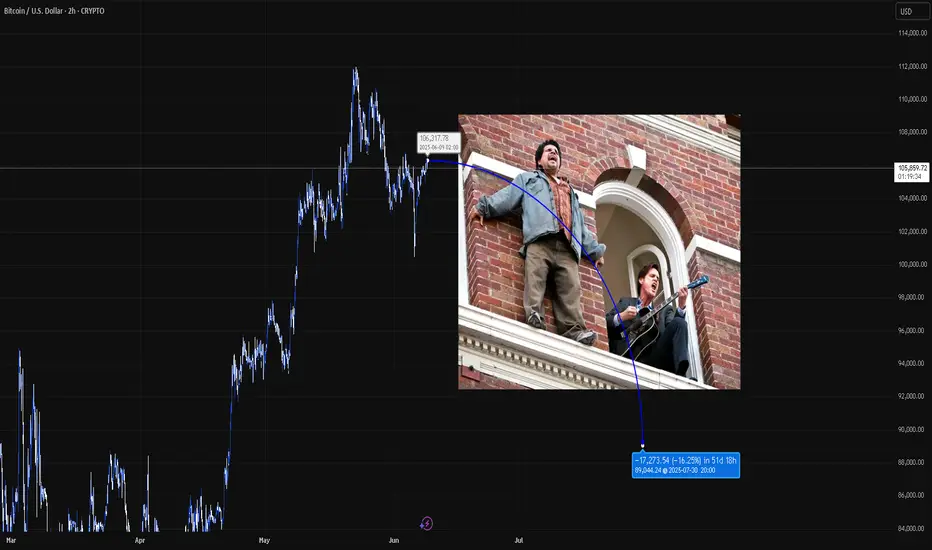
BTC: Is the other shoe going to drop?The move up from June 5th low has been in 3 waves. The current global economic situations have rattled the overall markets this week. Even though BTC is holding the 102k support so far, things are getting much weaker as time passes. If the 102 K support breaks, then we will most likely see a flush down to 95k-90k area. Personally, I will be cautious buyer there. Even a stroll down to 85k won't be super bearish long term. Anything below that might spell bad news. Starting small and assessing the situation will be key. I don't put stop loss on BTC. But, if price keeps getting lower highs, then, breaking 80k will be my signal to get out on the next spike and reassess the situation.
Unfinished downside liquidity Price will have to clear out the downside liquidity and continue to the upside to about $110k

BTCUSD - LONGS📉 BTCUSD Reversion Setup – After the Drop
This dual-timeframe view of BTCUSD shows how the ELFIEDT RSI + Reversion Strategy identified an excellent buy opportunity following a sharp selloff — with signals printing on both the 1H and 15min charts, offering strong confluence for a recovery play.
⸻
🟢 Here’s What Happened:
1. High-Volatility Drop Into Oversold Levels
BTC saw an aggressive downward move, likely driven by news or a liquidation event. Price pushed deep below the lower statistical deviation bands, entering a classic mean reversion zone.
2. 1H Timeframe – Strong “UP” Signal
The 1-hour chart printed a clean “UP” signal right after the bottom formed. This confirmed that the move had extended far beyond normal volatility and that RSI was signaling exhaustion.
3. 15min Timeframe – Supporting Signal with Early RSI Recovery
Shortly before the 1H signal, the 15min chart had already printed an “UP” signal of its own — with RSI sharply recovering from deeply oversold conditions. This served as an early entry signal, with the higher timeframe confirming the broader move.
4. Sharp Bounce Followed
After the signals aligned, BTCUSD quickly rallied over $2,000 off the lows, offering a clean and profitable reversion move.
⸻
✅ How to Use This Type of Setup:
• Watch for aggressive price drops or spikes that push outside statistical volatility bands.
• Look for an “UP” or “DOWN” signal on the lower timeframe (15min) for early entry opportunities.
• Then look for confirmation on the higher timeframe (1H) to strengthen your confidence in the trade.
• RSI recovery across both timeframes adds a momentum-based edge to the mean reversion logic.
⸻
🎯 Why This Worked:
This trade worked because multiple signals lined up at once:
• Deep price extension
• Oversold RSI
• Volume-driven spike
• Multi-timeframe signal agreement
This confluence increases the probability of success and helps avoid false entries during volatility.

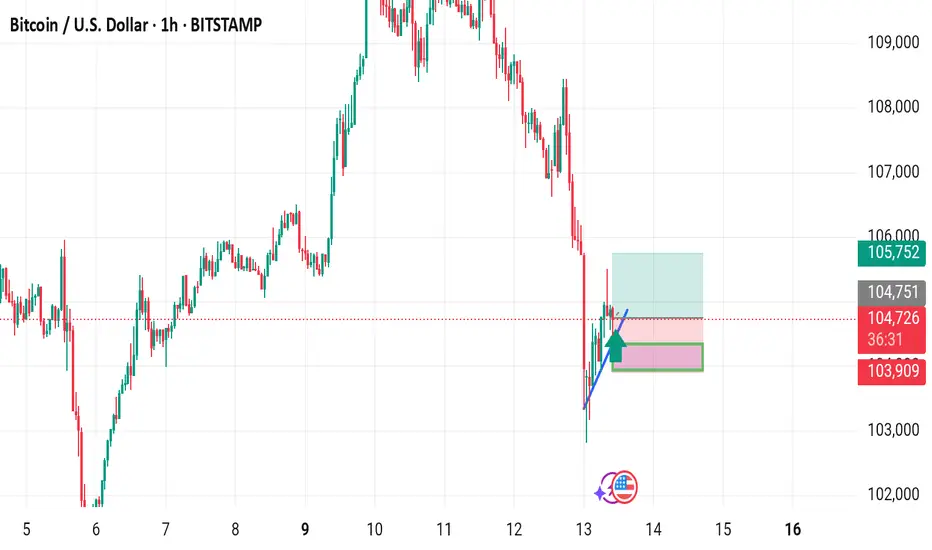
BTCUSD Enter point 104700 target 105700 stop Loss 103900New trade setup:
- Buy BTCUSD at 104,700
- Target: 105,700 (1,000-point gain)
- Stop Loss (SL): 103,900 (800-point risk)
You're going long, expecting BTCUSD to rise. Let's see how it plays out! 💸📈
Will you hit your target?
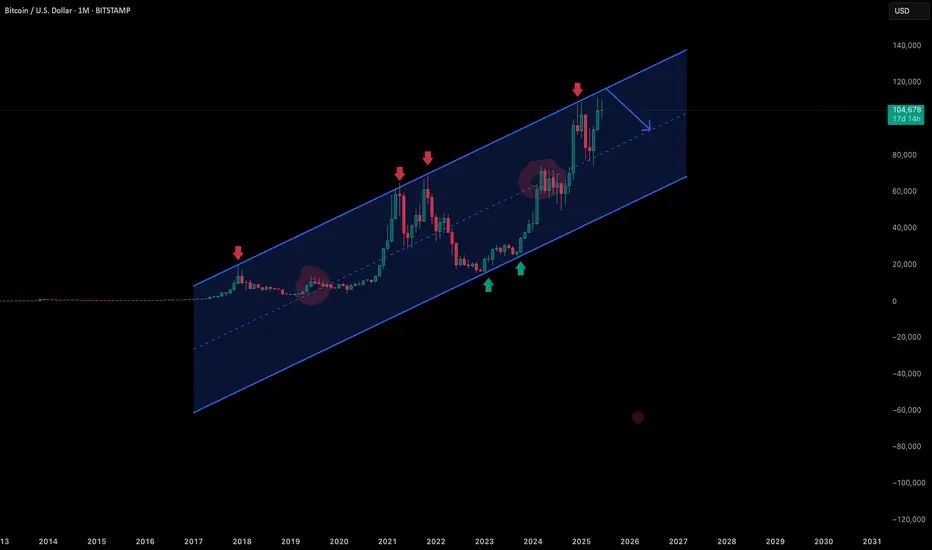
Bitcoin at a Generational Crossroads : The $115k Decision Point Chart: BTC/USD, Monthly Timeframe
Bias: Neutral to Bearish if key resistance holds.
Idea: This is a long-term analysis based on historical price action within a multi-year channel.
Summary (The Thesis):
This analysis looks at Bitcoin's price action on the monthly chart, contained within a large, ascending parallel channel that has defined bull and bear cycles for years. We are currently testing the upper boundary of this channel, a historical resistance zone.
My thesis is that the $110,000 - $115,000 zone represents a critical decision point for the entire market. A failure to decisively break above this level could initiate a significant, multi-month pullback to reset market sentiment and gather liquidity before the next major leg up.
The Macro Analysis (The "Why") :
The Ascending Channel: As you can see on the monthly chart, Bitcoin's price has respected this ascending channel since 2017. The upper line has consistently acted as a major distribution zone and cycle top (marked with red arrows), while the lower line has served as a generational buying opportunity (marked with green arrows). We are currently at the upper line.
Historical Resistance: History shows that the first test of this upper channel boundary is rarely successful. The price often requires a significant consolidation or a deep correction before it can muster the strength to break into a new price paradigm.
Market Mechanics & Liquidity: From a market mechanics perspective, a massive number of longs have entered the market since the move up from the $70k-$75k range. A "huge pullback" would serve to liquidate these late, over-leveraged positions, allowing market makers to absorb liquidity and build the necessary foundation for a sustainable break of the all-time high later on.
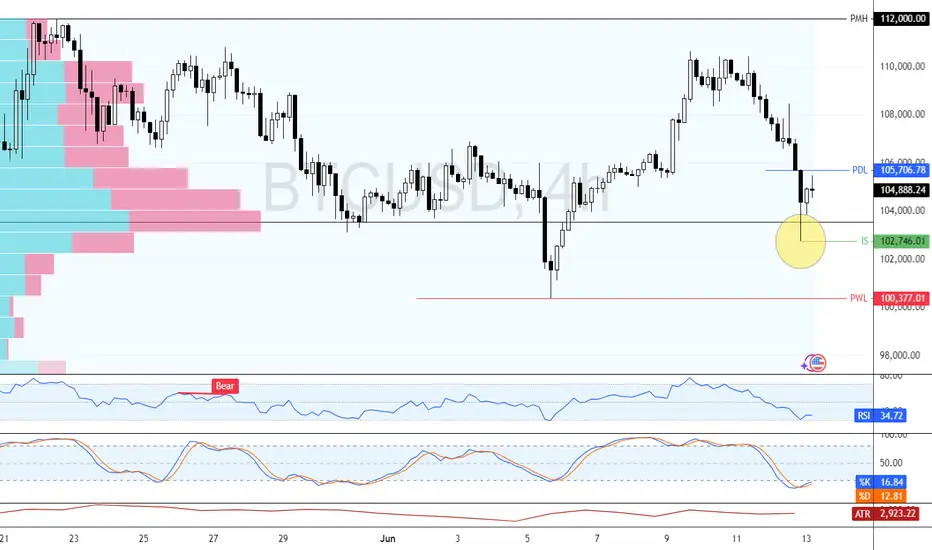
BTC/USD Faces Key Support—What’s Next for Bitcoin? FenzoFx—Bitcoin dipped from its $112,000 monthly high, now trading near $104,900. Liquidity was swept, forming immediate support at $102,746.
Stochastic signals an oversold market, suggesting potential consolidation or an uptrend resumption. BTC/USD must close above $105,706 for bullish momentum, targeting $112,000.
A rejection at $102,746 may invalidate bullish outlooks, driving BTC toward $100,377.
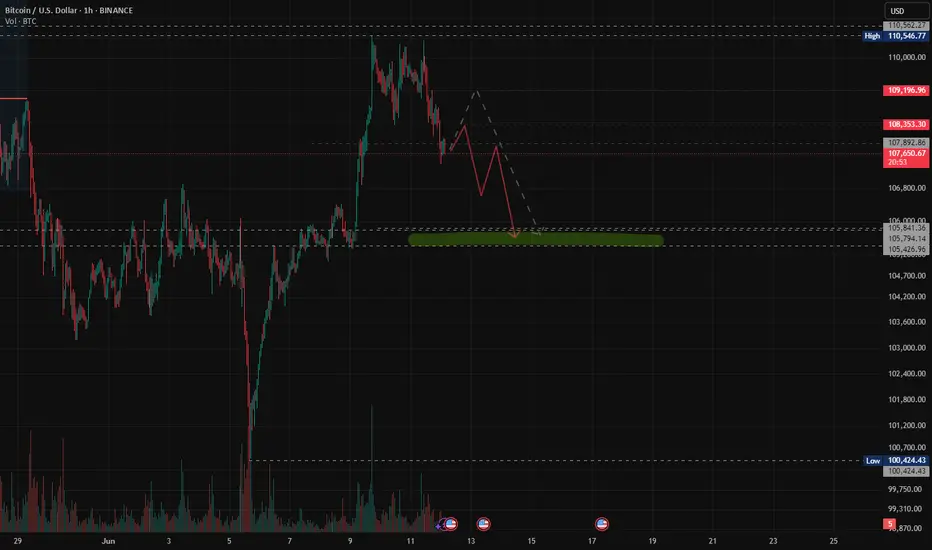
BTC 1H105800 maybe is the target but we have so many come backs until we hit it .
the 108k and then 105k path is more likely to happen.
𓄀𝓈𝓉𝒶𝓎 𝓉𝓊𝓃ℯ𝒹 𓃓
BTCBitcoin experienced a significant drop due to the news about the war in Iran. The price tested a lower support level and then rebounded from that point. We'll have to monitor how the situation in the war unfolds in the coming days. If the price breaks below $103,000, it could fall to the support area between $100,000 and $101,000.

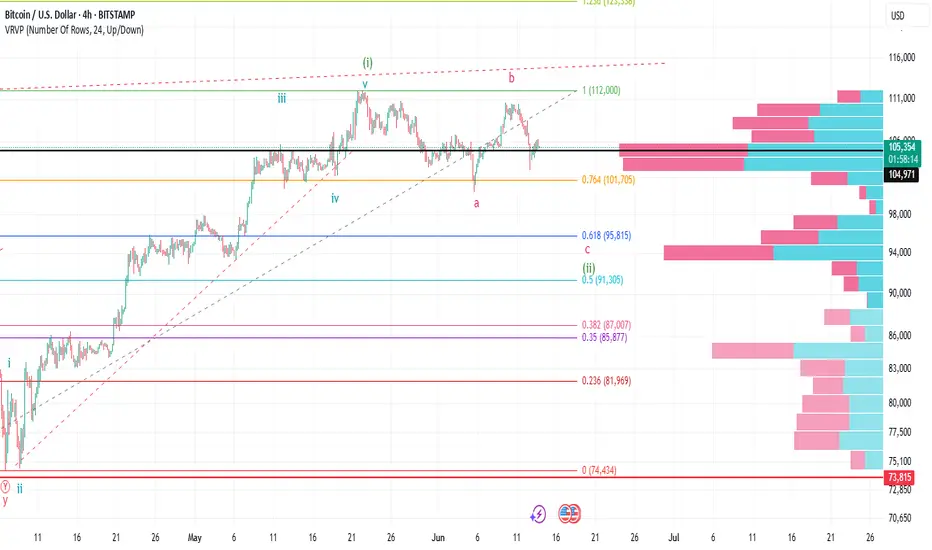
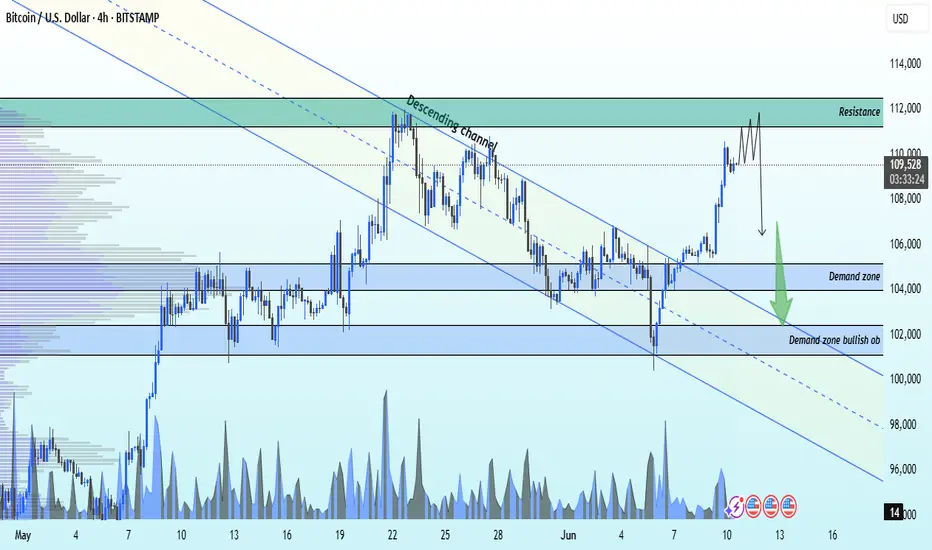
BTCUSD (BITCOIN) Selling From key resistance 111.700BTCUSD BREAKOUT ALERT
BTCUSD has recently broken out from the ascending channel and is currently experiencing strong selling pressure after hitting the key resistance level at $111,700.
🔻 Technical Targets 🔻
1st Target: $105,400
2nd Target: $101,600
📊 Time Frame: 4-Hour
Stay tuned for more updates and insights on the market! 🚀
💬 Don't forget to like, follow, and comment below for more real-time analysis.
BTCUSD testing ascending channel Fundamental:
Bitcoin reels from geopolitical shockwaves as markets brace for an escalation of Middle East tensions.
Meanwhile, spot bitcoin ETFs saw outflows exceeding 200 mln USD, reflecting weaker institutional appetite.
With global markets faltering, volatility remaining elevated, and sentiment fragile, risk assets like bitcoin face renewed pressure.
Technical:
BTCUSD retreated below the ascending channel's upper bound and is currently testing the channel's lower bound and Ichimoku Cloud. If BTCUSD breaks the channel's lower bound and psychological level at 100000, the price could extend its decline to the following support at 92500. Conversely, a rebound from the channel's lower bound and break above the resistance at 11200 could prompt a further rise toward the channel's resistance and Fibonacci Confluence levels near 120000.

$BTC Post Market update - Bearish MenaceHello Fellow Gamblers,
In this video I talk about our current bullish scenario and bring back the bearish scenario that I shared with you a few days ago since they are both still at play.
- We need the 4h to close above 104k and to reject the trendline for the bullish scenario to play out. A close below 104k will take us to a really dangerous zone at that 101k and increase the chances for the bearish scenario to playout.
- Levels to watch: 110.5k, 106.8k, 104.3k, 101k.

BTC - No champange toast Well, that was unfortunate. BTC too the very beating that was forecasted. Demonstrating the power of the combined methods that I use. Murrey Math, Elliot Wave, and K wave ( Kumar Wave ) We have a small chance, in the low single digits to recover from this. But the Lions share of probability remains with the Re test down toward $84k. I will update more later. That chart is in my profile. Good luck.
BTCUSD NEW LOOK ANNALSIS BULLISH ACCURATE 12/6/2025Buy 107500 107200
take profit 107800
take profit 108300
take profit 109000
stop los 106500

BTCUSD 6/12/2025UP UP & AWAY!!!! Get ready for this beautiful continuation!!!!
_SnipeGoat_
_TheeCandleReadingGURU_
#PriceAction #MarketStructure #TechnicalAnalysis #Bearish #Bullish #Bitcoin #Crypto #BTCUSD #Forex #NakedChartReader #ZEROindicators #PreciseLevels #ProperTiming #PerfectDirection #ScalpingTrader #IntradayTrader #DayTrader #SwingTrader #PositionalTrader #HighLevelTrader #MambaMentality #GodMode #UltraInstinct #TheeBibleStrategy
Interesting on TESLA and BTCInteresting on TESLA and BTC using "/" allows you to put any stock against the other one.

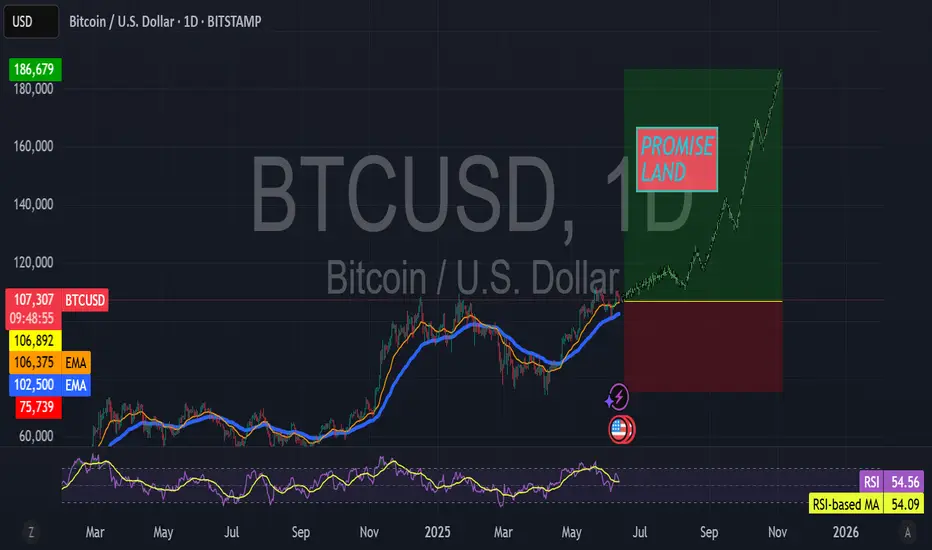
BTCUSDOKAY DEGENS
BTC is on a growth cycle not an innovation cycle which means slower growth, extended top, hypercycle on the backside and no double top BS like last time. The market will act like it did in 2017 going parabolic in LATE OCT/EARLY NOV. My low end target is 140k but it works on a time fractal for a November exit, so if we ain't at 140k by AUG that will probably be the top in NOV. So readjust, but I am a degen so I will shoot for 180k unlike the tards going for 240k thinking this is 2017 expect 1000% gains, we are at the top of the stock to flow model... This means adoption is slower and at the price action we are at now it is more difficult to "make number go up." Muhammad can't through a 60$ 100x trade anymore on swaps to push the price. Imagine that 240k for fake internet money, WILD, anyway don't make your greed translate into stupidity. Trust me I know, alright then... going to hang out with my second ex-wife's boyfriend Tyrone, see ya fellas.
I would be happy to share my thoughts on growth models vs innovation models in the BTC market.
"Where are my kids?"
-KewlKat
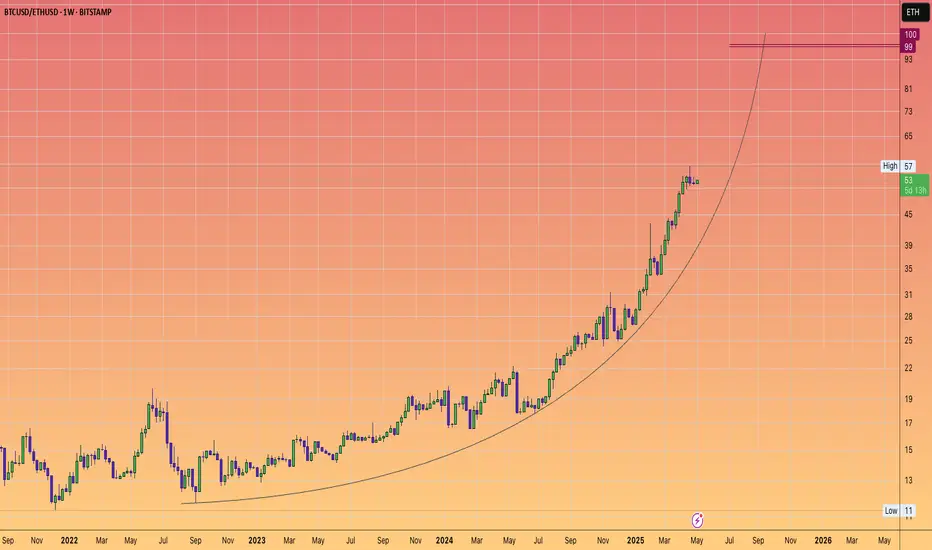
BTCETH parabolic run pointing towards 100:1Historically, during bull markets, Ethereum frequently surpassed Bitcoin at various moments.
However, this time around, that trend has not materialised, leading to a decline in investor confidence.
With capital exiting the ETH market, sentiment has soured, and critical indicators are revealing significant losses.
Unless a robust bullish turnaround occurs, Ethereum's struggle may persist, as the market currently favors Bitcoin as the more secure option.
However once this parabola breaks, we could see a strong snap back reaction in favour of the more riskier #ALTS, #DEFI and #MEMES as #ETH is still the home for stablecoin issuance and still the most trusted secure smart contract blockchain available.
Huge Ready BTCAs we learn at start, trend is your friend... :)
Here is our friend, singing as some good song.
Thank you.
Wishing you great week! :)
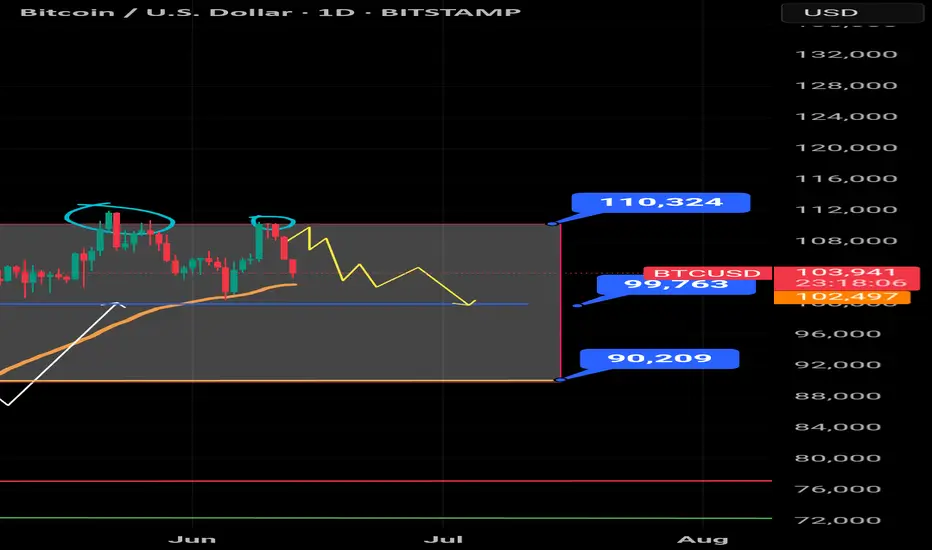
BTC CONSOLIDATESBitcoin may be forming a *lower high* on the daily chart, with the most recent rally stalling at \$110,000 – just below the previous high near \$112,000. That failure to reclaim the prior high is an early sign of weakening momentum and suggests the strong uptrend that’s been in place since April might be losing steam.
The critical level now is \$100,000. That’s the most recent swing low, and it serves as the key structural support in this current move. A daily close below that level would confirm a *lower high–lower low* sequence, shifting the short-term trend from bullish to neutral or even bearish. If that happens, downside targets open up around \$97,000 – the next clear support – followed by \$95,500, where the rising 200-day moving average now sits.
Momentum indicators support this caution. RSI is trending down and making lower highs, showing a loss of bullish strength. Volume has also declined during recent rallies, hinting at buyer exhaustion rather than healthy consolidation.
For the bulls to retain control, the 50-day moving average near \$103,000 needs to hold. If that level fails, a test of \$100,000 is likely. On the flip side, a strong move back above \$110,000 would invalidate the lower high setup and put the breakout narrative back in play.
Right now, the market is at a decision point. The trend hasn’t broken yet, but structure is starting to crack. A confirmed lower high at \$110,000 – followed by a break below \$100,000 – would mark the first significant trend shift on the daily chart in months.
