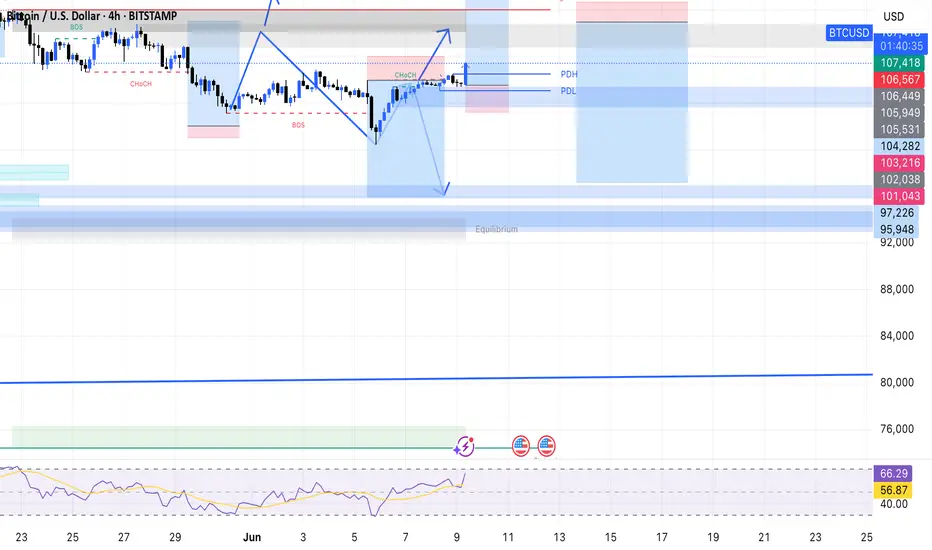
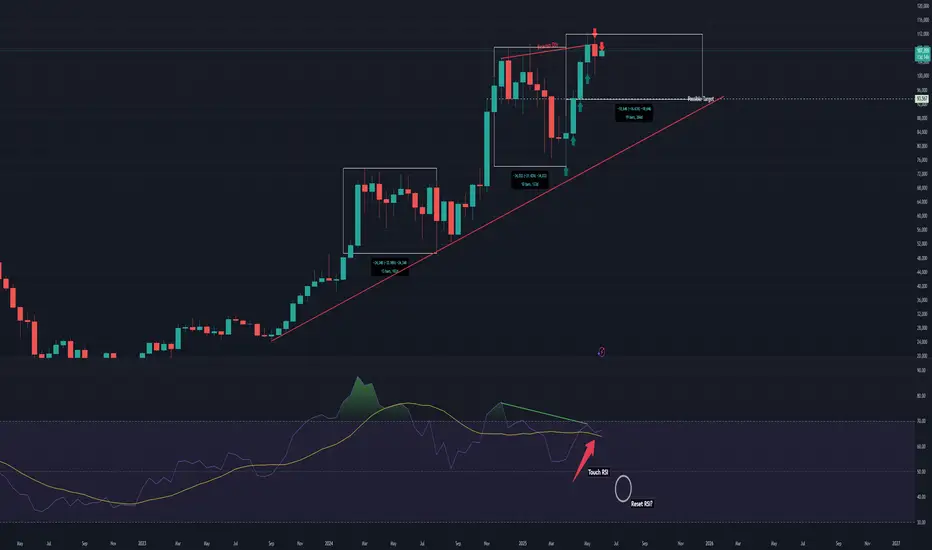
BTC (Y25.P2.E7). Bullish or Bearish setupHi traders,
Since we broke above the macro VAH, which could act like support, I'm expecting new highs, However If the 4 hour candle closes below the Anchored vWAP, then we look for Wave B in this recent move.
Difficult to call.
ABC to the upside and then a deeper correction like other ATH, with 12 to 14%.
I'm leaning to bullish and price to range sideways before making another bullish move to the upside.
We have 2 scenarios for sideways, mild or deep and broad.
Examples given below with the fractal of previous ATHs
Please give me a like and share,
Regards, S.SAri
BTCUSD.PI trade ideas

BTC (Y25.P2.E4). Potential bullish fractal to take placeHi traders,
Price is bullish and its likely we will see more ATH to come.
Here, with a peak, followed by a troph, we found support like the macro Y21 BTC price action. Hence finding that support level makes sense to long.. To early to find a long but it could come soon.
Alternatively, we see a AB=CD move to 105k level, but this is looking less likely
The ABC target, is 1 to 1, which aligns to take the liquidity above this ATH level.
Or Its a wave 2 level and hence a bigger move of wave 3.
All the best,
S.SAri

BTCUSDHello trader, this week the bitcoin possible price action.. the price is currently filled the 1hr fvg and it could go bullish but still have high risk since day candle is bearish... the next price it can reverse from is around 88k after filling daily fvg... and if dollar get stronger then price can continue to 74k... weekly candle is still bullish though however anything can happen if bullish liquidity drops.. chart is just based on Fvg and the MACD
good luck

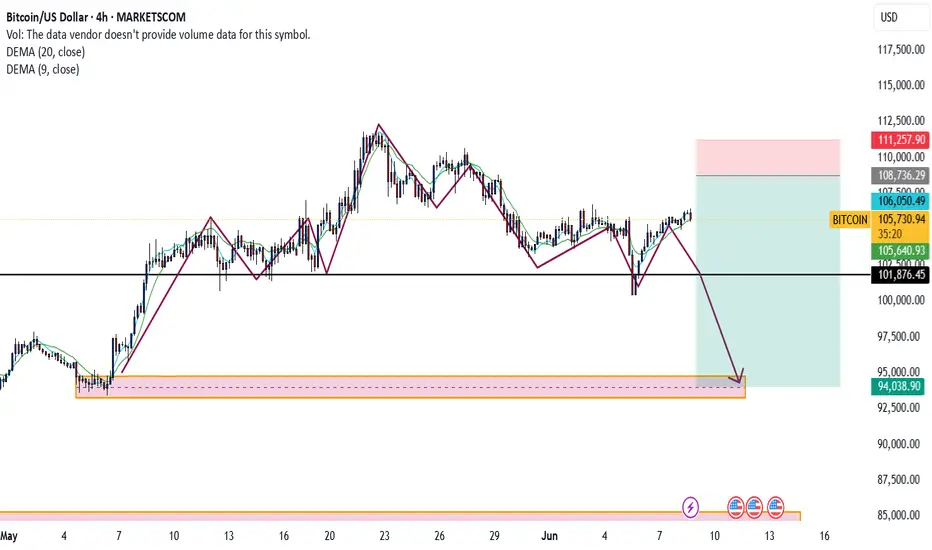
Bitcoin B-Wave Trap? Major C-Wave Down Correction Incoming!Bitcoin’s recent bounce has all the signs of a classic B-wave in an ABC corrective structure. After the impulsive A-wave down from the highs, this current rally appears more like a corrective relief move rather than the start of a new bullish impulse. Volume remains weak and the structure looks choppy — not the kind of strength you’d expect from a sustainable uptrend.
I believe we are now completing the B-wave, luring in late bulls before the real drop — the C-wave — begins. This next leg down could be sharp and painful, targeting key support zones and possibly wiping out the complacency that’s built up in the market.
🧠 Watch for signs of exhaustion in this rally.
📉 Potential C-wave targets: 98k 97k
⏳ Timing and structure suggest we’re close to the turning point.
Stay cautious. This could be the calm before the real storm.
---
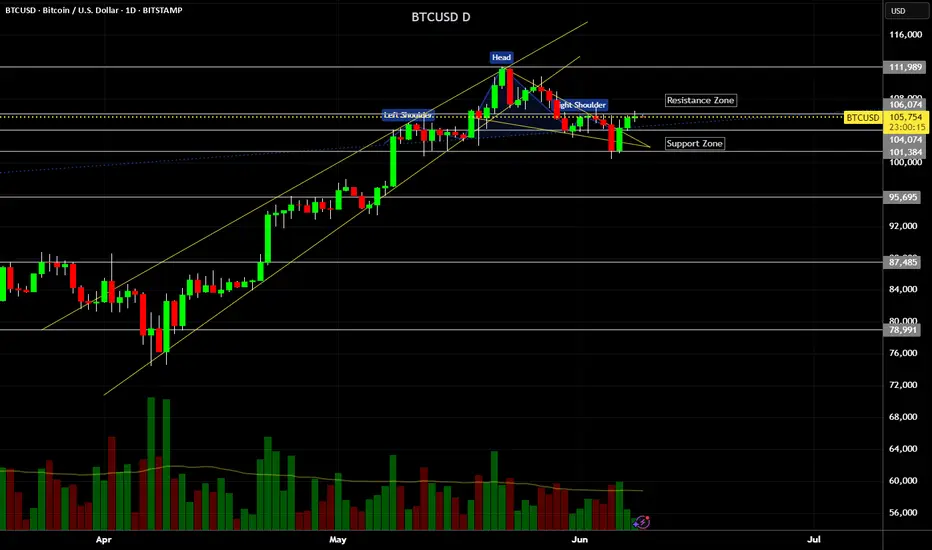
Inverse Head and Shoulders on the Daily for BitcoinInverse Head and Shoulders on the Daily for Bitcoin

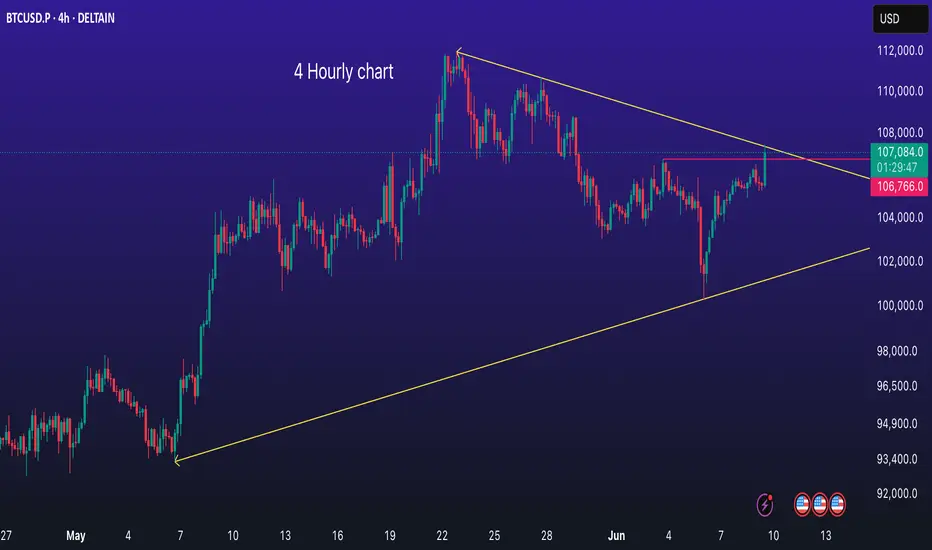
Bitcoin (BTCUSD) 4-Hour Chart Update 🚀 Bitcoin (BTCUSD) 4-Hour Chart Update 🕓
BTC just made a sharp V-shaped recovery from the recent drop and has convincingly broken above its resistance range. 📈
Currently, it’s flirting with trendline resistance — a critical level to watch! 📊
🔍 Is this the beginning of a fresh bullish wave? Or just a pause before the next move?
📢 What’s your take on this breakout? Bullish continuation or a fakeout?
BTC moving as it gave us a buyside biasMarket moving with a moment after we saw the shift in market sentiments
Like and follow for more daily updates
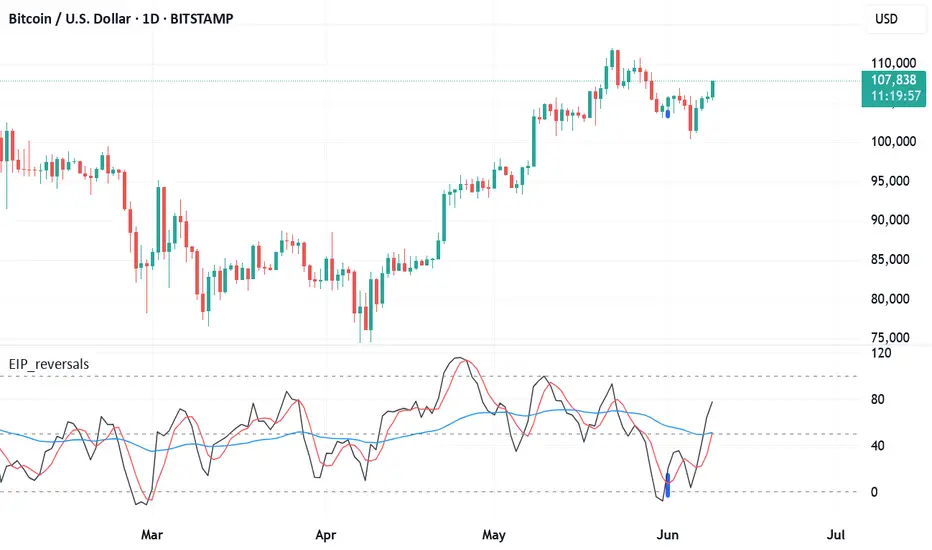
BTC Volatility in play? Bearish DIV plays out, we get a flush out for lev on greedy longs making OI on Spot Spike up and create a short squeeze in scarcity
The RSI deviates under the 50 line, we bounce off the trend line and we go to oversold
If BTC blows out of 110K, we will have that inversve head and shoulder in play
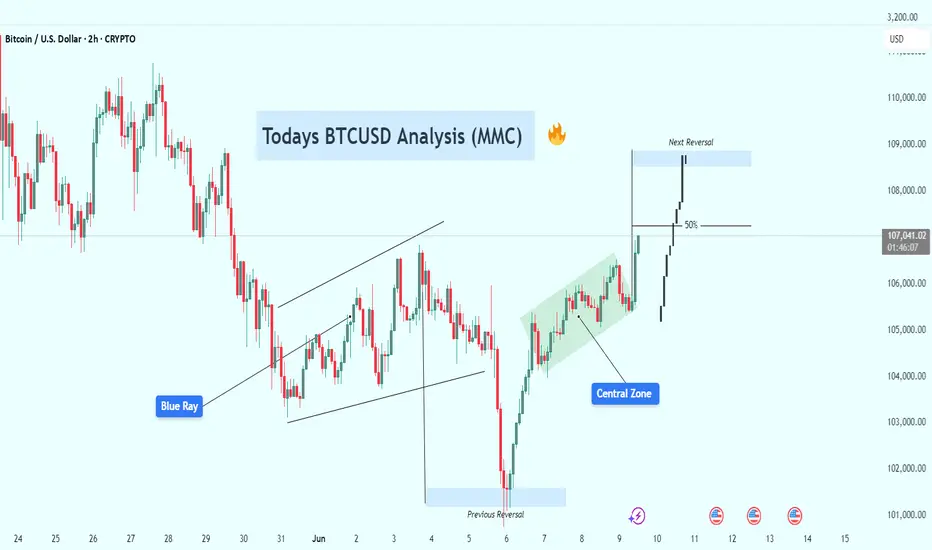
BTCUSD VIP Analysis – Clean Breakout Toward 109K + Target🧠 Full Technical Breakdown for TradingView & Minds
🗓 Date: June 9, 2025 | Asset: Bitcoin (BTC/USD) | Chart: 2H Timeframe
Bitcoin is currently staging a strong breakout rally after consolidating within a bullish structure. This move appears to be fueled by smart money accumulation and could lead us directly into a high-probability reversal zone just below 109K.
Let’s dive into the full structure and what traders should look out for next.
🔍 1. Previous Market Behavior (Left Side of Chart):
Before the breakout, BTC had been trading inside a bearish channel, experiencing sharp rejections and forming lower highs. This downtrend climaxed at the Previous Reversal Zone, where strong buyer interest kicked in — this is a textbook example of a liquidity grab followed by buyer absorption.
📈 2. The Reversal & Blue Ray:
From the Previous Reversal Zone, BTC formed a solid impulsive move upward — this is where the Blue Ray trendline was drawn. This level acted as the initial support for the new bullish structure.
The move from this point formed a new trend, indicating that buyers had successfully reclaimed short-term control of the market.
🟩 3. Central Zone – Bullish Reaccumulation Area:
As BTC progressed, it entered a green bullish channel, which we’ve labeled the Central Zone. This zone shows consolidation within a rising wedge, typically a continuation pattern if volume remains steady.
Notice how price respected both boundaries of the channel multiple times before exploding upwards. This is a sign of smart money reaccumulation, where institutions are quietly preparing for the next leg.
🚀 4. Breakout to the Upside:
BTC has now broken out cleanly from the Central Zone with an aggressive bullish candle, pushing price above 106,000. This breakout suggests a mid-move continuation, and current price action is heading straight for the Next Reversal Zone between 108,800–109,200.
Also note the clean cross above the 50% Fibonacci zone, which further supports the bullish thesis.
🔹 5. Next Reversal Zone (Target Area):
This is the most critical zone on the chart. Price may:
Reject sharply from this area (short opportunity),
Consolidate before continuation,
Or sweep liquidity above it and reverse hard.
This zone could act as a smart money sell zone, where large players unload positions, especially if retail traders jump in late.
🧮 6. Possible Scenarios Ahead:
Scenario A – Bullish Continuation:
Price breaks 109K cleanly with volume.
Next target: 111K–112K (extension level).
Scenario B – Rejection from Reversal Zone:
Price stalls near 109K.
Bearish engulfing candle forms.
Short opportunity back toward 106K–104K.
Scenario C – Fakeout Above 109K:
Price sweeps highs (liquidity trap).
Fast reversal back into Central Zone.
🎯 Trade Setups:
🚨 Breakout Buy (Already Triggered):
Entry: 105,500–106,000
Target 1: 107,500
Target 2: 108,800
SL: 104,800
🛑 Reversal Short (Pending):
Entry: 108,900–109,100 (with confirmation)
Target: 106,000
SL: 109,600
⚠️ Fundamental Awareness:
Multiple U.S. economic events this week (see calendar icons below the chart).
Increased volatility expected — use smaller positions or wider stops near data release times.
📌 Final Thoughts:
This is a classic example of smart money behavior — liquidity grab, controlled reaccumulation, then a breakout toward a magnet zone (reversal supply). If you're already in the move, manage your positions. If not, wait for price action confirmation near the key zone.
Is Bitcoin hearing for a ATHs, again?After reaching new highs around $112k, BTC has since retraced to support around $100k.
Currently reclaiming support around $105k, continued strength could see price reach ATHs in the coming days or weeks.
Losing support around $105k could signal a retest of $100k.
Referring to a previous post, my theory that we may not see sub $100k for the rest of the year is still in play, perhaps a signal of market strength despite the fear of the bull market ending.
Evidently, BTC is still holding up to all bullish expectations... Until proven otherwise.

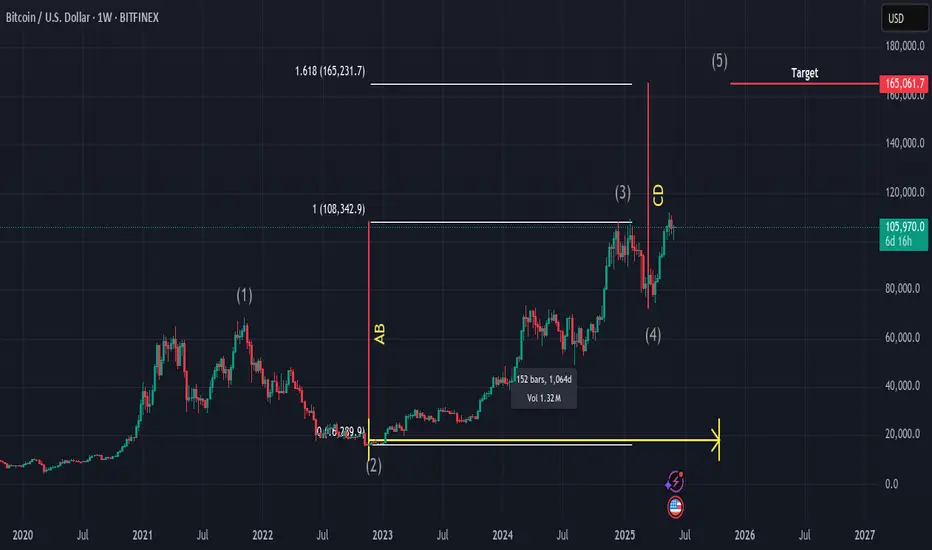
BTCUSD analysis for this cycle TopBTCUSD analysis for this cycle Top
1. According to the Elliot wave it is the 5th wave of elliot theory
2. As per the time cycles Btc should define the top in the last quarter of this year possibility in (oct or nov)
3. And for the projection as always the Btc favourite patthen AB=CB is also in play.
4. Fib extension tool level 1.618
So as we can see if btc will play according to this analysis. As its always follows this same things again & again in all cycle. So we can expect the top somewhere around (165,000).
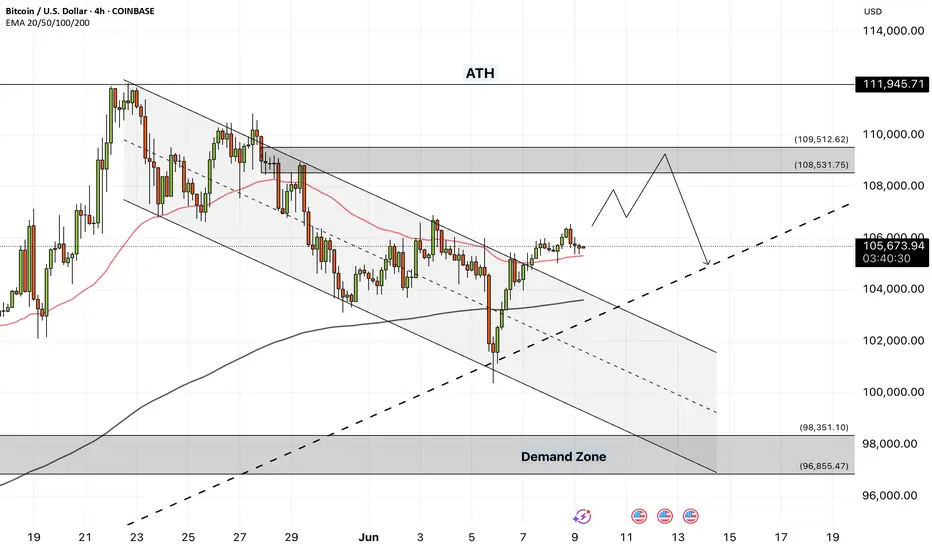
Bitcoin - Bitcoin holds $100,000 support?!Bitcoin is above the EMA50 and EMA200 on the four-hour timeframe and has broken out of its short-term descending channel. We can look for Bitcoin short positions from the supply zone. If this corrective move occurs, we can also look for Bitcoin long positions in the demand zone.
It should be noted that there is a possibility of heavy fluctuations and shadows due to the movement of whales in the market and capital management in the cryptocurrency market will be more important. If the downward trend continues, we can buy in the demand range.
Bitcoin network transaction activity has dropped to its lowest level since October 2023. According to data from The Block, the seven-day moving average of Bitcoin transactions has recently declined to 317,000—marking the lowest point in the past 19 months. This decline comes at a time when Bitcoin’s price still hovers near its all-time highs.
Meanwhile, Bitcoin Core developers have recently stated that network nodes should not block the relay of low-fee or non-standard transactions if miners are willing to process them. This highlights a shift in Bitcoin’s policy direction and indicates a growing acceptance among some miners of lower-cost transactions.
In certain instances, miners’ appetite for transaction fees appears to have diminished. Mononaut, founder of the Mempool project, pointed out that a transaction with an almost-zero fee was recently included in a block. This could signal reduced network activity or a declining need among miners to prioritize high-fee transactions.
Currently, only 0.3% of American investors’ total assets are allocated to Bitcoin. Real estate dominates their portfolios, followed by bonds and stocks.This means that Bitcoin accounts for a very small portion of U.S. investor wealth. However, if even a small fraction of capital currently tied up in real estate, stocks, or bonds shifts into Bitcoin in the future, it could have a substantial market impact—an encouraging sign over the long term.
The United States has emerged as the dominant force in the Bitcoin ecosystem. A report by River outlines how this dominance has reached its peak. The U.S. holds nearly 40% of the total Bitcoin supply, and American companies account for a staggering 94.8% of public Bitcoin ownership. Additionally, 82% of development funding and approximately 79.2% of Bitcoin ETF ownership originate from the U.S. The country also commands about 36% of the global hash rate.
Since 2021, the total value of Bitcoin mined by American companies has reached $42.6 billion, accompanied by over $30 billion in investment into Bitcoin mining infrastructure. The U.S. now hosts more than 150 Bitcoin-related companies and 40 mining sites with capacities exceeding 10 megawatts.
Today, nearly two-thirds of all Bitcoin in circulation is held by individuals who rarely—or never—sell their coins. In just the last 30 days, roughly 180,000 Bitcoins have been moved to wallets with historically low selling activity. Meanwhile, whales continue to accumulate Bitcoin at price levels above $100,000.
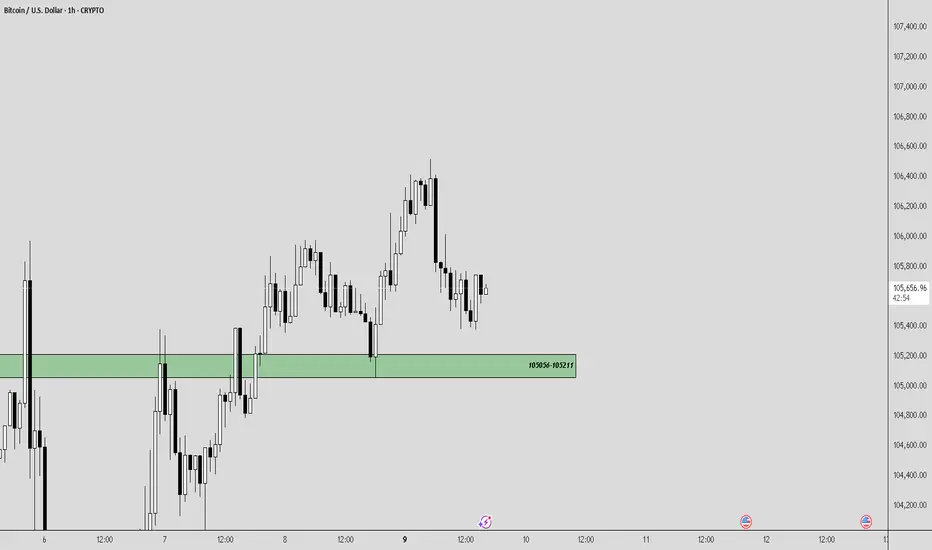
BTC/USD – 1H Price Action Update📈 BTC/USD – 1H Price Action Update
🟩 Demand Zone: 105056–105211
Price dipped into this short-term demand zone and showed a bullish reaction — confirming buyers' interest at this level.
🔍 What to Watch:
✅ Hold above 105211 = potential bullish continuation
❌ Break below = revisit lower liquidity pockets possible
📊 Price currently consolidating after a sharp reaction — wait for breakout or retest confirmation
🎯 Use this zone as your intraday reference point!
#BTCUSD #CryptoTrading #SmartMoneyConcepts #FXFOREVER #BitcoinLevels #OrderBlockTrading #PriceAction
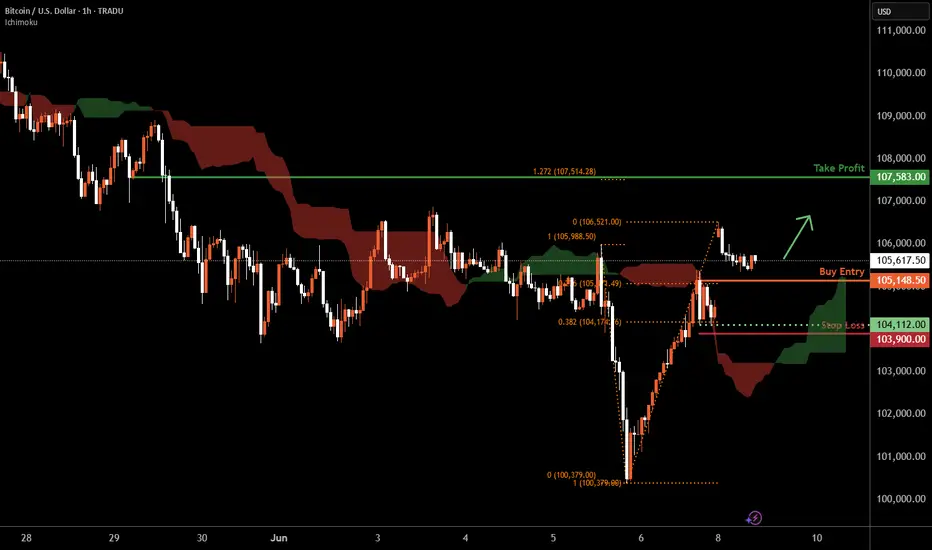
Bitcoin H1 | Bullish rebound to extend higher?Bitcoin (BTC/USD) is falling towards a pullback support and could potentially bounce off this level to climb higher.
Buy entry is at 105,148.50 which is a pullback support that aligns with the 23.6% Fibonacci retracement.
Stop loss is at 103,900.00 which is a level that lies underneath a swing-low support and the 38.2% Fibonacci retracement.
Take profit is at 107,583.00 which is a pullback resistance that aligns with the 127.2% Fibonacci extension.
High Risk Investment Warning
Trading Forex/CFDs on margin carries a high level of risk and may not be suitable for all investors. Leverage can work against you.
Stratos Markets Limited (tradu.com ):
CFDs are complex instruments and come with a high risk of losing money rapidly due to leverage. 63% of retail investor accounts lose money when trading CFDs with this provider. You should consider whether you understand how CFDs work and whether you can afford to take the high risk of losing your money.
Stratos Europe Ltd (tradu.com ):
CFDs are complex instruments and come with a high risk of losing money rapidly due to leverage. 63% of retail investor accounts lose money when trading CFDs with this provider. You should consider whether you understand how CFDs work and whether you can afford to take the high risk of losing your money.
Stratos Global LLC (tradu.com ):
Losses can exceed deposits.
Please be advised that the information presented on TradingView is provided to Tradu (‘Company’, ‘we’) by a third-party provider (‘TFA Global Pte Ltd’). Please be reminded that you are solely responsible for the trading decisions on your account. There is a very high degree of risk involved in trading. Any information and/or content is intended entirely for research, educational and informational purposes only and does not constitute investment or consultation advice or investment strategy. The information is not tailored to the investment needs of any specific person and therefore does not involve a consideration of any of the investment objectives, financial situation or needs of any viewer that may receive it. Kindly also note that past performance is not a reliable indicator of future results. Actual results may differ materially from those anticipated in forward-looking or past performance statements. We assume no liability as to the accuracy or completeness of any of the information and/or content provided herein and the Company cannot be held responsible for any omission, mistake nor for any loss or damage including without limitation to any loss of profit which may arise from reliance on any information supplied by TFA Global Pte Ltd.
The speaker(s) is neither an employee, agent nor representative of Tradu and is therefore acting independently. The opinions given are their own, constitute general market commentary, and do not constitute the opinion or advice of Tradu or any form of personal or investment advice. Tradu neither endorses nor guarantees offerings of third-party speakers, nor is Tradu responsible for the content, veracity or opinions of third-party speakers, presenters or participants.
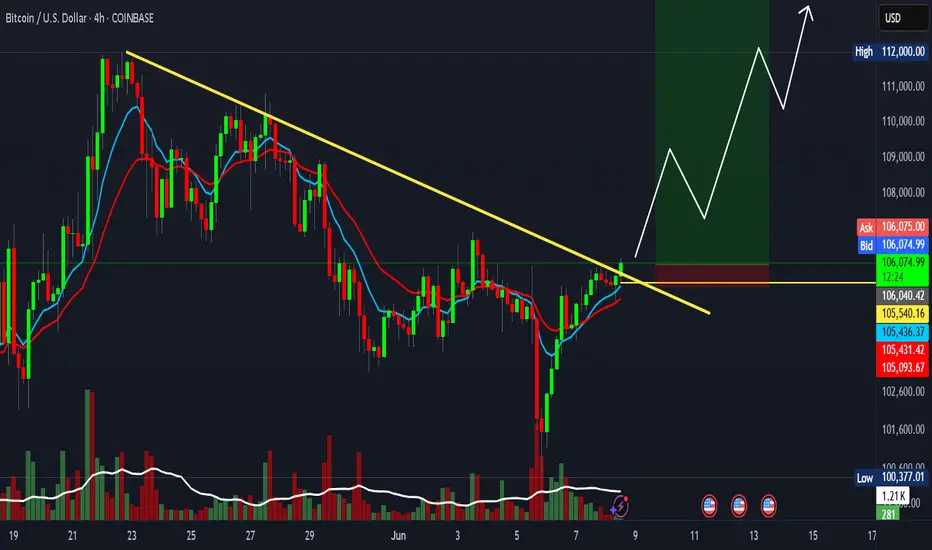
Super high risk setup BTC with 60 R:RIt looks like BTC is about to close the weekly candle above 106K.
If the bulls are still in control, they need to act very soon. The 100K support level has been successfully retested, and now could be the time for a move upward.
📈 Trade Setup (Educational Purpose Only):
Entry: 106,040
Stop Loss: 105,431
Target: 144,000
Risk-Reward Ratio: 1:60
This is a super high-risk setup, but the potential reward is significant. Proceed with caution and always do your own research.
Bitcoin's Bullish Surge: Trends and Projections for 2025 Bitcoin's price is rising due to institutional adoption, ETF inflows, and macroeconomic factors, with analysts predicting highs of $130K–$250K in 2025 81214. Key drivers include halving-induced scarcity, regulatory support, and global liquidity shifts 1011. Short-term volatility persists, but long-term bullish momentum dominates

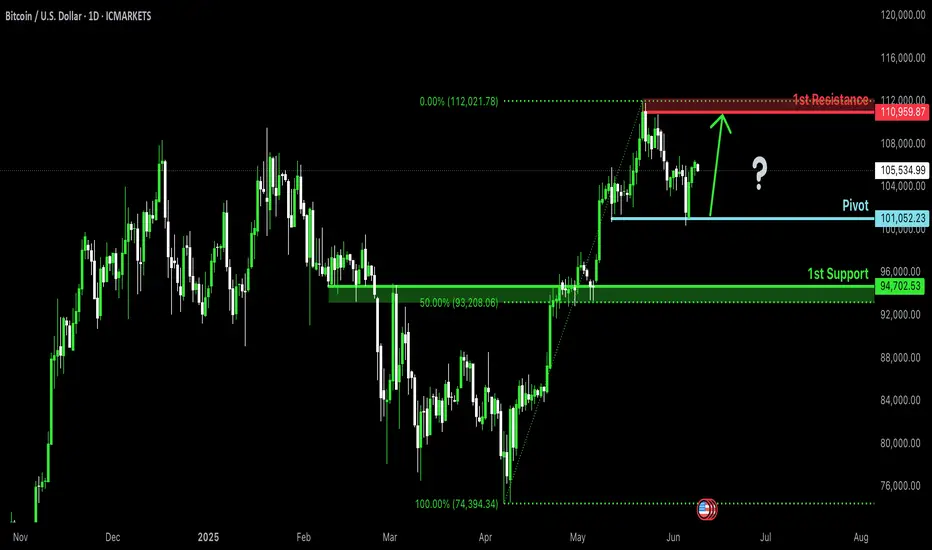
Bullish rise?The Bitcoin (BTC/USD) has bounced off the pivot and could rise to the 1st resistance.
Pivot: 101,052.23
1st Support: 94,702.53
1st Resistance: 110,959.87
Risk Warning:
Trading Forex and CFDs carries a high level of risk to your capital and you should only trade with money you can afford to lose. Trading Forex and CFDs may not be suitable for all investors, so please ensure that you fully understand the risks involved and seek independent advice if necessary.
Disclaimer:
The above opinions given constitute general market commentary, and do not constitute the opinion or advice of IC Markets or any form of personal or investment advice.
Any opinions, news, research, analyses, prices, other information, or links to third-party sites contained on this website are provided on an "as-is" basis, are intended only to be informative, is not an advice nor a recommendation, nor research, or a record of our trading prices, or an offer of, or solicitation for a transaction in any financial instrument and thus should not be treated as such. The information provided does not involve any specific investment objectives, financial situation and needs of any specific person who may receive it. Please be aware, that past performance is not a reliable indicator of future performance and/or results. Past Performance or Forward-looking scenarios based upon the reasonable beliefs of the third-party provider are not a guarantee of future performance. Actual results may differ materially from those anticipated in forward-looking or past performance statements. IC Markets makes no representation or warranty and assumes no liability as to the accuracy or completeness of the information provided, nor any loss arising from any investment based on a recommendation, forecast or any information supplied by any third-party.
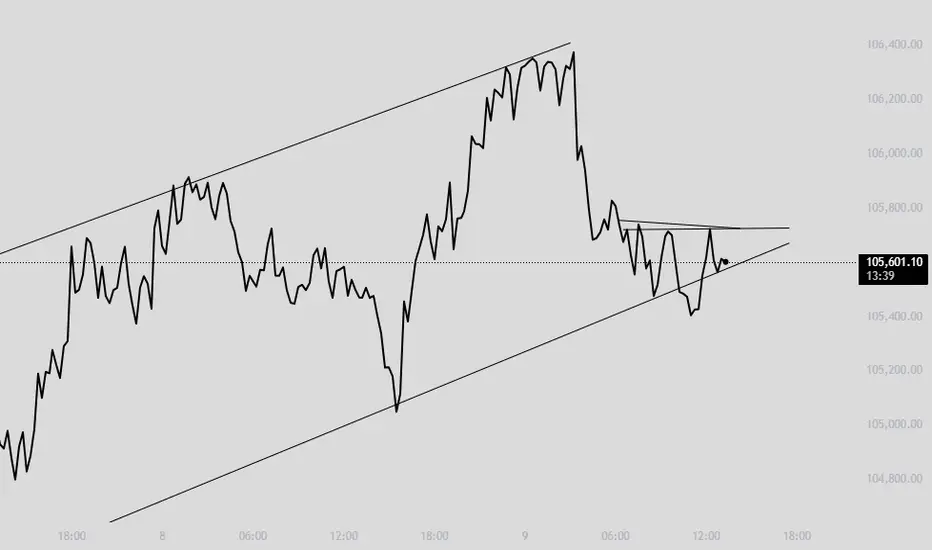
To buy or not to buy BitcoinIf purely looking from chart point of view, I would wait a while...... it is at this consolidation stage and the important resistance line at 105, 415 needs a more convincing break up.
Current price action shows us buyers and sellers are at conflict with one side pushing up while the other is pushing down (shorts or take profits).......
The 100k psychological price level is sensitive and important as well. It needs to stay above this level for the rally to continue.
If you want exposure to bitcoin, consider the BITB ETF . You can sleep peacefully at night ........
As usual, please DYODD

Chart Pattern Analysis Of Bitcoin
From K1 to K3,
It is a three soldiers advancing pattern,
It close below the uptrend line and the neck line of a potential double top pattern.
It seems that a short-term bear run will fall to test 102K area.
I will try to buy it there if the following candles couldn’t close below 0.618fib line.
On the other hand,
If K4 return back upon the neck line immediately,
K3 will be a fake down and the following candles will keep climbing up to test 112K area.
Short-106318/Stop-107318/Target-102188

Bitcoin (BTCUSD) - Daily Price Consolidation Under ResistanceBitcoin (BTCUSD) price has been in a short-term downtrend since June 2025.
Price is currently consolidating under $106,000 resistance.
Watching to see if an evening star candle pattern prints on the daily chart, for a very-short-term pullback.
Support targets: $105,000, $104,000, $101,000, $100,000.
Resistance targets: $107,000, $109,000, $110,000, $112,000.
Bitcoin has been correlating with the USA stock market, tech stocks, consumer sentiment, and breaking news.
Bitcoin Huge Sell coming Bitcoin is poised to break out from the descending triangle pattern on the 4H chart🧐
The Ichimoku Cloud is acting as an additional resistance barrier above current price action.
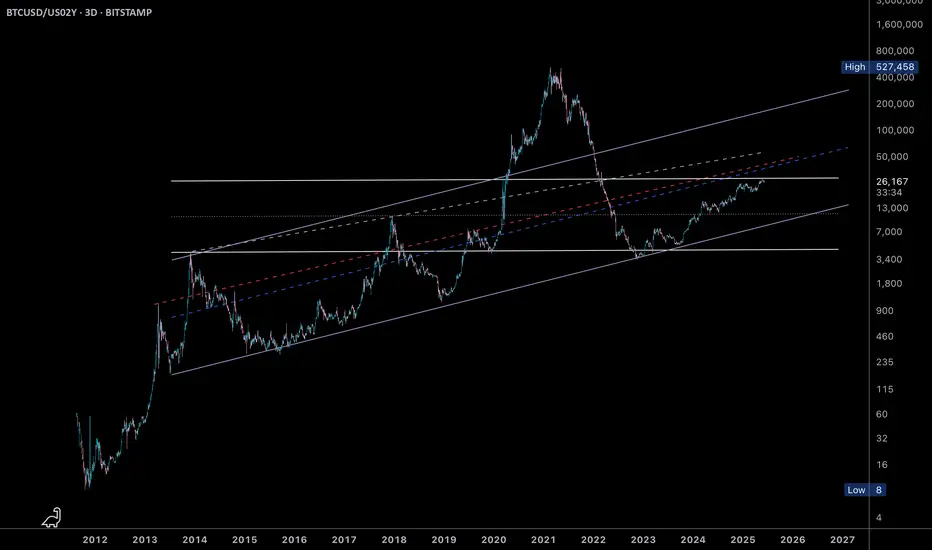
BTCUSD/US02YWen moon?
Seems like BTC will accelerate against the 02Y US… just 1 year ago this was considered a risk asset against a save heaven. The 2 years treasury note is still pretty much under the feds control, seeing that DXY is bullish I don’t think we will get a cut in rates, but BTC will start a rally.