BITCOINwhat i see happening on bitcoin this coming weeks, nice break of structure to the down side now expecting a retest to mitigate a order block, then dropping once again
BTCUSD.PI trade ideas
Bitcoin 4H chart Elliot Wave analysisThe price reacted to the 0.236–0.272 Fibonacci level, effectively marking the end of the WXYXZ correction. However, for a Wave 2, this represents a relatively shallow retracement implying that alternative scenarios must remain on the table. This could still be an unfolding flat structure (3-3-5), with Wave A forming as a triple zigzag though this is less likely. A more probable outcome is a zigzag (5-3-5), which would require a sharper corrective move. Another possible structure is a double zigzag (WXY).

EXPECTING A BULLISH MOMENTUM ON BITCUSD.From my analysis BTCUSD it's about to go Bullish since the golden cross levels on early june daily TF (50 MA) has crossed above the (200 MA) but the Candles Printing on 4H tF also are Showing a Strong Move which may result on the Break of the Resistance that is seen at 105k-106k
When price breaks above these levels then I will Keep holding my Bulling setups.
Unless otherwise I will Close Them All waiting for another Cormfimations🤝📌📊


Targets for Bitcoin Bullish outlook for BTC in the coming days IF we close above 106,1 k.
The 3 day candles indicates we could have a "Three White Soldier Pattern" coming up for BTC. It would be a pattern showing a trend reversal and potenially trigger the next trend to retest the old ATH. Although, I would like to see increase in volume to confirm this during the rest of the day to be more certain on this pattern.
Expecting NASDAQ:MSTR to get really bullish aswell if this occur.
BTCUSD LONGNach dem Durchbrechen der Zone erwarte ich ein Retest wo ich eine Long Position platzieren werde
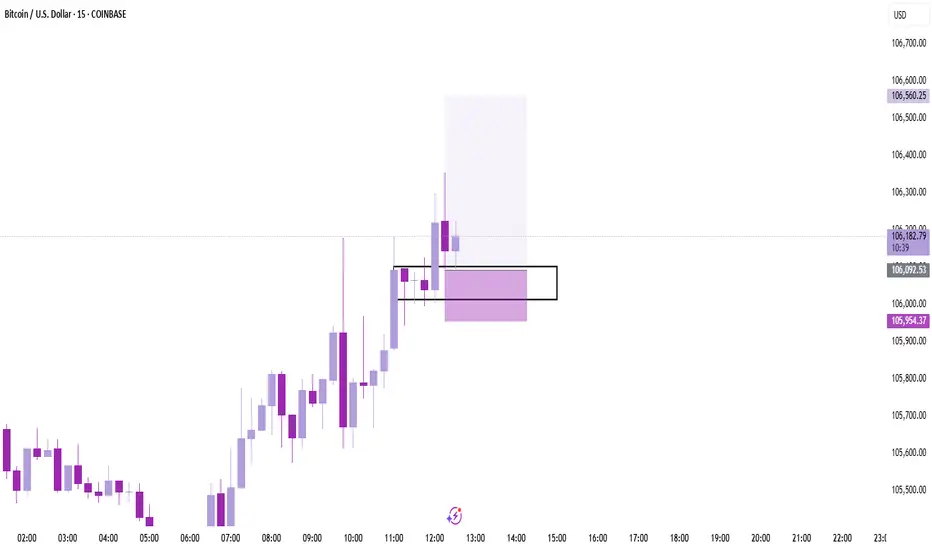
BUY 5 MINUTE DEMAND Let's see how long this demand can hold, it just seems so right!
SETTING MY SL TO BREAK EVEN.
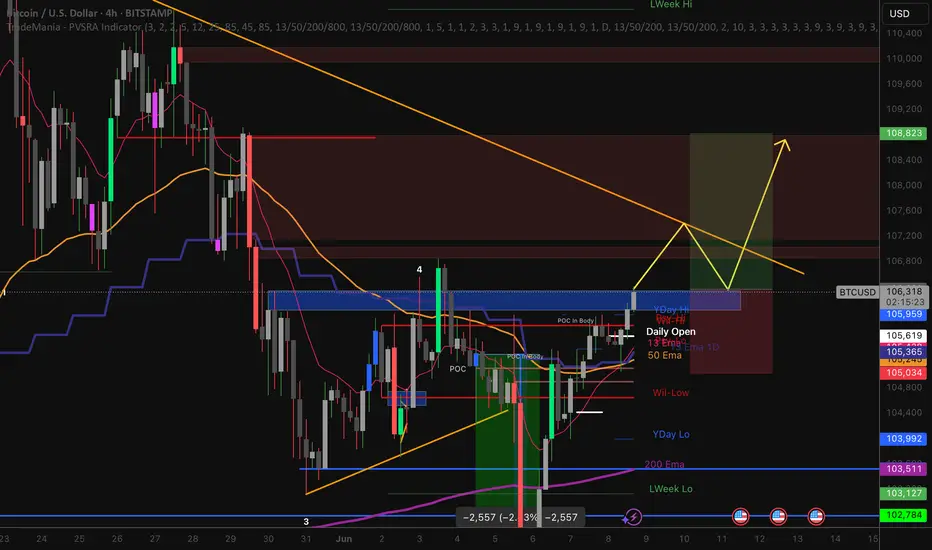
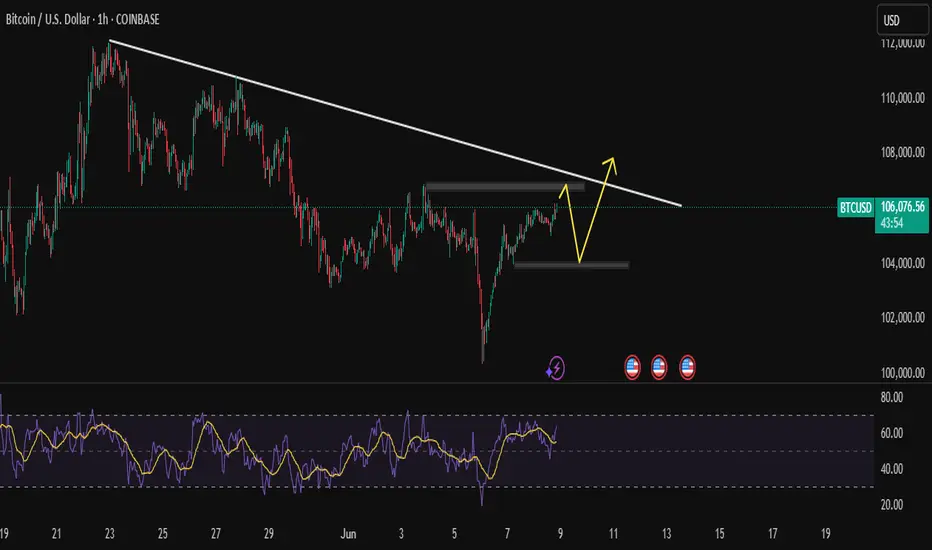
BTCUSDThere are two possible scenarios drawn with yellow arrows:
Bullish Scenario: Price breaks the resistance trendline → continuation upward.
Bearish Scenario: Price rejects at resistance → pulls back to the support zone → then possibly makes another attempt to break out (a higher low setup).
Wait and watch till come for retracement then buy
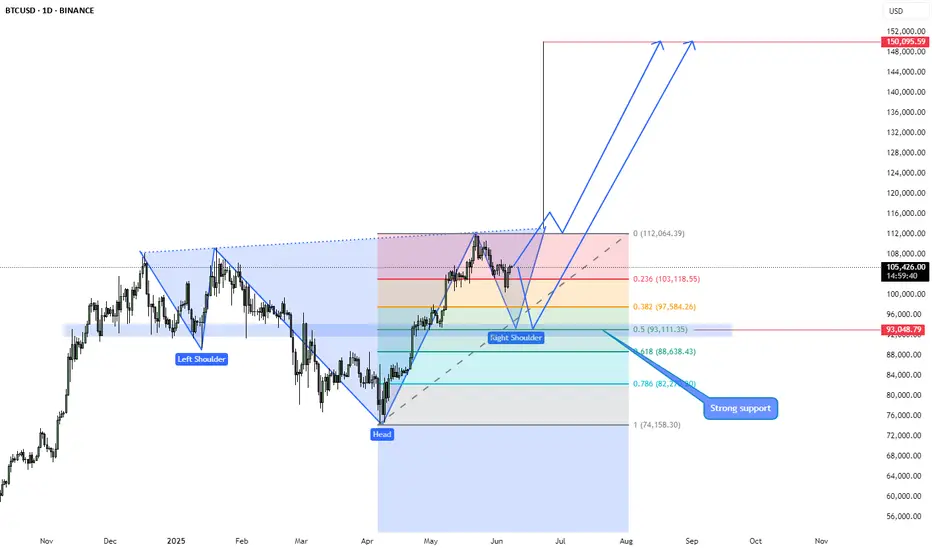
Bitcoin to 120k or 150k next?The last setup on BITSTAMP:BTCUSD played out exactly as predicted. ()
As of today, June 8, 2025, Bitcoin is trading around $105,000 - $106,000 USD.
And it's been retesting the zone for quite a long time and it's time it broke out! It's less likely to reverse now (Still a possibility tho).
Predictions for Bitcoin's future price is wide, as many analysts are quite bullish:
Year-End 2025: Some experts are eyeing $150,000 USD and more by the end of 2025, citing factors like global liquidity expansion and continued institutional interest.
Do you think it's a possibility?

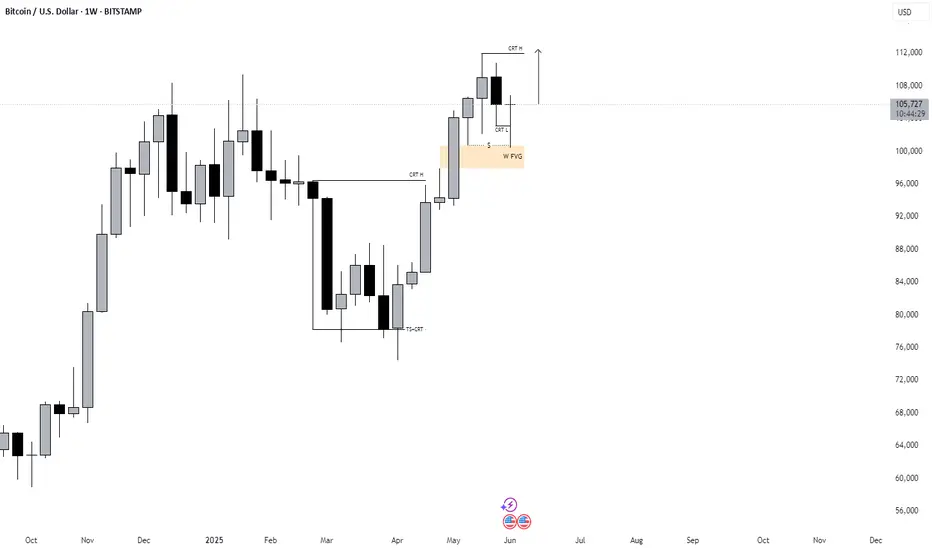
#202523 - priceactiontds - weekly update - bitcoinGood Day and I hope you are well.
comment: 3 legs down, bull flag trend line break but confirmation is only above 106840. It’s still much more bullish than bearish, since bears could not close the gap down to the April high 97915. Market expects a re-test of 110000 or higher and this breakout of the bull flag is as textbook perfect as it gets. Only a daily close below 100000 will change my bias and I will begin to look for lower targets again.
current market cycle: Broad bull channel on the weekly tf. Market is about to re-test the ath and will likely transition into a trading range afterwards or we are already in one.
key levels: 100k - 115k
bull case: Confirmation for the bull flag breakout is 106840, stop has to be 100300. 110000 is expected and you never know in advance if you get a a higher or lower high from double tops/test of the extremes.
Invalidation is a daily close below 100k
bear case: Bears tried 3 times and are likely to give up until we have a credible double top and more signs that the bulls are exhausted and can not push much beyond 110k. Can you sell 106k now and hope for a failed breakout? I don’t think that is a good trade at all. As a bear I would wait.
Invalidation is above 116k
short term: Bullish for 110k, invalidation is below 100k. I don’t expect much above 110k, maybe 115k.
medium-long term - Update from 2025-06-08: Need to see a clear sign that bulls can not push it beyond 112k and once we turn again from closer to the ath, I will comment on bear targets for the next months.
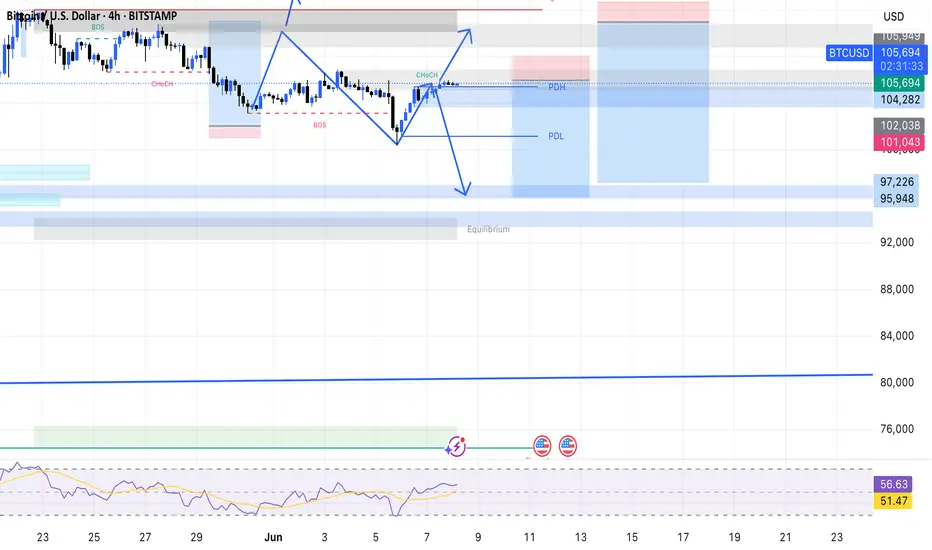
BTC OUTLOOK🔍 Short-Term Outlook (Next Few Days)
Current Price: ~$105,754
Immediate Structure:
BTC just completed a bullish break of structure (BOS) and internal change of character (i-CHoCH) to the upside.
Price rebounded sharply from the demand zone (green AOI) around $101,000–$102,000.
Price is now approaching the 0.786 Fibonacci retracement level (~$106,150) from the recent swing high to swing low, which often acts as resistance.
Short-Term Bias: Bullish → Cautious
✅ Momentum is currently favoring bulls as shown by the breakout above recent structure.
⚠️ Resistance Zone between $106,150–$107,000 could cap this move, especially with past lower highs (LH) and supply visible in that region.
Short-term traders should watch for:
Break above $106,150 → continuation to $108,000–$110,000
Rejection at $106,150 → possible retest of $104,000–$103,000
📈 Long-Term Outlook (1–4 Weeks)
Market Structure:
Still showing signs of a macro lower high (LH) and lower low (LL) structure.
Despite recent bullish push, the macro downtrend from the highs around $112,000–$113,000 remains intact.
Reclaiming above $110,000 would be the first signal of a true trend reversal.
Fibonacci Confluence:
The current swing aligns with 0.618–0.786 retracement, which is often a “golden pocket” for institutional sell zones.
There’s a major supply zone (red AOI) that may keep price suppressed unless there's a breakout with high volume.
Long-Term Bias: Bearish Unless Proven Otherwise
Unless BTC breaks and holds above $110,000, long-term trend remains down.
Likely scenario:
Range-bound between $101,000–$107,000
Break below $101,000 → opens the door to $98,000 or lower
Break above $107,000 and hold → potential reversal towards $112,000

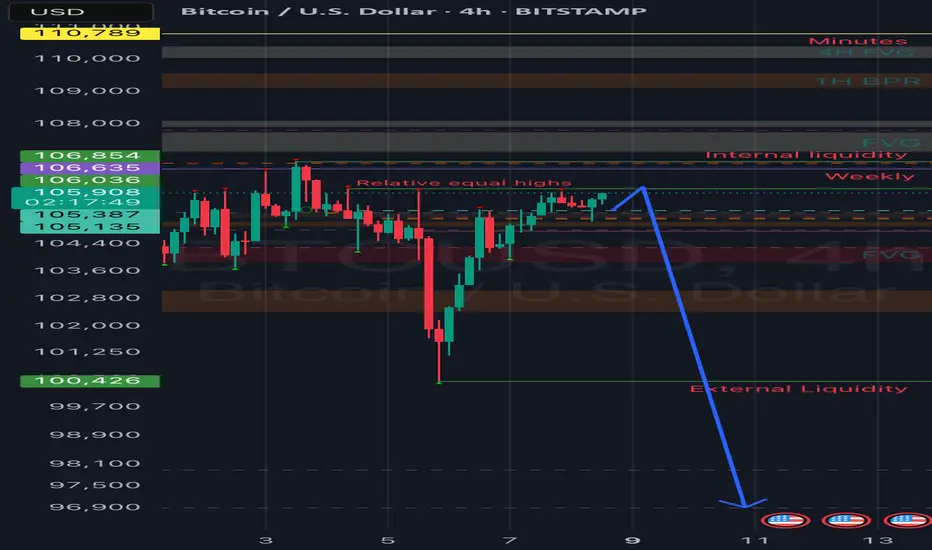
BTCUSD: Weak Market & Bearish Continuation
Remember that we can not, and should not impose our will on the market but rather listen to its whims and make profit by following it. And thus shall be done today on the BTCUSD pair which is likely to be pushed down by the bears so we will sell!
Disclosure: I am part of Trade Nation's Influencer program and receive a monthly fee for using their TradingView charts in my analysis.
❤️ Please, support our work with like & comment! ❤️

2023-2024 BITCOIN RISEBITCOIN RISE journey is about to start.
It is important to note that predicting the future movements of cryptocurrency prices is a highly speculative and uncertain endeavor. There are many factors that can influence the price of Bitcoin and other cryptocurrencies, and it is impossible to accurately predict how these factors will play out in the future.
Having said that, if you are making a prediction that Bitcoin will fall to around $12,000 before rising to around $100,000 in 2023 and early 2024, you are suggesting that the price of Bitcoin will experience significant volatility over the next few years. This could be due to a variety of factors, such as changes in market demand, regulatory developments, or global economic conditions.
It is also worth noting that the price of Bitcoin has already experienced significant volatility in the past, with the value of the cryptocurrency fluctuating by thousands of dollars in a relatively short period of time. This means that there is always the potential for significant price changes in either direction, and it is important to approach any investment in Bitcoin or other cryptocurrencies with caution and an understanding of the risks involved.

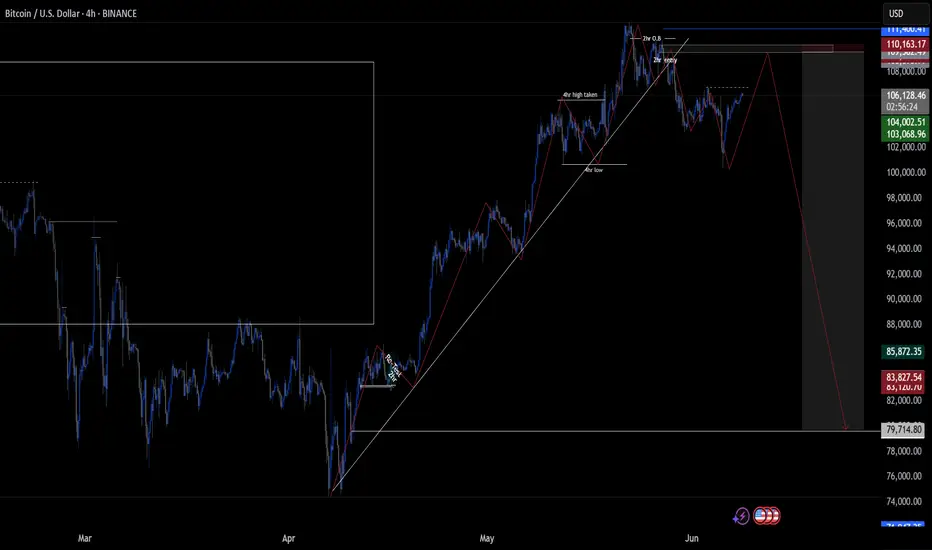
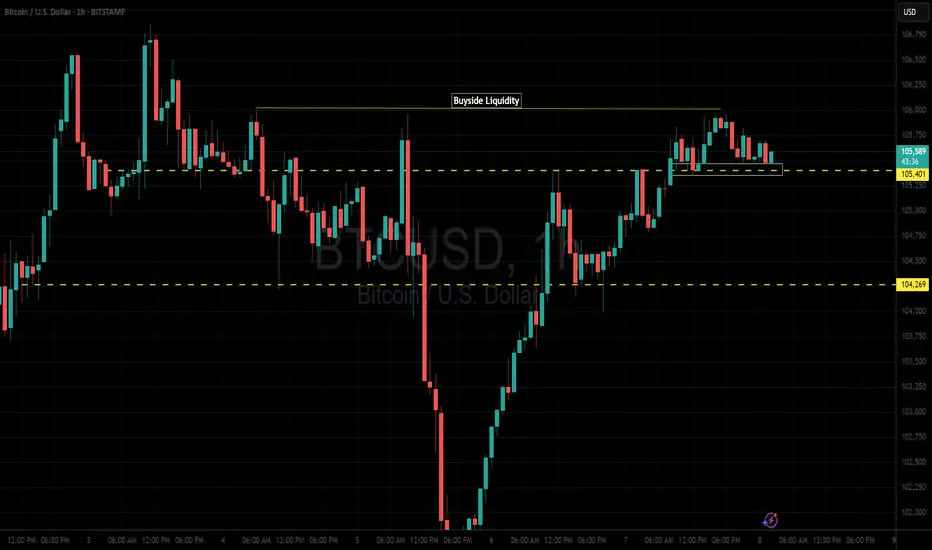
Bitcoin plummets!!Good day traders, I am back with yet another update on BTC/USD. My last update on bitcoin what I was expecting price to do unfortunately did not happen as price was very weak, I had a FVG(SIBI) that I really wanted price to revisit and the two price levels that make up the SIBI are 107752 and 107149.
Now that both our sellside liquidity were taken does that mean price is now gonna look for the buyside liquidity? My honest opinion is I don't think because I said 97k is insight and I believe it can still happen and it will according to my HTF perspective.
On the daily TF we have clear sight of relative highs that we wanna see price take and that might happen today but my short term objective is the high that was booked on Tuesday. That Tuesday's candlestick has a very large wick and from my time learning with ICT's content, wicks contain a lot of price data that can be used either for entries or exits.
4H- Here we had a shift in market structure lower on Thursday but price has been bullish ever since the shift happened. On this respective TF we have equal highs too, and ICT teaches us to always focus our attention on them mainly because price looks for liquidity and imbalances on the 4 hour TF...should we look closely on the left of our screens or chart, there is an order block from the wick I mentioned above. Again what are the rules of an order block?..
FROM TOMORROW PRICE WILL START TO PLUMMET!!
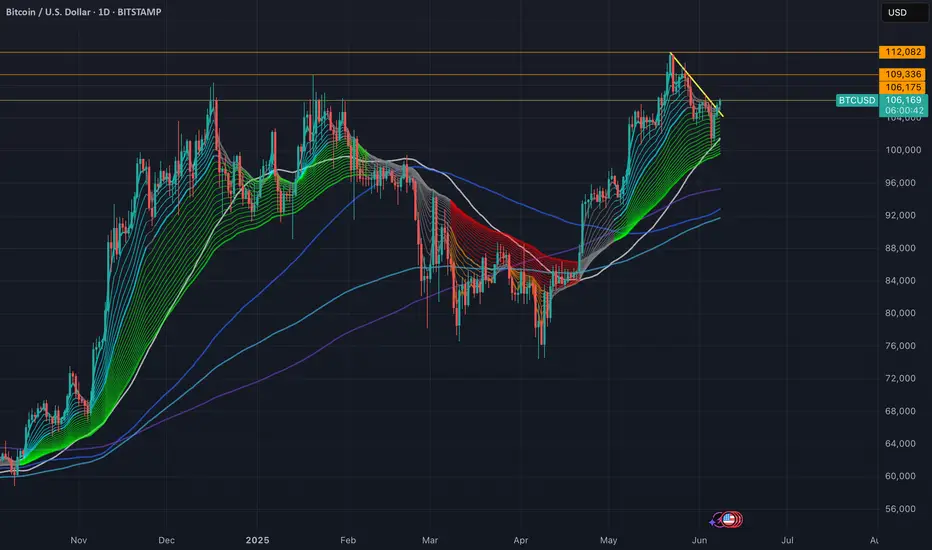
Time to go to the moon againRecent price action as retraced into the weekly level which is now the key level that Bitcoin can bounce off. once the week closes above, the next objective is price will rally and hunt the all time high. Grab your popcorn and lets watch the next move
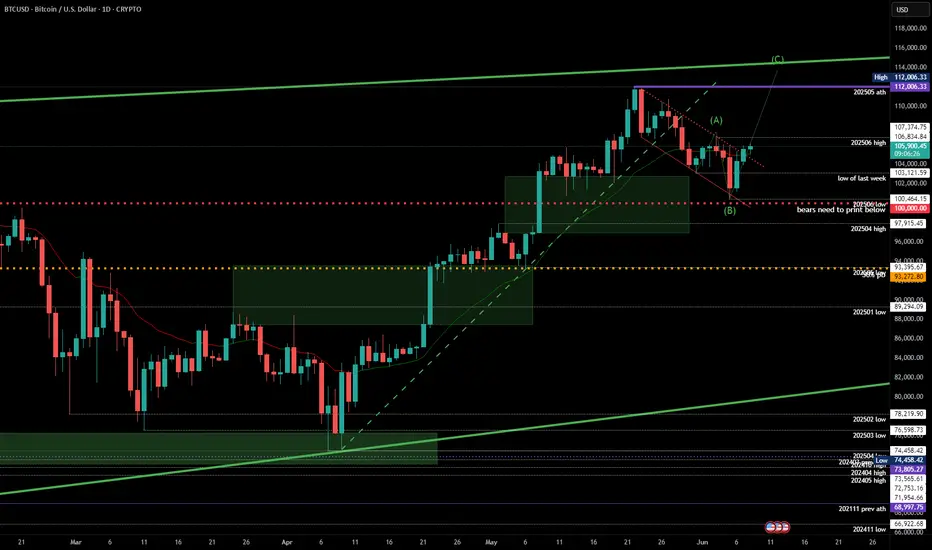
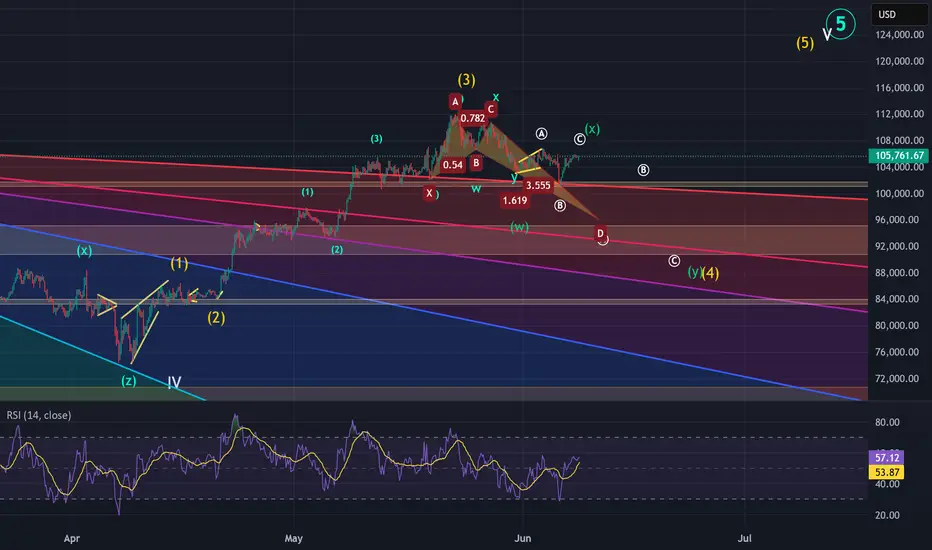
BTC Elliott wave analysis 6/8/2025 In my view, we are currently entering an A-B-C corrective wave, which is part of wave (4) and will complete wave (iv).
The bullish Crab harmonic pattern suggests that wave Ⓐ of (4) should bottom around 95,600–96,000. Following that, the Gann fan indicates that wave Ⓑ could rise to the 100,000–101,000 range, which also aligns with a key resistance zone.
For wave Ⓒ, the Gann fan suggests a downward move to around 94,000–92,000, a zone that corresponds to strong support.
Once wave (4) completes, the market should be positioned to begin wave (5), which will finalize the larger wave ⑤.
A key validation level to watch is 84,000. If the price drops below this level, the count would be invalidated, as wave (4) cannot fall below the low of wave (2).
BITCOIN✅ Trade Points
Parameter Value
Trade Plan BUY
Instrument BITCOIN
Entry-1 73,600
Stop Loss (SL) 66,798
Risk 6,802
Reward 34,922
Target (TP) 108,522
Risk-Reward (RR) 5.1
Last High 109,356
Last Low 74,434
🧠 Commentary
Entry at 73,600 aligns perfectly with the MTF Weekly & Monthly Proximal zone.
Stop Loss at 66,798 sits just below the MTF Distal zone, offering logical risk containment.
Target of 108,522 is slightly conservative vs. the Last High of 109,356, maintaining realism in upside expectations.
Risk-to-Reward ratio of 5.1 is strong — suggesting high reward potential for the risk taken.
📈 BITCOIN | Trade Plan Summary
🔵 MTF Demand Summary
MTF Zone Trend Logic Proximal Distal Average
HTF Yearly UP Support & Resistance 44,729 38,505 41,617
HTF Half-Yearly UP BUFL 73,794 49,577 61,686
HTF Quarterly UP DMIP 70,017 58,867 64,442
HTF Avg UP 62,847 48,983 55,915
MTF Monthly UP BUFL 73,600 66,798 70,199
MTF Weekly UP BUFL 73,600 66,798 70,199
MTF Avg UP 73,600 66,798 70,199
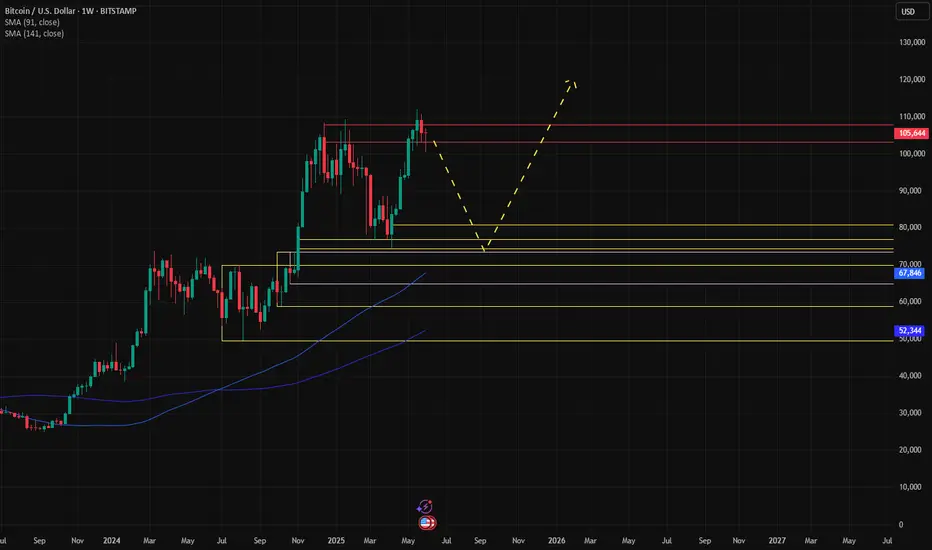
BTC updateWhat will btc do, there are currently two possible scenarios, the first is if we get an interest rate cut in the usa on wednesday 18-11-2025 (and consolidate until then) it could well be that we form a small right shoulder of this pattern. Scenario two is if btc corrects to 93k (which I still consider possible) the head and shoulders pattern will only become stronger and which is also healthier for the market. For now we just have to wait and see, but I will keep you informed. tradingview.sweetlogin.com
BTC RETRACE INCOMING102k on the table, to confirm the trend change 102k will be the deciding factor, and a good place to go long compared to now, a 2% drop could happen, for now the bias is still bearish even though SFP has occurred

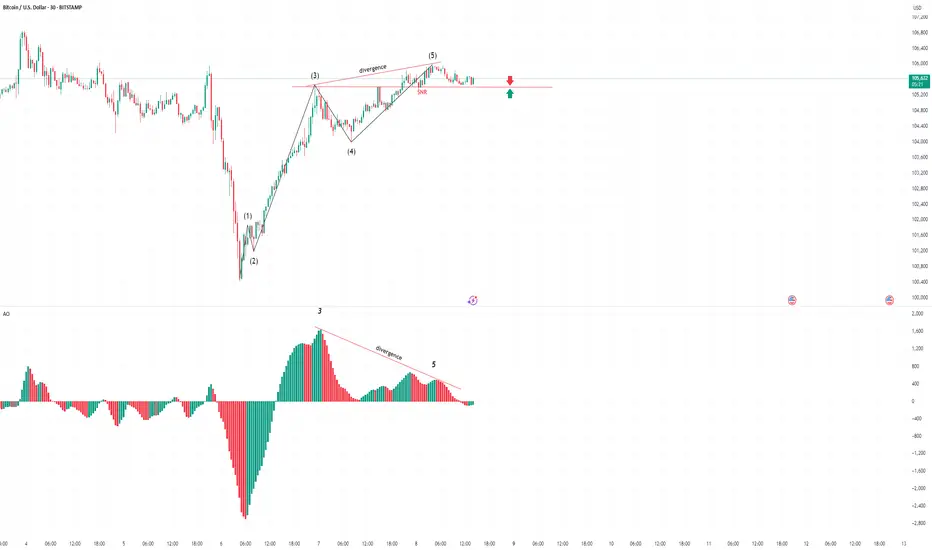
BTC/USD – 5-Wave Structure Completed | Bearish Divergence + Stru🕒 Timeframe: 30min
📅 Date: June 8, 2025
💱 Pair: BTC/USD (BITSTAMP)
📊 Indicator: Awesome Oscillator (AO)
🧠 Technical Analysis Summary:
A classic 5-wave Elliott structure (1–2–3–4–5) has completed. Key observations:
Wave (5) slightly pushes above Wave (3), but momentum weakens.
Bearish divergence is spotted on the Awesome Oscillator (AO) between Wave (3) and Wave (5), signaling exhaustion.
Price is currently holding above a key structure support (SNR) at 105415.
🔻 Sell Setup:
🟥 SNR = Structure level at 105415.
🧨 If price breaks below 105415, I will enter a short (sell) position.
🧠 This level acts as a confluence zone:
End of wave 5
Loss of bullish momentum
Bearish AO divergence
Potential trend shift
📌 Trade Plan:
💥 Action:
➡️ Sell only if price breaks and closes below 105415.
🎯 Potential Targets:
104200 – local structure support
102800 – deeper correction zone (possible wave A)
🛡️ Invalidation:
➡️ If price closes back above recent high (~105800) with renewed AO strength, I’ll reconsider the short.
🧰 Tools Used:
Elliott Wave Theory (1–5 structure)
Awesome Oscillator – Divergence Confirmation
Market Structure (SNR as key support)
💬 Conclusion:
Wave 5 is done. Momentum has faded. All eyes on the structure level at 105415.
➡️ Break = Sell.
If it holds, no trade.
📌 Stay patient. Let the market come to you.
🔔 Like & follow if you enjoy clean Elliott Wave and momentum divergence setups.
Got your own wave count? Drop it below! 👇
#BTCUSD #Bitcoin #ElliottWave #BearishDivergence #AO #CryptoTrading #StructureBreak #PriceAction #Wave5Complete
BTC 1H levelsBitcoin is holding at the fvg for now but I would like to see it retrace to the previous level before going back up. A move to the upside might just be a liquidity grab.
The 3 Step Rocket Booster Strategy:Bitcoin Bull MarketThis is the best time to buy bitcoin.
Yesterday i slept the whole day.Because
this was my goal yeserday to sleep the whole day.
Rest is very important.Even in the market
its okay to stand on the side lines.
Dont feel bad for standing on the sidelines.
This is a good way to wait for the best opportunities
in the market.
Bitcoin COINBASE:BTCUSD has activated the
3 Step Rocket Booster Strategy.
So What is the 3 Step Rocket Booster Strategy?
Step#1-The price has to be above the 50 EMA
Step#2-The price has to be above the 200 EMA
Step#3-The price has to gap up
Its really that simple.If you want a video demonstration
Rocket boost this content to learn more.
Disclaimer:Trading is risky please learn risk management
and profit taking strategies.Also feel free to
use a simulation trading account before you trade with
real money and do not use Margin.

BTC IDEALooks like markets wants to hit the first supply zone before falling we have a change o character to the buyside we will wait to see if the second supply will be cleared
Follow for daily updates on the markets