The magic fractal wave of BTCWell it is very interesting pulsation of BTC. ATH > Crash > New ath > Biger crash > recovery > Old ath > crash
I have pretty accurately predicted this cycle. I think we will see 150K this year and then crash to 77K in 2026 and then climb up to 0.5 Mil.
Tell me what you see.
BTCUSD.PI trade ideas

BITCOIN - HTF.HTF analysis on Bitcoin:
Anyone with eyes can read the Monthly structure and bias as being bullish, April swept the prev ATH at 108K, tapping the 111K levels, before selling off sharply (to be expected, price must come down, to go up, after all!). - Monthly context shows we need to do just that, and this week, we did!
I had the target as the Weekly Bullish FVG residing at 100K, and expected the reaction we have seen, however, now is where it gets interesting - as we can see on the Daily (TF of the chart in this example), we can see that price ran a daily ITL as well as 4H liquidity levels, on its way into the W FVG (happened on Thurs, not Fri, which was interesting considering the RFN on friday), and has since shown bullish displacement back to the upside.
Current Daily targets are 105-108K levels, if Bulls can recapture this area, we can expect some form of consolidation before another leg up. The ETF's (in my opinion) were the institutions and their 'Trojan Horse's' - so the higher we go, the more we can expect sell offs in the form of profit taking via institutional profit taking.
Conclusion - BULLISH BIAS, WITH THE HTF TARGETS BEING DAILY HIGHS, AND THE OVERALL MONTHLY TARGET OF A NEW ATH - 125K is the next logical HTF target based off a trend-based Fib extension.

BTCUSD: Bearish Signal from Mother Candle on Daily ChartMother Candle - A big candle that engulfs the subsequent candles.
The Mother Candle formed on Dec 5th on a Daily Chart still holds good, with a Bear Counter Attack and a Fake Break Down. With the Rising Wedge to get to the Mother Candle, there is a very high probability that this could be a bearish reversal.
If there is a Break Down on the Mother Candle, there are known support levels from GETTEX:92K to $85K. The price could dip down to one of these levels.
Let's see.

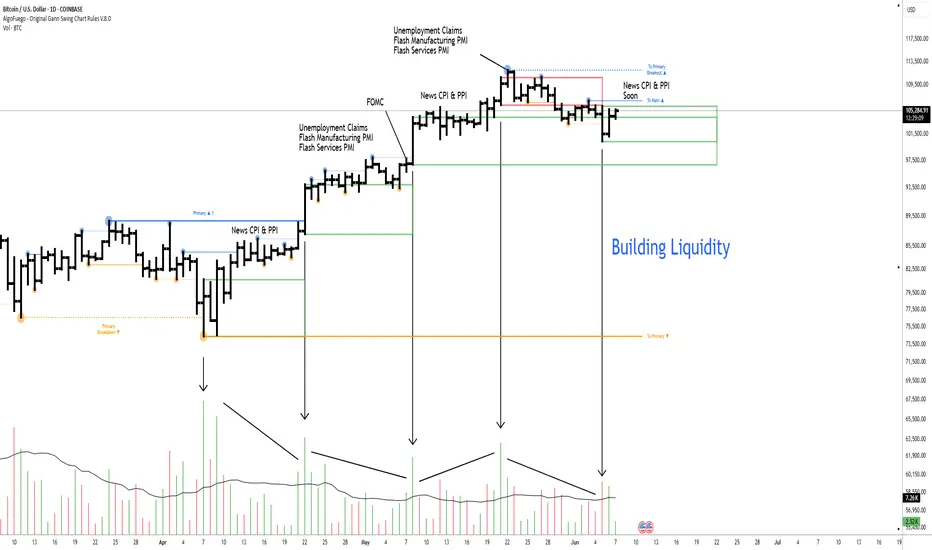
Building Liquidity: What It Really Means🔵 Building Liquidity: What it really means
Professional traders often need liquidity (buyers and sellers) to enter/exit large positions without moving the market too much.
This means manipulating the market within a pre-determined range, which serves as the operating center for everything that follows.
🔹 How is liquidity built
Price Ranging: Sideways consolidation before big moves attracts both buyers and sellers.
False Breakouts (Stop hunts): Price may briefly break support/resistance to trigger retail stop-losses and fill institutional orders.
News Timing: Pro traders often execute during or just before major news when volatility brings liquidity.
🔹 How can you spot a Liquidity-building zone
🔸 Volume
Unusual spikes in volume: Often indicate institutional activity.
Volume clusters at ranges or breakouts: Suggest accumulation/distribution zones.
Volume with price divergence: Price rises but volume falls = possible exhaustion. Volume rises and price consolidates = potential accumulation.
🔸 Price Action
Order Blocks / Imbalance zones: Sharp moves followed by consolidations are often pro trader footprints.
Break of Structure (BoS): Institutions often reverse trends by breaking previous highs/lows.
Liquidity sweeps: Price moves aggressively above resistance or below support then reverses = stop-loss hunting.
🔸 News Reaction
Watch pre-news volume spikes.
Look for contrarian moves after news — when price moves opposite to expected direction, it often reveals smart money traps.
Analyze price stability post-news — slow movement shows absorption by pros.
Wick traps and reversals around news events = stop hunting.
🔸 Narrative is Everything
Higher timeframe trends show intent.
Lower timeframes show execution zones.
Look for alignment between timeframes in a specific direction.
🔹 Why do whales move the market in an orderly manner
To fill large positions at optimal prices.
To create liquidity where there is none.
To trap retail on the wrong side of the move.
To trap other whales on the wrong side of this move.
To rebalance portfolios around economic cycles/news.
🔹 Professionals never forget what they've built
When you track price, volume, and news, you’ll find specific bars that form areas that are the foundation for the short-term direction.
This is pure VPA/VSA logic, the interplay of Price Analysis ,Volume Analysis and News, where each bar is not just a bar , but a clue in the story that professionals are writing.
When you monitor volume, price, and news together and perform multi-timeframe analysis, it becomes clear what the whales are doing, and why.
🔹 From the chart above
The market reached a weekly resistance level and then pulled back slightly after whales triggered the stop-losses of breakout traders.
Prior to the breakout, whales had accumulated positions by creating a series of liquidity-rich buying zones on the daily timeframe.
It's essential to understand the broader context before choosing to participate alongside them—whether you're planning to buy or sell.
🔴 Tips
Use volume and price analysis together, not separately.
Monitor any unusual volume bars before economic market news.
Monitor news and volatility spikes to detect traps and entries.
Combine this with liquidity zones (support/resistance clusters).
Build a "narrative" per week: What is smart money trying to do?
A smart trader understands the tactics whales use, and knows how to navigate around them.
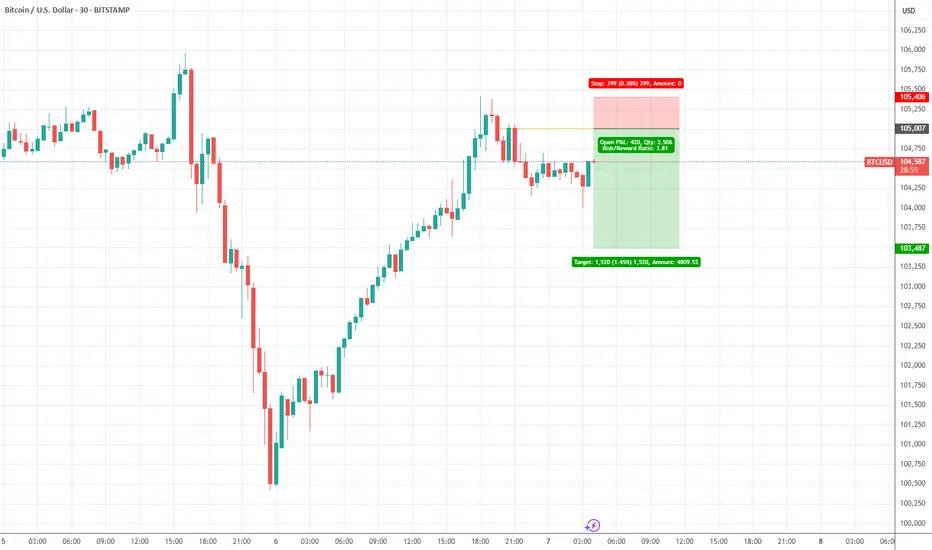
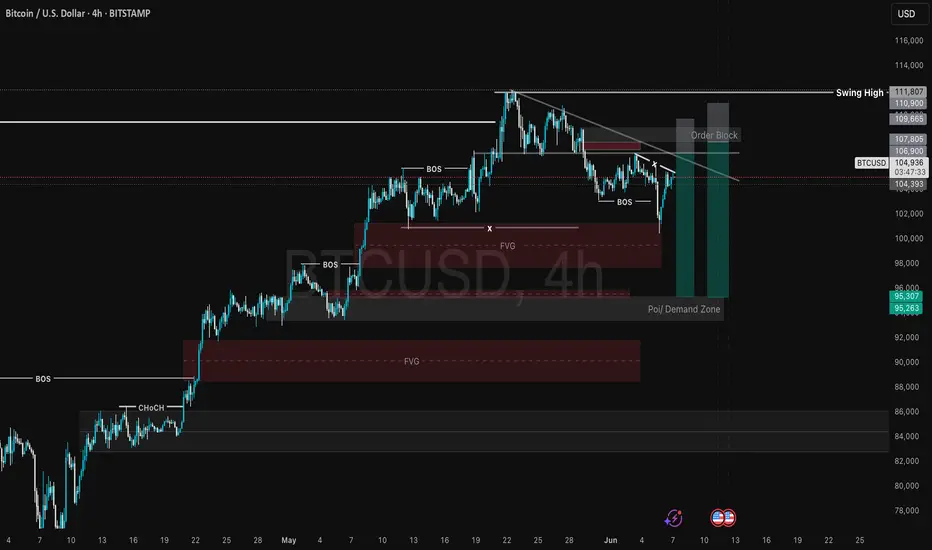
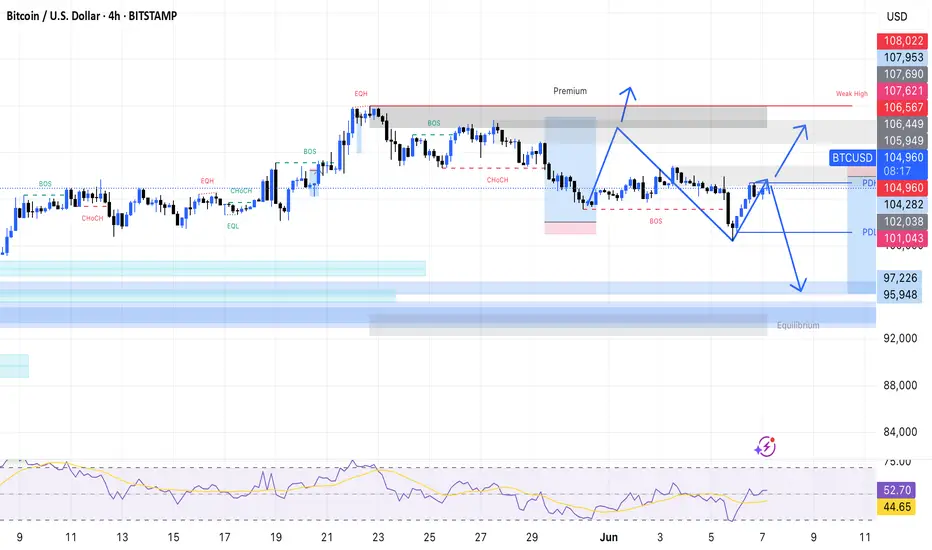
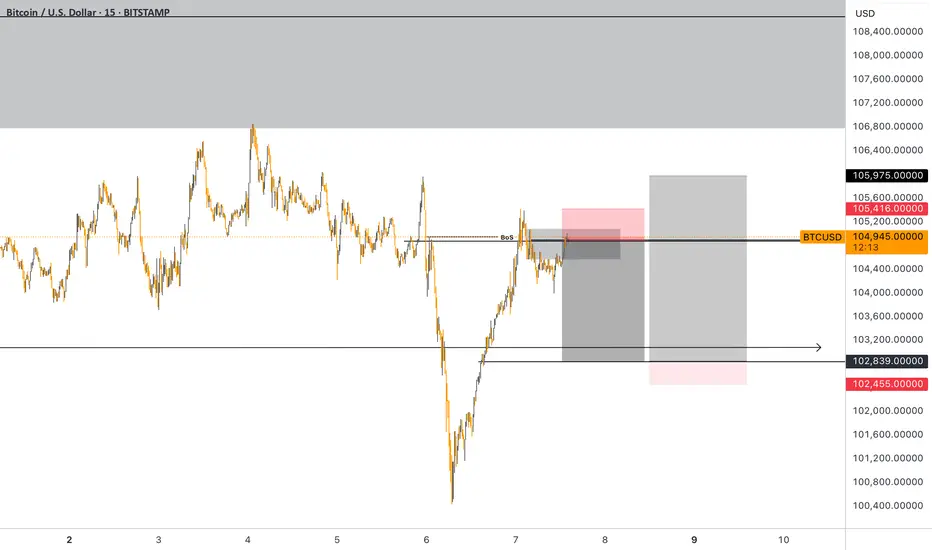
BTC/USD Trade Setup - June 7, 2025I'm looking at a potential bullish breakout trade on Bitcoin. Here's the breakdown of my idea:
📊 Context & Structure
Price has broken out of a consolidation zone after reclaiming a prior high-volume node (visible from the Volume Profile on the left).
We see a clear ascending triangle forming, suggesting bullish continuation.
Volume profile shows strong support below current price, with acceptance building at the current level.
📈 Entry & Risk Management
✅ Entry: $104,952 (just above triangle resistance).
❌ Stop Loss: Below the higher low structure and volume gap at $104,401.
🎯 Target: $106,854 — previous high/POI area, aligning with upper resistance on the profile.
📐 Risk-Reward Ratio
RRR: ~3:1, offering a strong reward relative to risk.
📌 Additional Notes:
Waiting for a breakout confirmation candle before full entry.
Strong rejection below $104,700 would invalidate the setup.
This post conveys a clear technical story and shows your reasoning using price action, market structure, and volume profile. Let me know if you'd like a more concise or visual version!

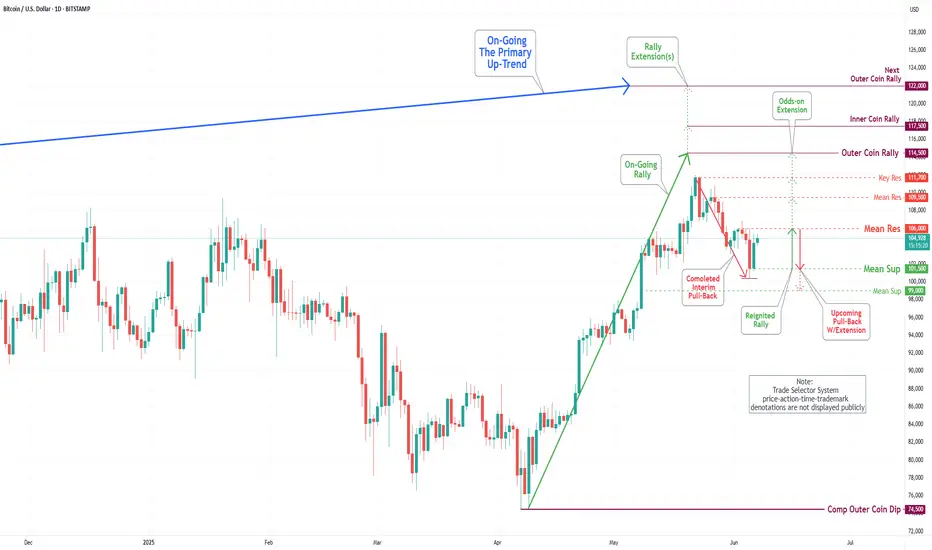
Bitcoin(BTC/USD) Daily Chart Analysis For Week of June 6, 2025Technical Analysis and Outlook:
Bitcoin has experienced a notable downturn throughout the week; however, on Friday, it made a substantial upward movement, effectively recovering all previous losses. It is currently positioned to establish a temporary pause at the Mean Resistance level of $106,000, which may facilitate the development of upward momentum from this point. This situation may pose challenges to achieving the Inner Coin Rally target of $ 114,500, which is contingent upon the Mean Resistance at $ 109,500 and Key Resistance at $ 111,700. It is essential to acknowledge the possibility of a downward pullback from the Mean Resistance level of $106,000, which could result in a decline toward the Mean Support level of $101500.
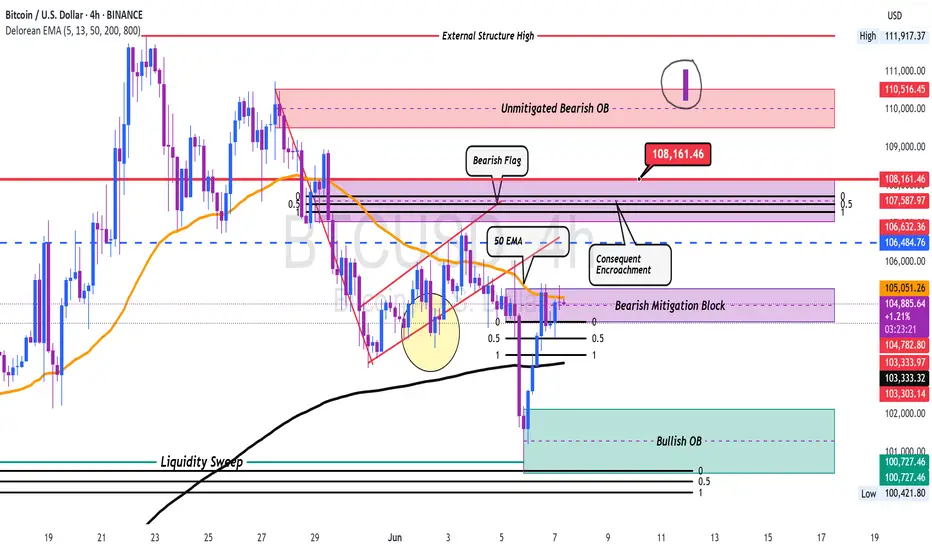
BTC STILL BEARISHI am bearish on BTC until a strong bodily close above the bearish OB to confirm Bullish and possibly a new High
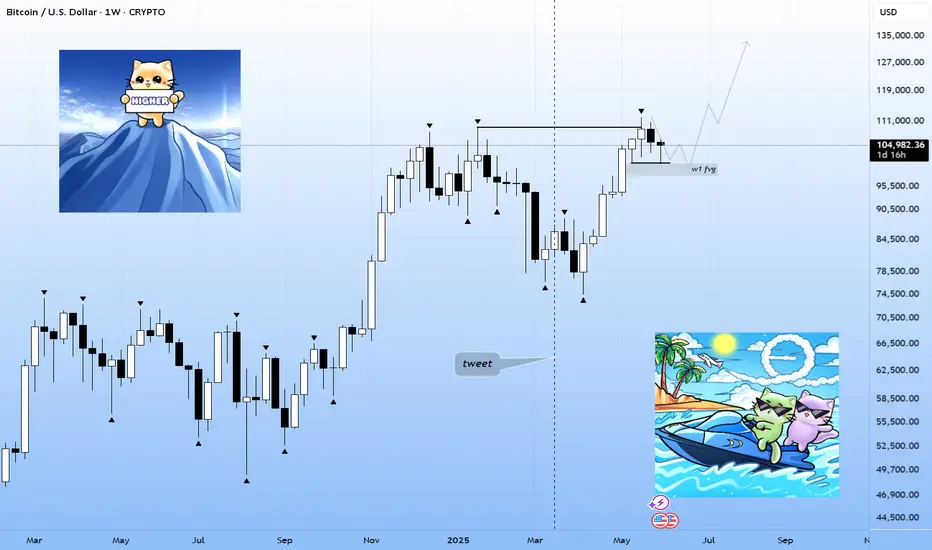
BTC re-accumulation and >140k$The year started from manipulation on CRYPTOCAP:BTC and the whole crypto market after Trump's tariff announcement.
Since the start of the summer season, we've already seen another manipulation between Trump and Elon Musk.
On BTC I see weekly FVG and good pinbar candle. I guess we have already entered to consolidaton and summer will also consolidation, but starting from august we will see the final uptrend with euphoria which can finish on October nearly 241.000$ on BTC, but let's see it later
I think this period will be light with base summer and $MOCHI because it's a memecoin which holds the bottom well , when in that time another altcoins are making another bottom
THE BITCOIN BIG CORRECTION IS COMINGBITSTAMP:BTCUSD ,just made a new ATH some few days ago, some people made money some loss money but that's trading you loss and you again.
Let's see what BITSTAMP:BTCUSD has for us this month June. looking at the price action of Btc, we can see that Bitcoin is trading at premium which means we need to see some corrections to the downside targeting the 95k level before any continuations to the up side.But as for the moment lets see Bitcoin make that correction before taking any buy positions.
#Bitcoincorrection
#2025BullRun
Follow me for more updates.
NOTE: This is not a financial advice , do your own research.
BTC idea Price couldnt retrace to the first broke structure and retrace if it doesnt respect the supply zone we should see it hit the first supply created or keep moving down
Follow for more daily trades
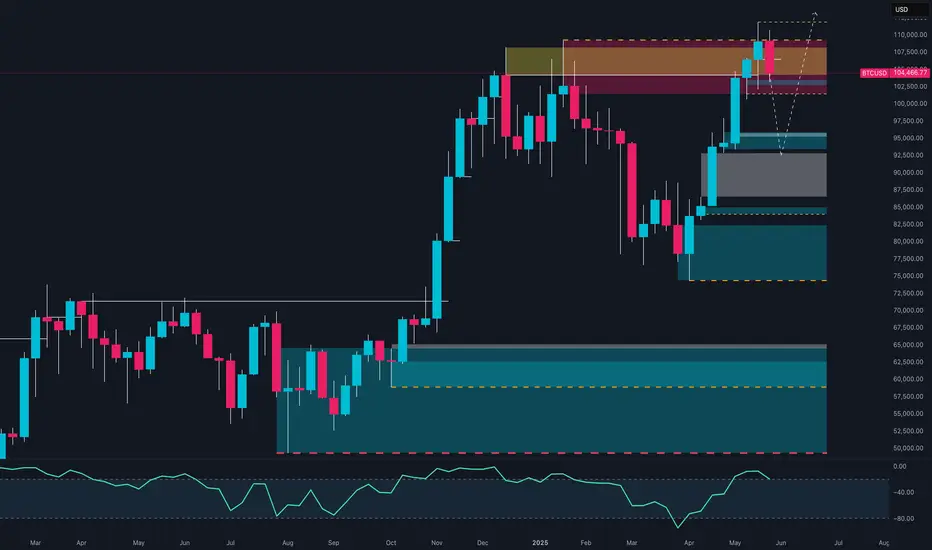
Bitcoin at a Crossroads: 110k RejectionAfter the powerful rally that began in the last quarter of 2024, Bitcoin is now at a critical market juncture. The price has once again reached the 106,000–110,000 USD zone, an area that already showed strong signs of distribution back in February and March 2025. This isn’t just a typical resistance level—it’s a psychologically loaded zone, marked by previous highs and repeated selling pressure.
In May, the monthly candle revealed a clear rejection from this zone: a prominent upper wick and a bearish body, signaling the bulls' struggle to sustain new highs. This behavior suggests the beginning of a profit-taking phase or, more likely, a medium-term consolidation.
The picture becomes even more complex when we look at the COT Report dated May 27, 2025. Non-commercial institutional traders—speculative funds, hedge funds, and portfolio managers—have significantly increased their short positions, now exceeding 26,800 contracts. Meanwhile, long positions are hovering around 24,500, resulting in a net bearish exposure. The message is clear: smart money isn’t buying the breakout—it's selling into it.
Seasonality analysis reinforces this narrative. Historically, June tends to be a weak month for Bitcoin, often followed by renewed strength in the next quarter. The 2025 seasonal curve has mirrored the bullish pattern of 2021 up to May, but now—consistent with historical patterns—is showing signs of slowing. This supports the idea that the market might need a breather before potentially rallying again in Q3.
From a technical standpoint, the key levels are well defined. The 95,000–97,000 USD area is the first dynamic support zone, where the price might find short-term relief. However, the more significant support lies between 82,000 and 85,000 USD—this is the origin of the current rally and aligns with the old breakout structure. A return to this level would represent a healthy and natural correction within a still structurally bullish long-term context.
In summary, the current outlook calls for caution. Momentum is fading, seasonality is unfavorable, and institutional players are trimming long exposure while adding to shorts. Until the price can consolidate above 110,500 USD, the dominant scenario remains a corrective pullback, with interim targets at 95k and potential drops toward the 85k zone.
However, if the market surprises with a strong weekly close above the highs, it could pave the way for a new leg up toward the 125,000–135,000 USD range—potentially fueled by macro catalysts such as ETF inflows, Fed narratives, or broader adoption.
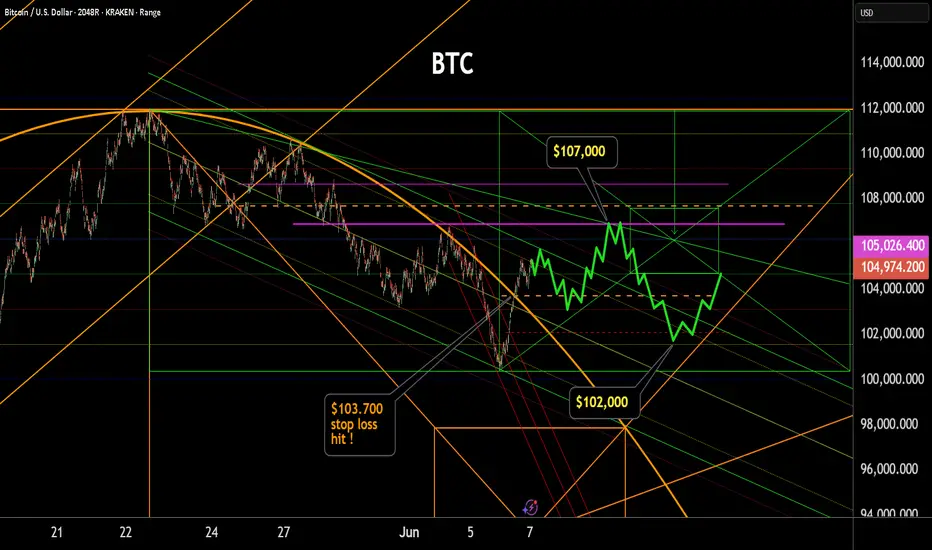
BTC UPDATE - SIDEWAYS ACTION BTC had an impressive rally today that broke key resistance and changed the wave form to the short term trend back to up. From this elevated price level, the uptrend will not produce any significant gains from here tho. To capture this mini trend requires to be patient and buy on dips. Back to near $103,500 - $102,000 as seen in the chart could produce a few swings. However, when these swings are over, I currently still have the medium term trend as down. With $84k target. That could get update, but for now we do not have that data. I see all up movement capped at around $107,000. Prices above $107,000 have me moving back to the immediate $132,000 price target. But again, we are not there yet. Good luck.
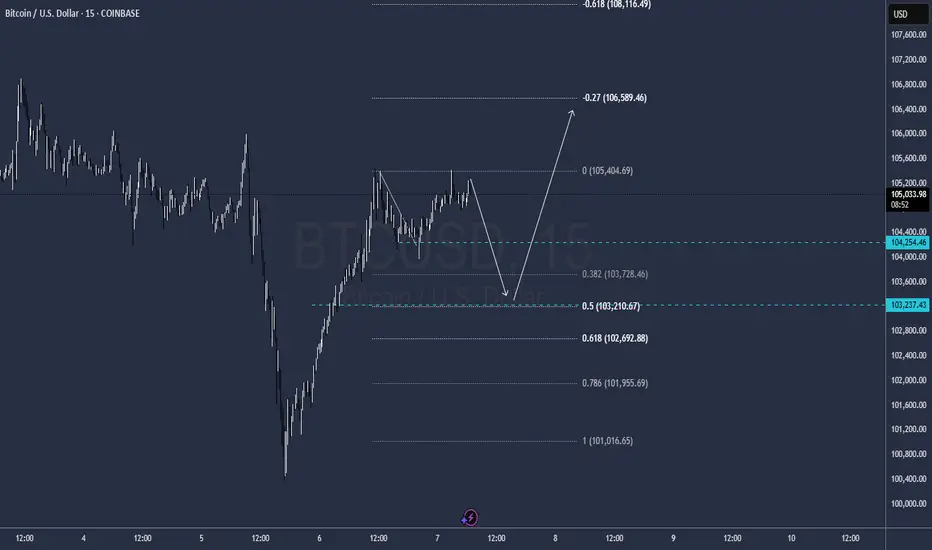
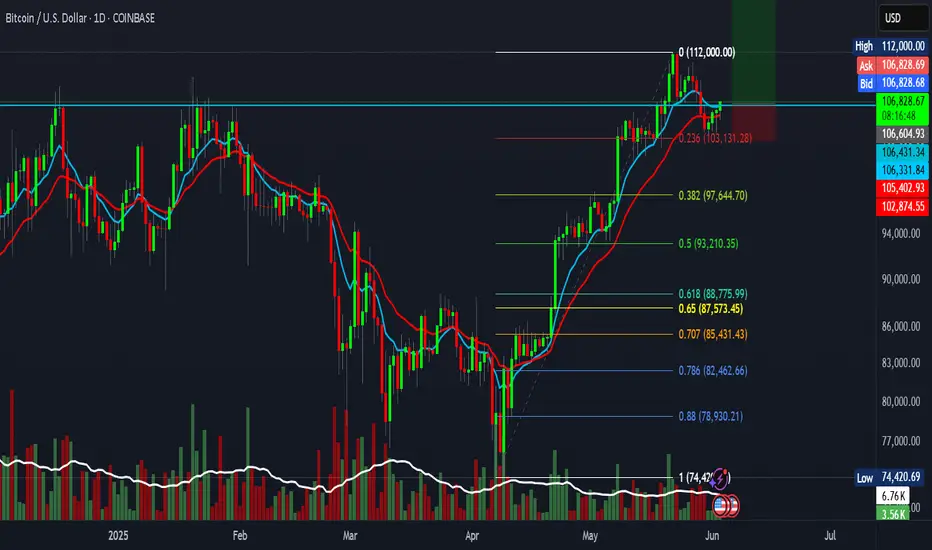
Is Bitcoin Ready to Explode? This setup with 10 R:RIs BTC Ready for the Next Uptrend After a Small Pullback to the 0.236 Fib Level (~103K)?
A potential 10:1 risk-to-reward setup is forming. BTC has already printed a higher low (HL) on the weekly chart and is currently trading above both the weekly and monthly opens — a strong sign of bullish momentum.
Setup Details:
Entry: 106670
Stop Loss: 103000
Target: 144000
Risk-to-Reward: 10:1
This setup is shared for educational purposes only. Always do your own research and manage risk accordingly.
BTCUSD 6/7/2025Come Tap into the mind of SnipeGoat, as he gives you a phenomenal Market Breakdown & an update to his 6/2/2025 Call-out as Price did exactly what he said Price was about to do AGAIN!!!! This is a repeated offender of anticipating Bitcoins Price Action with Precise Levels, Proper Timing, & Perfect Direction!
_SnipeGoat_
_TheeCandleReadingGURU_
#PriceAction #MarketStructure #TechnicalAnalysis #Bearish #Bullish #Bitcoin #Crypto #BTCUSD #Forex #NakedChartReader #ZEROindicators #PreciseLevels #ProperTiming #PerfectDirection #ScalpingTrader #IntradayTrader #DayTrader #SwingTrader #PositionalTrader #HighLevelTrader #MambaMentality #GodMode #UltraInstinct #TheeBibleStrategy

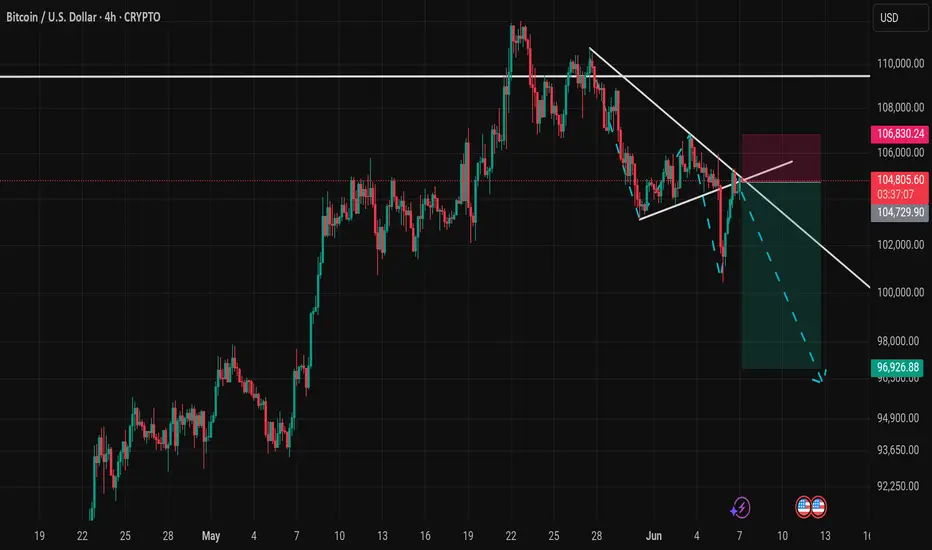
SellAfter new highs and failure to close above previous on monthly timeframe we have a pullback and 96500 is valid price magnet. We try trading on the resistance line for sells unless its broken. If so a buy structure formation will confirm our buys
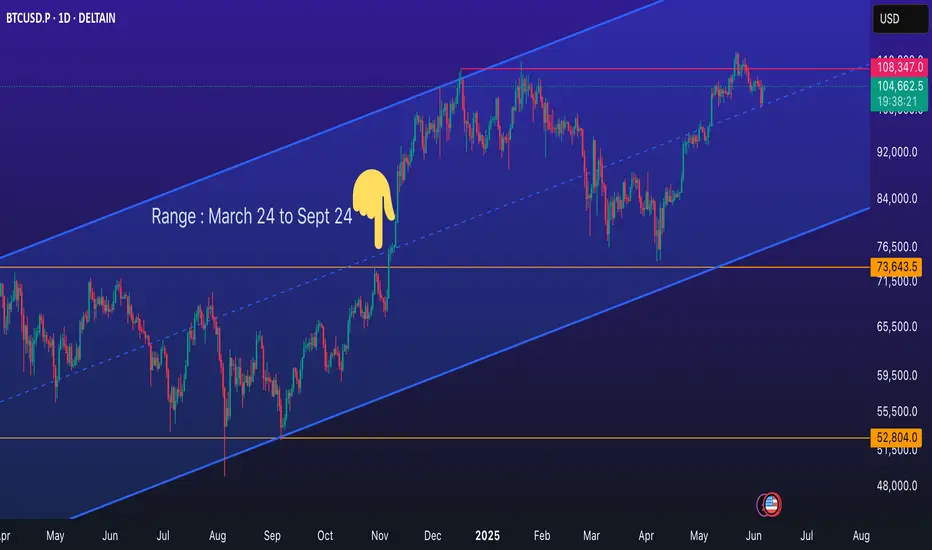
BTCUSD analysis📈 Bitcoin Chart Watch: A Game of Levels!
From March 24 to September 24, Bitcoin played the patience game—consolidating in a tight range. But on September 24, the bulls charged, breaking out and pushing BTC to a high of USD 108,300 by December 24.
However, since then, it’s faced some resistance. Two breakout attempts in January 2025 and May 2025 fizzled out, indicating a strong supply zone up top.
Currently, BTC is hovering around mid-channel support—a crucial zone where the next breakout (up or down) could offer a high-probability trading opportunity.
🎯 Keep an eye on this level. Whichever way it cracks, the move could be swift and decisive.
#Bitcoin #CryptoTrading #BTCBreakout #TradingOpportunity #MarketWatch #SaptharishiAlgo
BTCUSD SELLSBTCUSD – Clean Sell Setup (AUTH Liquidity-Based)
BTCUSD is approaching a high-probability short zone after a strong retracement into overhead liquidity. Based on AUTH (Areas of Liquidity Trading), this setup identifies key zones where liquidity is likely to be collected before a potential drop.
Setup Breakdown:
FTA – First Trouble Area:
A nearby reaction zone just below current price. This may cause a temporary bounce or slowdown in the bearish move but is not the main target.
Inversion Point:
A previously significant support level that has been broken and now acts as resistance. This level may trap late buyers and provide fuel for continuation lower.
VAL – Value Area Low:
The lower edge of a past consolidation range. Price often gravitates here during rebalancing moves and it acts as a realistic profit target.
AUTH Liquidity Zones:
• Above price: Resting buy stops above recent highs and engineered wicks — a common area for stop-hunt reversals.
• Below price: Clean equal lows, unfilled imbalances, and trendline supports — ideal targets for institutional-level downside expansion.
Trade Plan:
Wait for upper liquidity to be swept and monitor for lower timeframe confirmation (e.g. bearish engulfing, break of structure) before entering. Focus is on entering after liquidity is triggered — not before.
🔔 Follow me for a free intro class to my AUTH Masterpiece Liquidity System — designed to help traders read market intention through liquidity flow, not indicators.
Disclaimer: This is not financial advice. The content is for educational purposes only. Always do your own analysis and manage risk carefully.
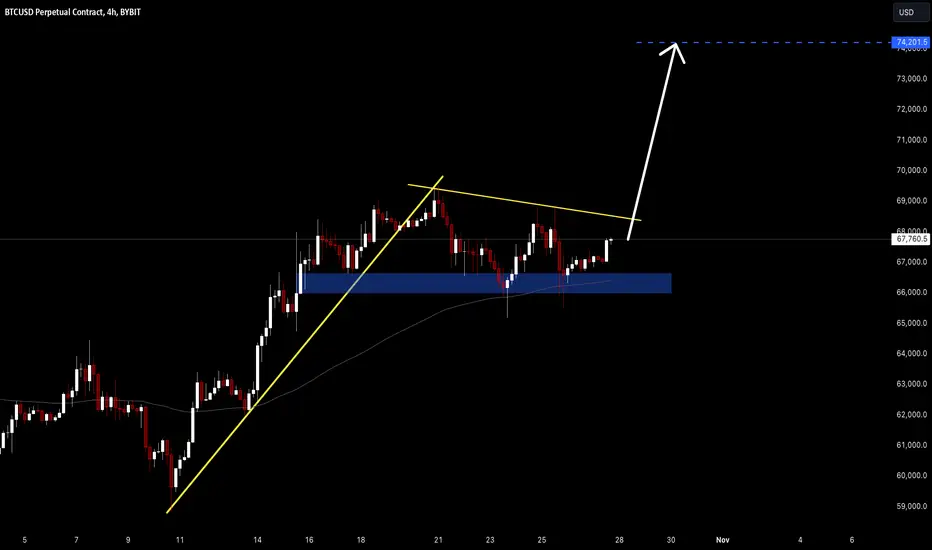
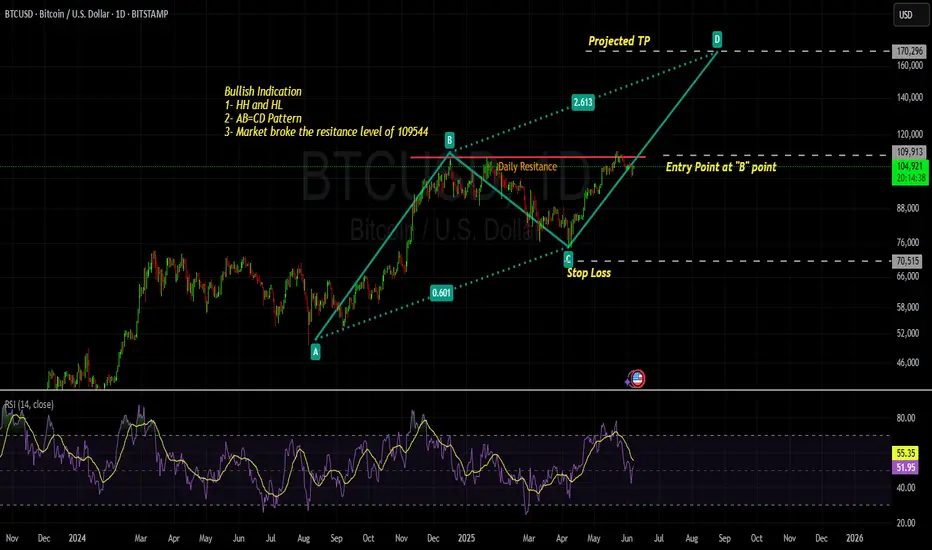
BITCOIN - Bullish Ahead !!!!Bitcoin is in bullish trend making series of HH and HL, Market is making perfect AB=CD pattern and therefore we can project our TP at "D" point which could be a potential reversal zone.
Entry at Breakout of "B" and SL below HL.
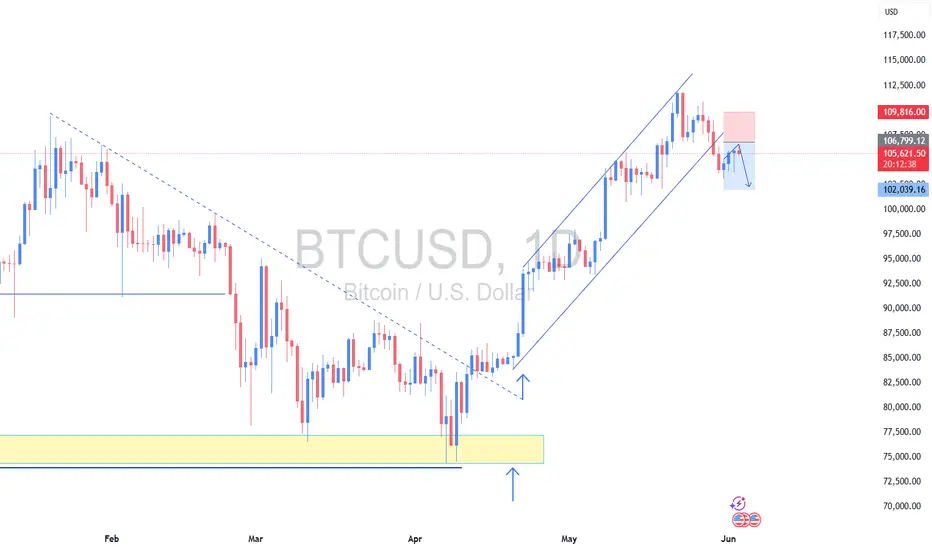
BTC (D1) : Sell Now📉Technical Analysis :
- After BTC has got a strong uptrend on D1 timeframe, price was broken trend. W1 confirm by a reversal candlestick.
- Now, price is re-testing breakout zone. So I recommend that you can sell at 106k-107k
🔑 Remember : Key to success is Capital Management.
🔰 Follow Me To Learn Trading, Please !
Bitcoin Getting Ready To Continue Higher.Alright ladies and gentlemen once this 1hr TIME Cycle retrace is completed Bitcoin will continue higher . The 1hr bearish TIME Cycle will end tonight so because we expect a drop to at least the $102565 mark most likely it will take place overnight (L. A. time) and by tomorrow afternoon the 4hrs Bullish TIME Cycle will continue its move to test the $107000 line . If everything goes well as planned then from then on we will start seeing higher highs and higher lows for as long the Daily TIME Cycle remains in bullish mode.
Grab your popcorns and buckle up and enjoy the ride.

BTCUSD Resell Level For Lower LowLooking at more seller pushing down for past few days, I am still looking for sell possiblity for lower low up to 99.5k price actually.