BTCUSD.PI trade ideas

BTCUSDT - at CUT n REVERSE AREA ? Holds or not??#BTCUSDT.. market just reached near to his ultimate aea that is around 104300
keep close that area because should holds above that if there is further buying scnerios.
otherwise below that not at all.
good luck
trade wisely
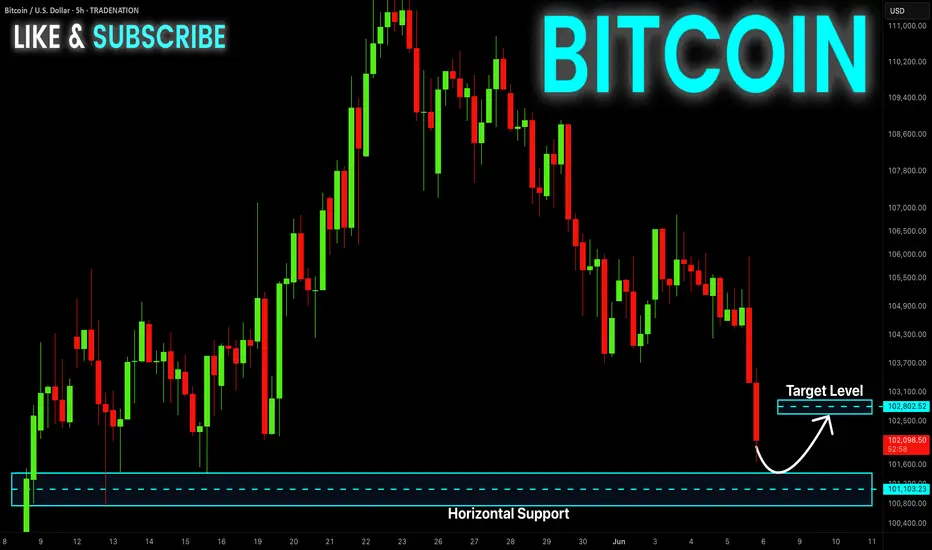
BITCOIN Risky Long! Buy!
Hello,Traders!
BITCOIN keeps falling down
And the coin is almost 9%
Down from the recent highs
So BTC is oversold and
After it hits a horizontal
Support of 100,800$
We will be expecting a
Local rebound and a move up
Buy!
Comment and subscribe to help us grow!
Check out other forecasts below too!
Disclosure: I am part of Trade Nation's Influencer program and receive a monthly fee for using their TradingView charts in my analysis.
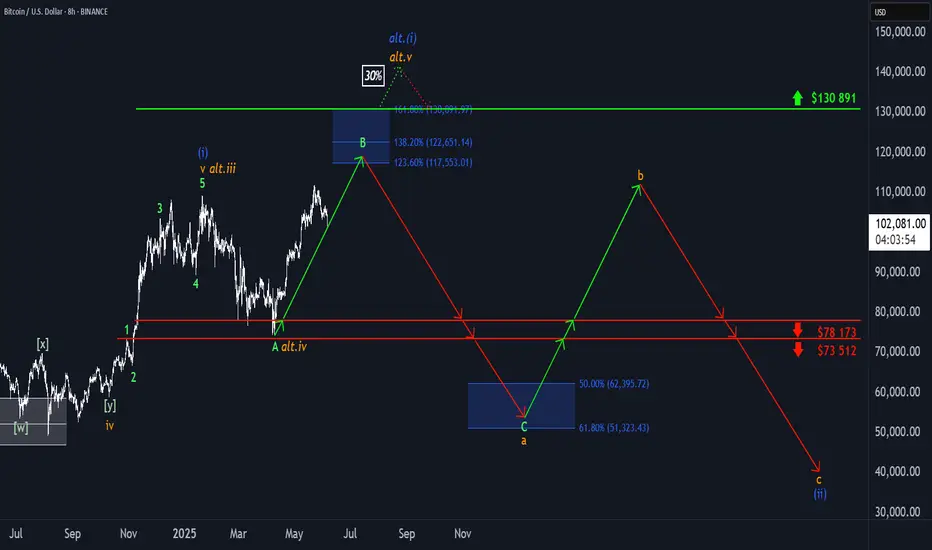
BTC: Facing Resistance?Bitcoin recently encountered renewed selling pressure, stalling the anticipated continuation of green wave B. Under the primary scenario, this corrective upward movement should still extend into the upper blue Target Zone between $117,553 and $130,891, where the price is expected to reverse and initiate green wave C. That move should complete with a low in the lower blue Target Zone between $62,395 and $51,323, thereby finalizing orange wave a. Following a corrective advance in wave b, the larger wave (ii) should reach its conclusion. There remains a 30% probability for the alternative scenario, in which BTC pushes above the upper blue Target Zone, establishing a new high in blue wave alt.(i)— which would delay the expected pullback.
📈 Over 190 precise analyses, clear entry points, and defined Target Zones - that's what we do.
My break and Retest StrategyHow to catch quick 100+ pips on BTC using this break and retest strategy

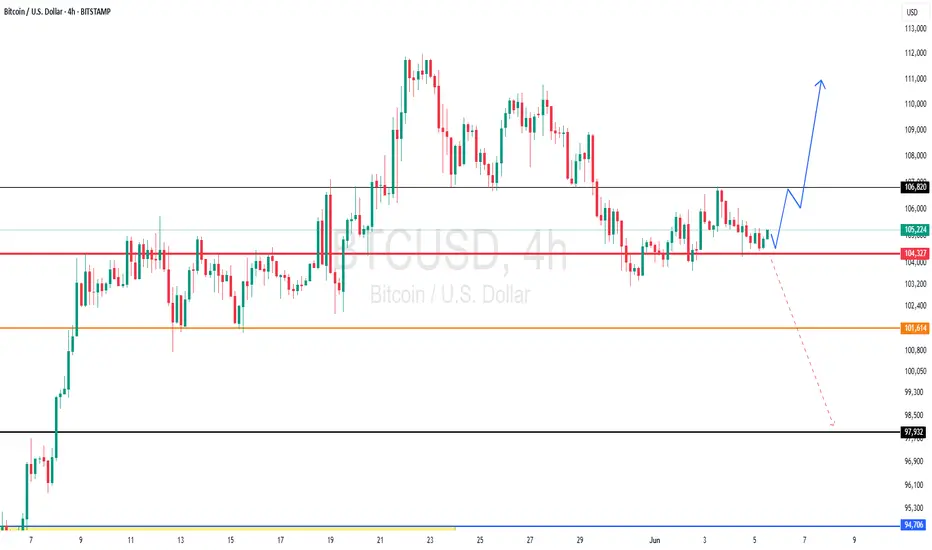
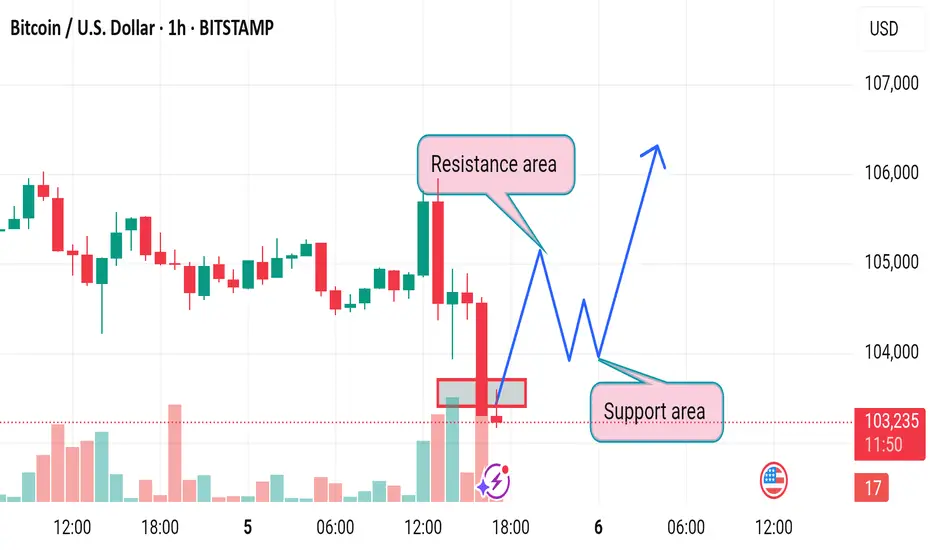
Market next move Disruptive Bearish Scenarios:
1. Support Area Breakdown
The recent strong bearish candle with high volume shows aggressive selling pressure.
If the price fails to hold above the support area and closes below it, especially on high volume, it could invalidate the bullish recovery.
> Bearish Alternative: Price breaks below 103,000, retests it as resistance (bearish flip), and continues down toward 101,000–100,000.
---
2. Lower High Trap
The projected bounce could form a lower high below the 106,000 resistance, creating a classic bearish structure.
> Disruption Path: After a minor recovery toward 104,500–105,000, sellers regain control, and BTC resumes the downtrend.
---
3. Fake Support Bounce
The support area could create a fake-out bounce, tricking long traders before a sharper reversal.
The move up may lack follow-through due to diminishing bullish volume.
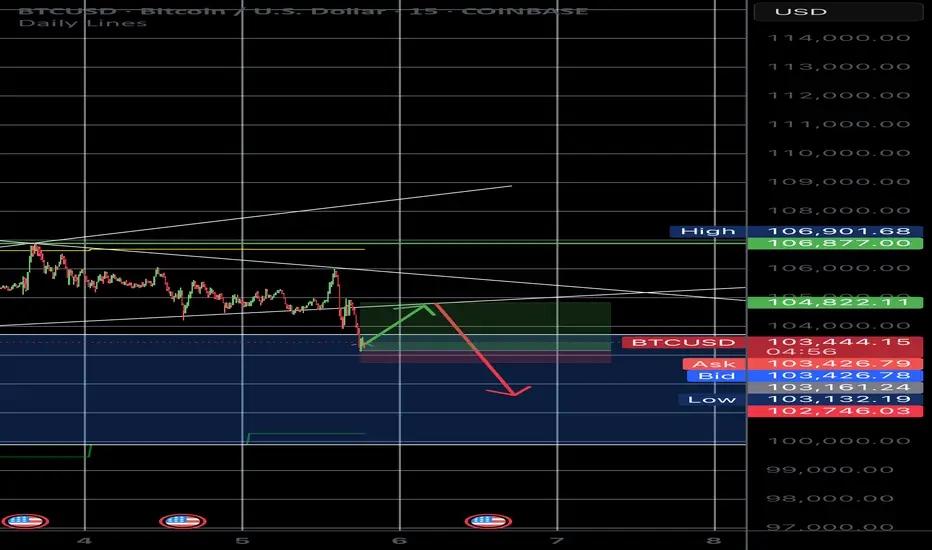
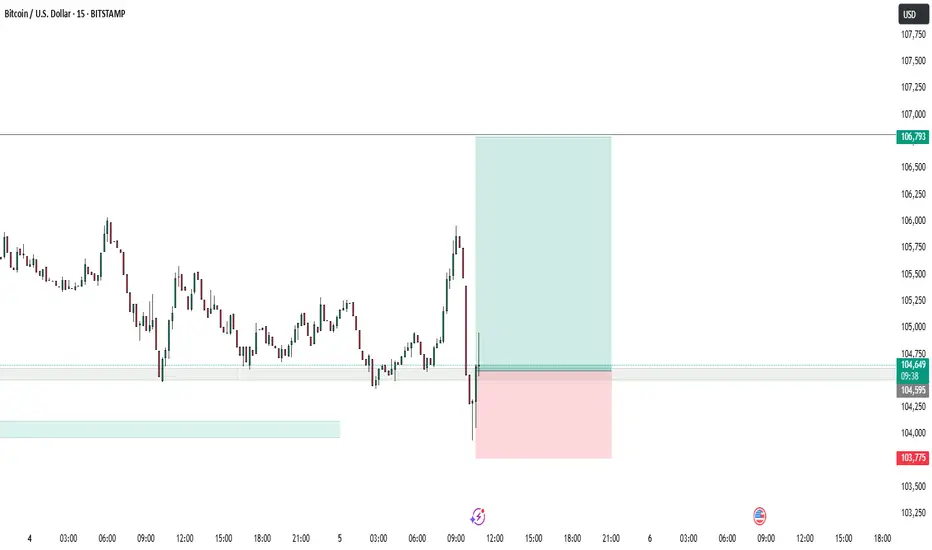
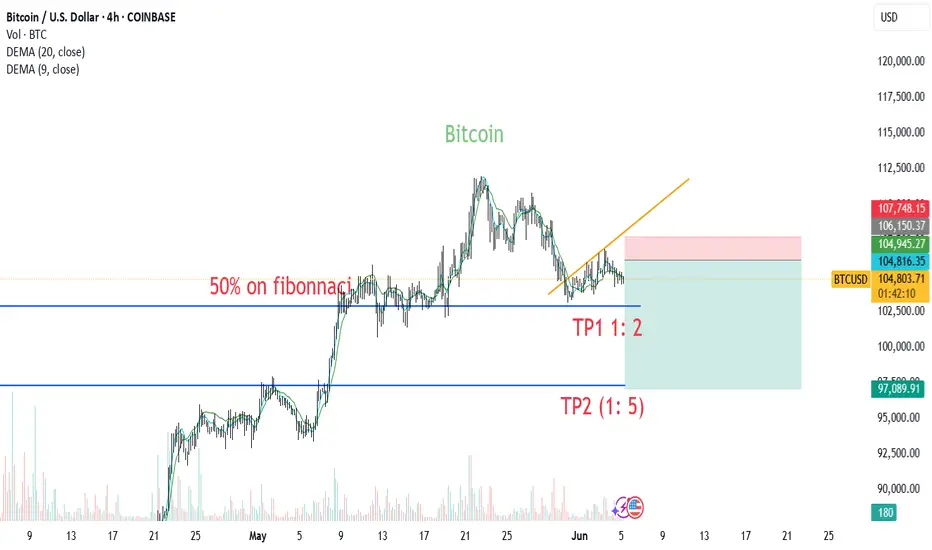
Short trade BTC/USD to 105k A retest of a crucial support is currently underway. If the support cannot be broken expect bitcoin to retest 105,000k and then retest the crucial support once again at 103,000k. If the support is broken we will drop to a range of 99,600k to 101,600k.
Entry 103,100
TP1 104,000
TP2 105,000
SL 102,750
BTCUSD ShortWe´re in a range at the Moment. I exscpect the price to retest the Daily open once again and after confirmation a bearish move to retest the bottom of the Range once again

BTCUSD BUY ALERT Entry Point: 104,900BTCUSD BUY ALERT
Entry Point: 104,900
🎯 Target 1: 106,000
🎯 Target 2: 107,000
🎯 Final Target: 109,000
🛡 Risk Management First!
– Always use a stop-loss
– Never risk more than you can afford to lose
– Stick to your trading plan
📊 Trade Rationale:
– Bullish momentum building
– Key support holding near 104,900
– Potential breakout in progress
💡 Tips for Traders:
✔ Secure profits at each level
✔ Don’t let FOMO take over
✔ Scale in wisely, don’t overleverage
📌 Stay focused, stay disciplined
📌 Trust the process, not the noise
📌 Risk small, think big!
📢 For educational purposes only – trade safe!
A rocket is fueling on the launch padNever before has Bitcoin so thoroughly built a launch pad. Retail interest is still low after the 2024 top and corporate/governmental interest is through the roof. This is going to be a massive bubble playing out over the next 3-6 months, possibly even over $300k Bitcoin at the end as the narrative shifts from "BITCOIN IS SPECULATIVE" to "BITCOIN IS A MUST HAVE ASSET" and retail will FOMO in as they always do.
The higher it goes, the more brutal the bear market will be. in late 2026-2027 the narrative will be "CRYPTO IS A SCAM". Corporate treasuries that jumped in late will be dumping bitcoin from their balance sheet and all these leveraged longs will fully unwind. Whales will start to accumulate and the 2029 cycle will be epic.
I'll believe cycles are dead when i see evidence of it. I haven't yet. Play this one right boys! Life changing money is coming.

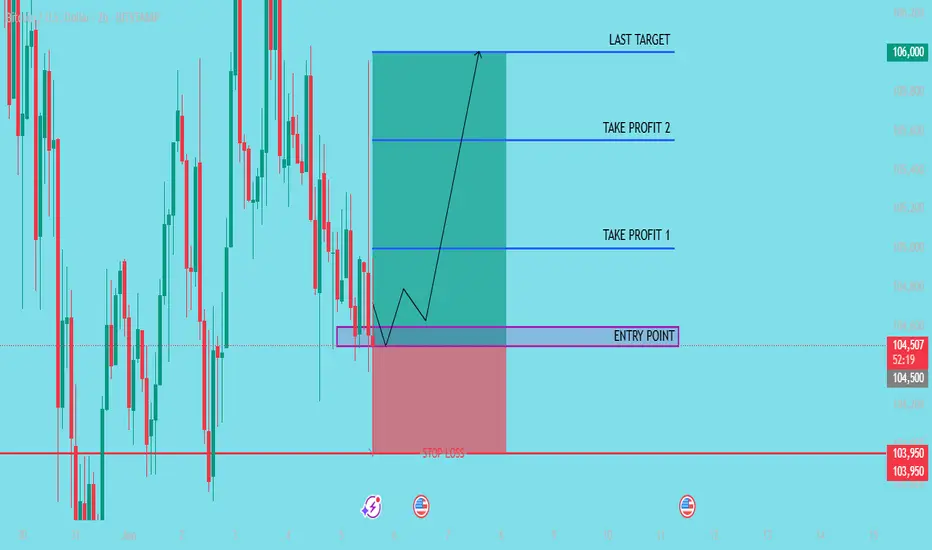
CHECK BTCUSD SIGNAL READ CAPTAINbtcusd) buy zone
(trade satup)
entry point (104.600) to (104.500) 📊
first target (105000)📊
2nd target (105.550) 📊
last target (106.000) 📊
stop loss (104.950)❌
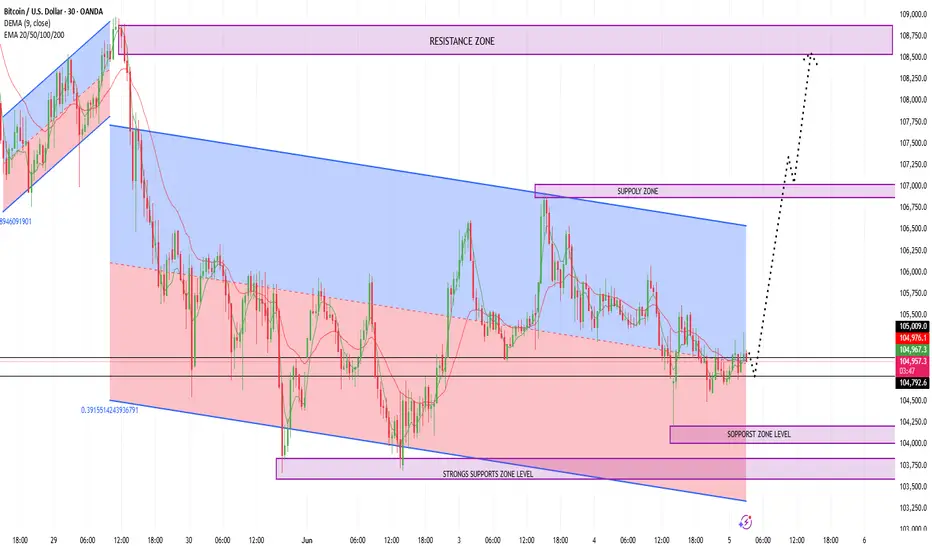
Bitcoin in strategic zone and price personal idea: if Bitcoin hold this zone and create good volume candle in 4 hours time frame, new ATH will be possible. Good 🙂 luck 👍

4H EMA 174Very interesting to see BTC perfectly tap the EMA 174. in the 4H, the EMA 174 has been the line to watch for support vs resistance. Hoping that we see a double bottom 'W' in the 1D chart, regain 106 and then... MOON.
BTCUSDThis seems interesting .long trade on btcusd , lol i thought i was done fore the week but duty calls.
BITCOIN : The Moment of Truth.Ladies and gentlemen the moment of truth has arrived for Bitcoin.
The set up will be completed once it test recent low by end of week (if not sooner).
Should start its journey to break the ATHs and continue higher and I mean IT MUST cause it will have only 3 more weeks to break the ATHs and advance to the $118k line before a pullback, NO IFs or BUTs. Once it bounces and if it fails to break res line $107k then door will be open for new numbers below $100k.
Place your bets ladies and gentlemen and buckle up we are heading for a wild...wild ride.

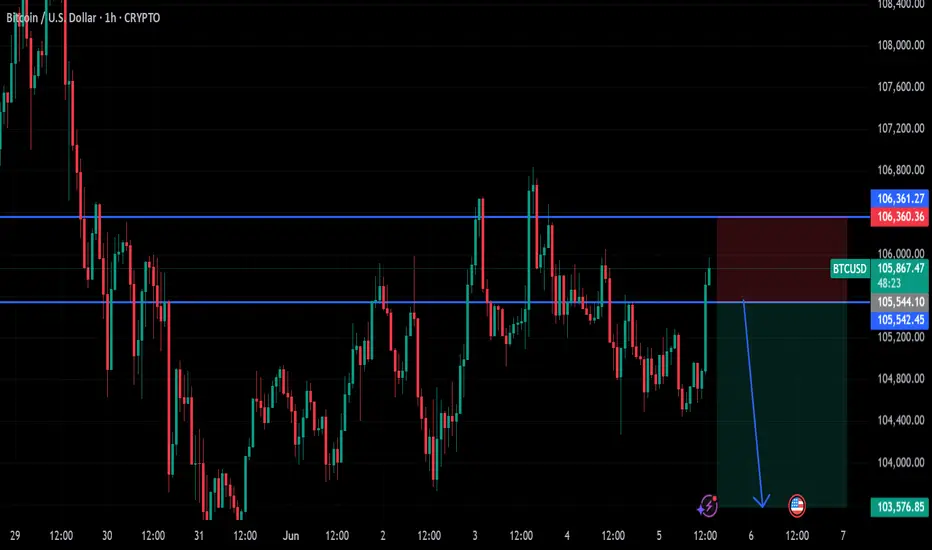
btc on selling#BTCUSD price have recorrect above 105600 showing bullish range, now we need price to fall to cover the projection.
Sell Below 105545, take profit 103555, Stop loss 106360.
Possible closure on current H1 above 106360 will break the next zone 106900-107200.
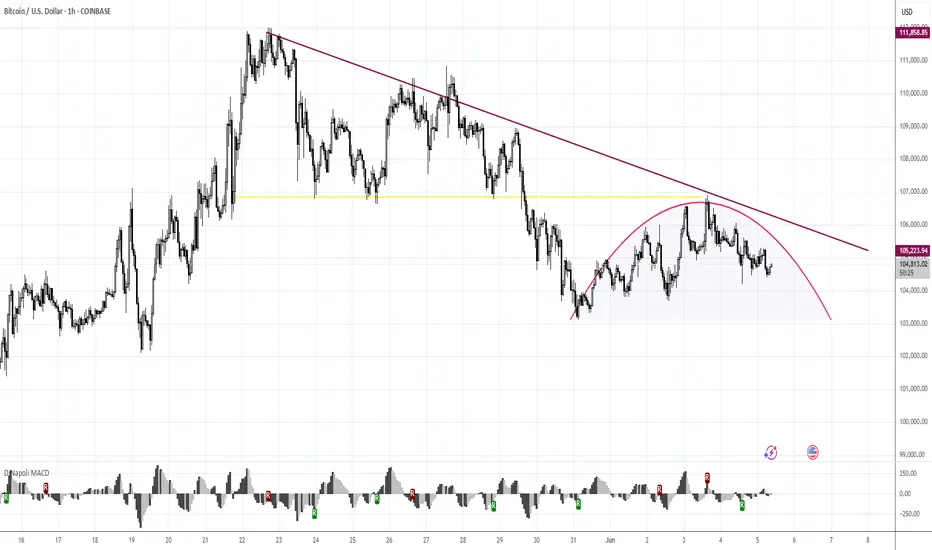
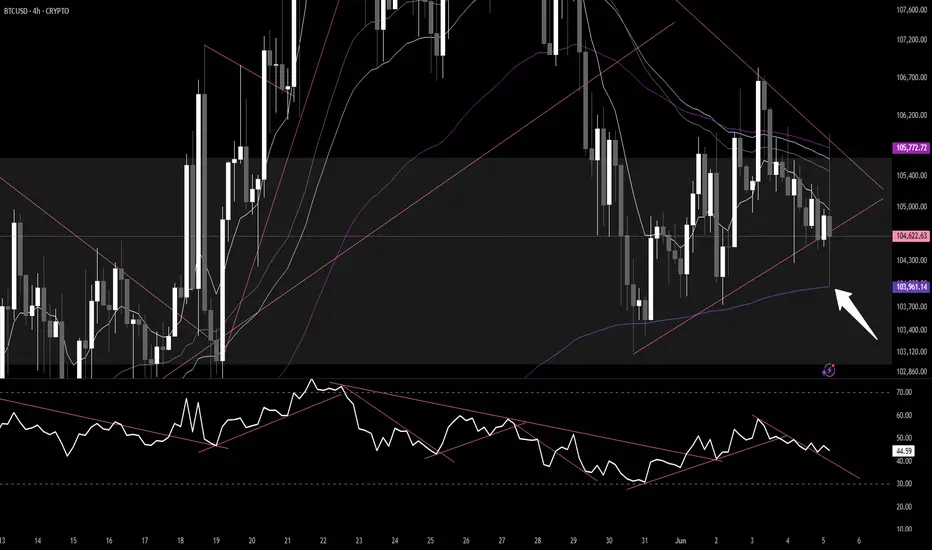
BITCOIN under brutal 4H squeeze. Buyers or sellers will prevail?Bitcoin (BTCUSD) is currently under the strongest squeeze we've seen this year as it's being compressed between the 4H MA50 (blue trend-line) and 4H MA200 (orange trend-line). Such tight price action usual precedes explosive moves.
Technically two patterns prevail: a long-term Channel Up and a short-term Head and Shoulders (H&S). Naturally, as long as the Channel Up holds (and is still valid), the pattern will attempt to push the price to he 2.0 Fibonacci extension at $121500 (and higher). If on the other hand it breaks (4H MA200 would be an early signal), the H&S may push the price to the -1.0 Fibonacci extension at $95000.
So what do you think? Which pattern will prevail? Feel free to let us know in the comments section below!
-------------------------------------------------------------------------------
** Please LIKE 👍, FOLLOW ✅, SHARE 🙌 and COMMENT ✍ if you enjoy this idea! Also share your ideas and charts in the comments section below! This is best way to keep it relevant, support us, keep the content here free and allow the idea to reach as many people as possible. **
-------------------------------------------------------------------------------
💸💸💸💸💸💸
👇 👇 👇 👇 👇 👇

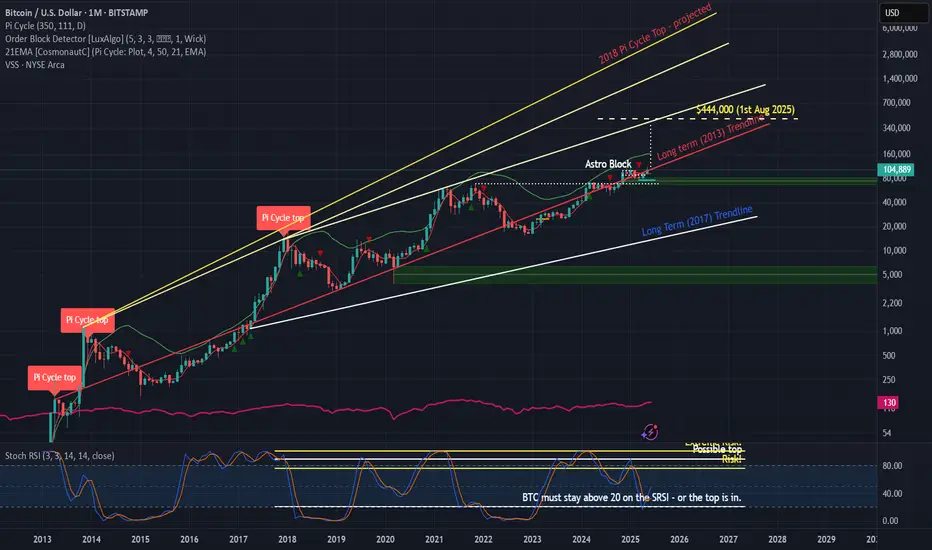
$BTC 2025: The road to $444,000As predicted by @JoshMandell6 on X earlier this year, this chart is an entirely theoretical exercise (a pure hopium mind-burp if you will) to explore the remote possibility that a CRYPTOCAP:BTC price of $444K might even be achievable in any scenario. I simply drew a line from the Pi Cycle top in 2017/18, to the top in March 2021 and projected on to now (June 2025). I then marked off the $444K prediction made earlier this year by @JoshMandell6 (the yellow horizontal, dashed line). I then checked prior BTC cycles to see there are any examples where BTC was able to climb this distance within 2 monthly candles. Interestingly, if you take the last 2 monthly candles from the 2017/18 cycle (before and including the topping candle), it does line up pretty well. This suggests it is theoretically possible for BTC to reach $444k by August 1st 2025 - I know this is highly unlikely of course; but interesting all the same.
For additional context to this theory: the specific post I'm referring to was made by Josh Mandell (@JoshMandell6) on X (formerly Twitter) on November 5, 2024. In this post, Mandell presented a poetic prediction stating that Bitcoin would reach $84,000 on March 14, 2025, and subsequently surge to approximately $444,000. The prediction included symbolic phrases like “three four, times a thousand,” suggesting a target price of $444,000.
Mandell's forecast gained significant attention when Bitcoin indeed closed near $84,000 on March 14, 2025, aligning with his prediction. This accuracy bolstered his reputation, especially considering his background as a former trader at Salomon Brothers and Caxton Associates. He has also been transparent about his trading activities, publicly sharing his portfolio, which reportedly grew from $2.1 million to over $22 million by March 2025.
en.bitcoinsistemi.com
For a more in-depth understanding of Mandell's prediction and its implications, you might find this video insightful: youtu.be
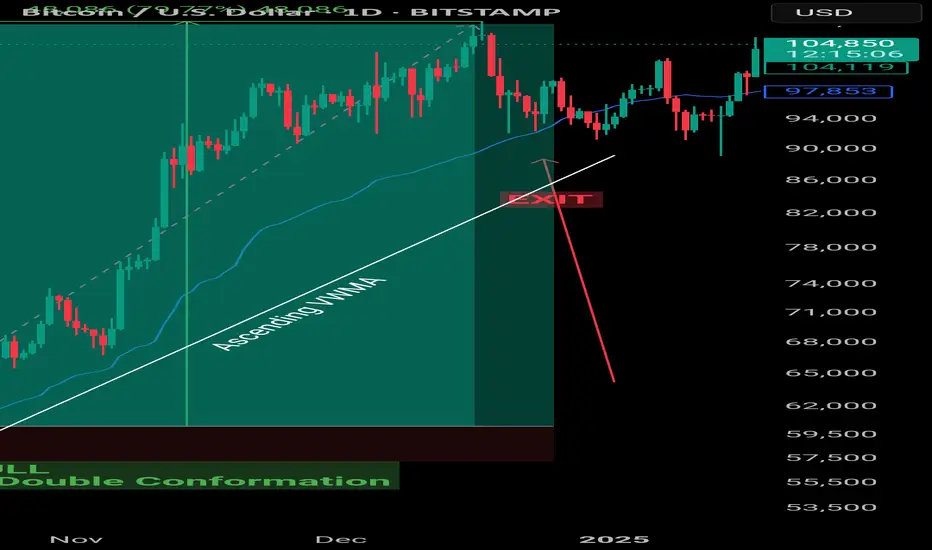
VWMA : Example Volume weighted Moving Average
🔍 VWMA in Crypto Trading
Smarter than simple MAs. Powered by volume.
What is VWMA?
🎯 VWMA = Price + Volume Combined
Unlike SMA/EMA, VWMA gives more weight to high-volume candles.
✅ Shows where the real trading pressure is.
Why Use VWMA?
💥 Volume Confirms Price
Price movement + High Volume = Stronger Signal
VWMA adjusts faster when volume spikes
📊 More reliable in volatile crypto markets.
Some VWMA Settings
📊 Optimal VWMA Periods by Timeframe
🕒 15m – VWMA 20 → For scalping
🕞 30m – VWMA 20/30 → Intraday breakouts
🕐 1h – VWMA 30/50 → Trend filter + RSI combo
🕓 4h – VWMA 50/100 → Swing trading
📅 1D – VWMA 50/100/200 → Macro trend + S/R levels
Go through different settings to see what suits you best.
VWMA in Action
📈 Price Above VWMA = Bullish Strength
More confidence in uptrend
Especially valid during high volume surges
🟢 Great confluence with MA 7/9 in short-term setups
Dynamic Support/Resistance
🛡️ VWMA Reacts to Market Strength
Acts as dynamic support or resistance—especially when volume increases.
Useful in catching pullback entries or trailing SLs.
🚦 Filter Fakeouts with VWMA + MA
✅ Use in confluence for stronger edge.
Tips for VWMA
📌 Use shorter VWMA (20–30) for entries
📌 Use longer VWMA (50–200) for trend validation
🎯 Works best in trending, high-volume conditions
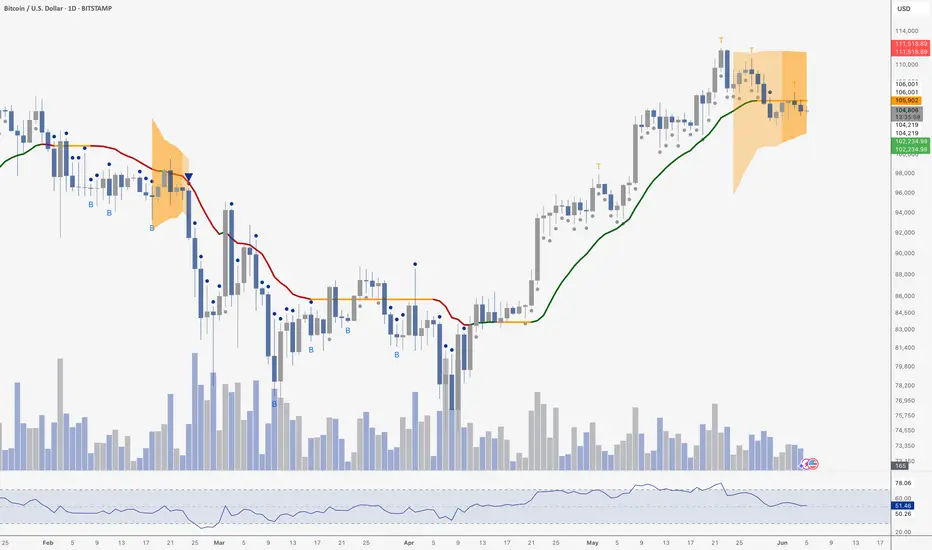
Bitcoin Looks BearishToday, I want to take a look at the Bitcoin chart using Trading Alpha. This is an indicator suite that I often reference, and the creator Wick is often on my shows.
The daily chart paints a shaky picture for Bitcoin (weekly still looks great). As you can see, we have multiple top signals (Ts), which have been confirmed by down candles the next day. We also lost the grey bullish dots last week, and trackline has flipped from support to resistance. The orange squeeze shading indicates that volatility is likely to pick up soon - it could go either way, but the indicators are leaning more bearish for now.
It will be interesting to see what Bitcon does next.
BITCOIN IS DUMPINGbitcoin is dumping looking for smart money liquidity , before it reach some new all time high levels. its has to dump all the smart money lquidity laying around 95k and slightly above 102k
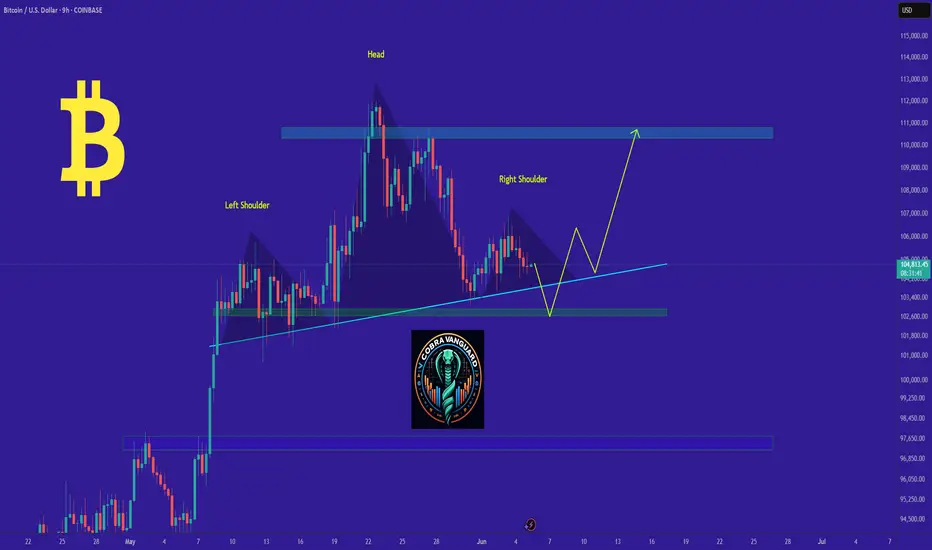
This is a deception or maybe a technique !!!I think this head and shoulders pattern is trying to deceive us and is fake. I expect the price to drop to the support line and then rise to $109k. WAIT FOR IT....
Give me some energy !!
The Crypto Market Game: How to Win Against Fear and Manipulation
Did you really think profiting from the current bull run (a comprehensive upward market) would be easy? Don't be naive. Do you think they’ll let you buy low, hold, and sell high without any struggle? If it were that simple, everyone would be rich. But the truth is: 90% of you will lose. Why? Because the crypto market is not designed for everyone to win.
They will shake you. They will make you doubt everything. They will create panic, causing you to sell at the worst possible moment. Do you know what happens next? The best players in this game buy when there’s fear, not sell—because your panic gives them cheap assets.
This is how the game works: strong hands feed off weak hands. They exaggerate every dip, every correction, every sell-off. They make it look like the end of the world so you abandon everything. And when the market rises again, you’re left sitting there asking, “What just happened?”
This is not an accident. It’s a system. The market rewards patience and punishes weak emotions. The big players already know your thoughts. They know exactly when and how to stir fear, forcing you to give up. When you panic, they profit. They don’t just play the market—they play you. That’s why most people never succeed: they fall into the same traps over and over again.
People don’t realize that dips, FUD (fear, uncertainty, doubt), and panic are all part of the plan. But the winners? They block out the noise. They know that fear is temporary, but smart decisions last forever.
We’ve seen this play out hundreds of times. They pump the market after you sell. They take your assets, hold them, and sell them back to you at the top—leaving you with nothing, wondering how it happened.
Don’t play their game. Play your own.
Weak bearish contextMorning folks,
Not many changes since our last discussion. Yes BTC moved slightly lower, as we suggested, but you can see by yourself - action is very slow and lazy. Usually when bears control the market, action has to be stronger.
It means that overall context remains bearish but it is weak and not very attractive for trading, although it is not forbidden of course. We consider upside breakout of 107-108K area as a vital moment for this context. While downside target is around 97-98K.