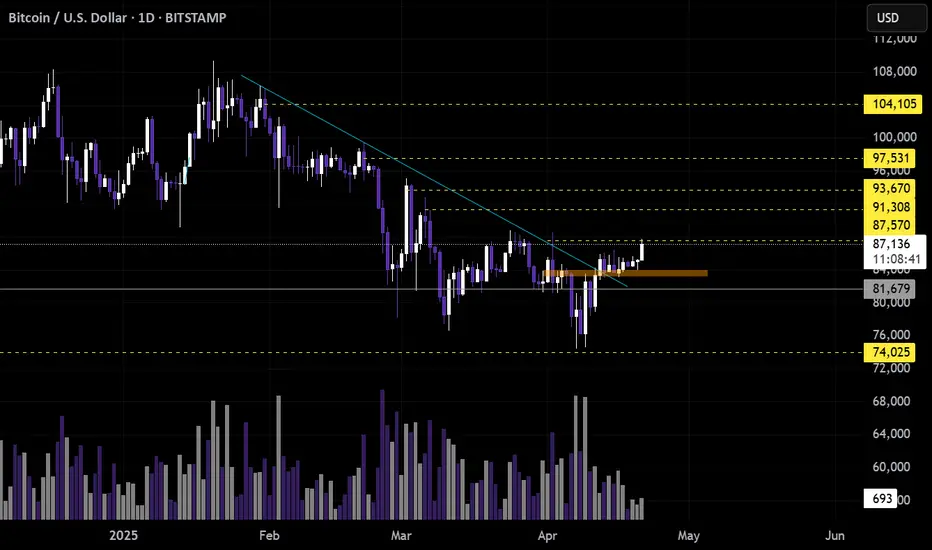
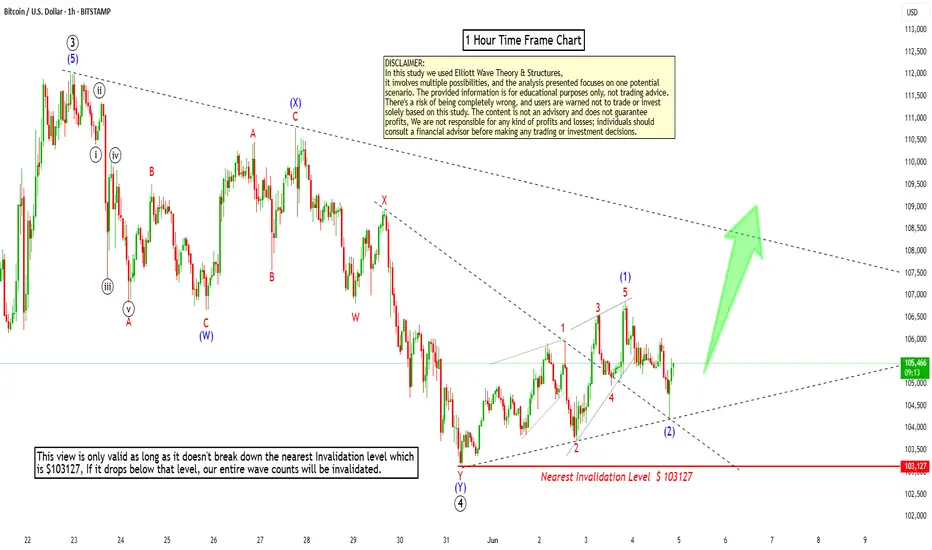
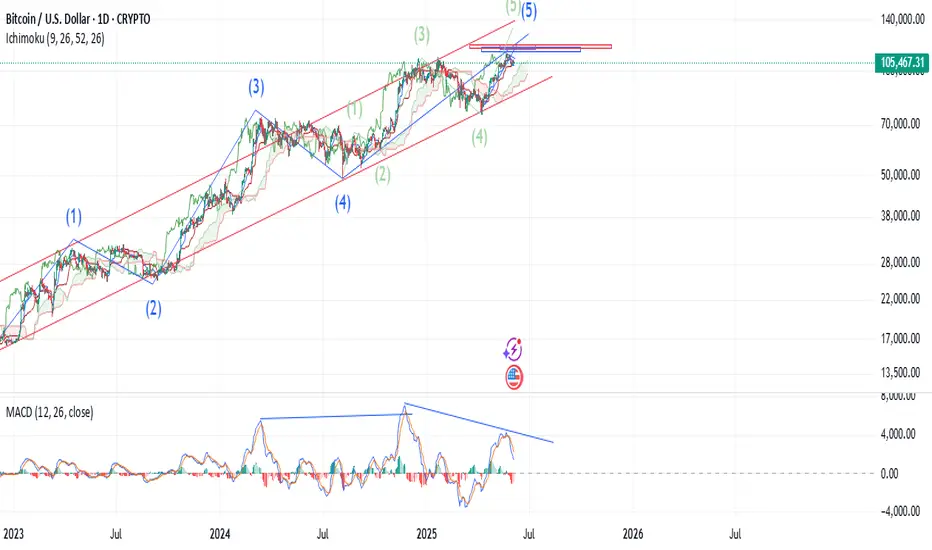
BTCUSD Wave Count: Bitcoin Unfolding Wave ((5)) ?Hello Friends,
Welcome to RK_Chaarts,
Let's analyze the Bitcoin chart today using Elliott Wave theory. As we can see, Bitcoin recently made a high around $112,000 on 23rd May 2025. We've marked this as the completion of Primary Degree Black Wave ((3)). After that, it dropped to complete Wave ((4)) on 31st May 2025. Now, it's moving up, possibly unfolding Wave ((5)). According to Elliott Wave principles, Wave 2 cannot retrace more than 100% of Wave 1. So, our nearest invalidation level is the 31st May's low at $103000. If the price sustains above this level, we can expect it to move towards $115,000 as a Projected Target of wave ((5)). However, if it breaks below the invalidation level, we'll need to re-analyze the wave counts. We've also drawn some trend lines, marked in black dotted lines, which act as support and resistance. This is a 1-hour time frame chart. The red line marking the nearest invalidation level is crucial. If it breaks, we'll need to adjust our wave counts. If it holds, we can expect the price to move up towards $115,000. Let's see how the market unfolds. Please note that this is an educational analysis and not a trading tip or advice.
Analysis Summary
- Analyzing Bitcoin chart using Elliott Wave theory to understand market trends and potential price movements.
- Recent high around $112,000 on 23rd May 2025, & Recent Low around $103,000 on 31st May 2025 indicates a significant turning point in the market.
Wave Count
- Completed Primary Degree Black Wave ((3)) suggests a major uptrend has concluded.
- Completed Wave ((4)) on 31st May 2025 indicates a correction phase has ended.
- Possibly unfolding Wave ((5)) implies a new uptrend may be emerging.
Key Levels
- Nearest invalidation level: 31st May's low at $103,000 serves as a crucial support level.
- Projected Target: $115,000 represents a potential upside target based on Elliott Wave principles.
Elliott Wave Principles
- Wave 2 cannot retrace more than 100% of Wave 1: a key rule governing wave relationships.
- Wave ((5)) projection based on Fibonacci ratios and wave extensions.
Chart Details
- 1-hour time frame chart provides a detailed view of recent price action.
- Trend lines marked in black dotted lines highlight key support and resistance levels.
- Red line marking nearest invalidation level is crucial for validating the wave count.
Important Notes
- Breaking below the invalidation level would require re-evaluation of the wave count.
- Sustaining above the invalidation level increases confidence in the projected target.
I am not Sebi registered analyst.
My studies are for educational purpose only.
Please Consult your financial advisor before trading or investing.
I am not responsible for any kinds of your profits and your losses.
Most investors treat trading as a hobby because they have a full-time job doing something else.
However, If you treat trading like a business, it will pay you like a business.
If you treat like a hobby, hobbies don't pay, they cost you...!
Hope this post is helpful to community
Thanks
RK💕
Disclaimer and Risk Warning.
The analysis and discussion provided on in.tradingview.com is intended for educational purposes only and should not be relied upon for trading decisions. RK_Chaarts is not an investment adviser and the information provided here should not be taken as professional investment advice. Before buying or selling any investments, securities, or precious metals, it is recommended that you conduct your own due diligence. RK_Chaarts does not share in your profits and will not take responsibility for any losses you may incur. So Please Consult your financial advisor before trading or investing.
BTCUSD.PI trade ideas
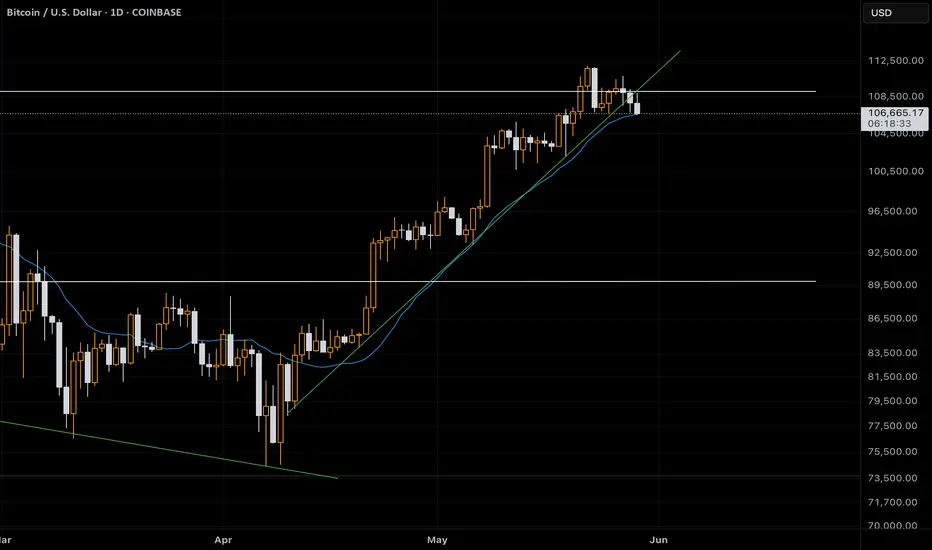
BTCUSD BUY NOW ENTRY POINT 105,700BTC/USD TRADE IDEA – BUY NOW
Buy Entry Point: 105,700
🎯 Target 1: 106,000
🎯 Target 2: 107,000
🎯 Final Target: 110,000
📈 Bitcoin pushing higher – bullish signals are in play!
🟢 Entry level at 105,700 offers solid upside potential.
📊 Momentum building with room to run.
🧠 Smart trading starts with smart planning.
⚠️ Risk Management is CRUCIAL – don’t skip it!
🛑 Set a proper stop-loss to control risk.
📉 Avoid overleveraging – protect your capital.
🧭 Stick to the strategy, not emotions.
🚀 Ride the wave, but know when to exit.
🧮 Let the math guide your trade, not the hype.
💹 Focus on consistent gains, not lucky hits.
📌 Monitor key levels and global sentiment.
🗓️ Stay updated with economic and crypto news.
💬 Drop your thoughts and charts below!
🎓 Learn daily – the market is your teacher.
🙌 Wishing you clean entries and green profits!
#BTCUSD #Bitcoin #CryptoTrading #RiskManagement #TradingPlan

BTC NEWS 1DAs lower price 104.5k is most likely to get touched and then 106k will be achived in the end of today !
this is only an idea everyone should do their own research
𓄀𝓈𝓉𝒶𝓎 𝓉𝓊𝓃ℯ𝒹 𓃓

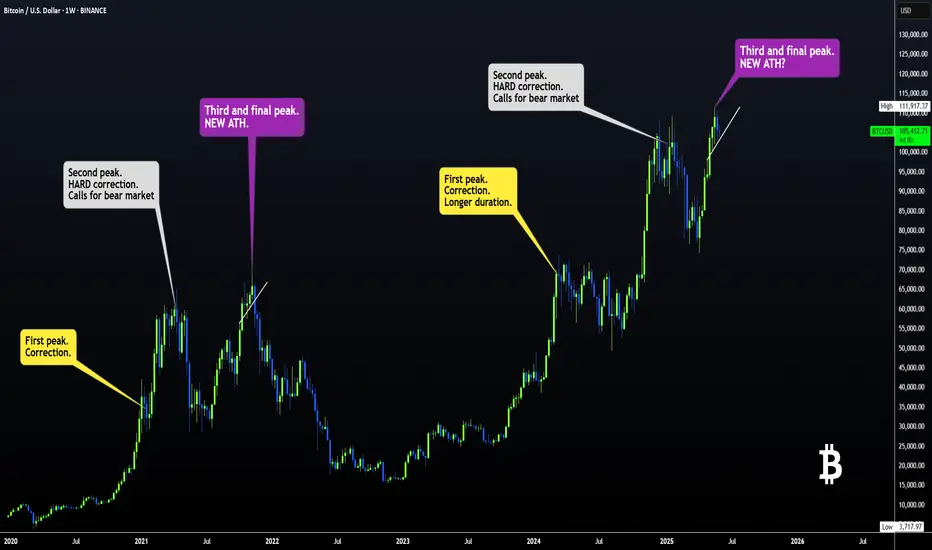
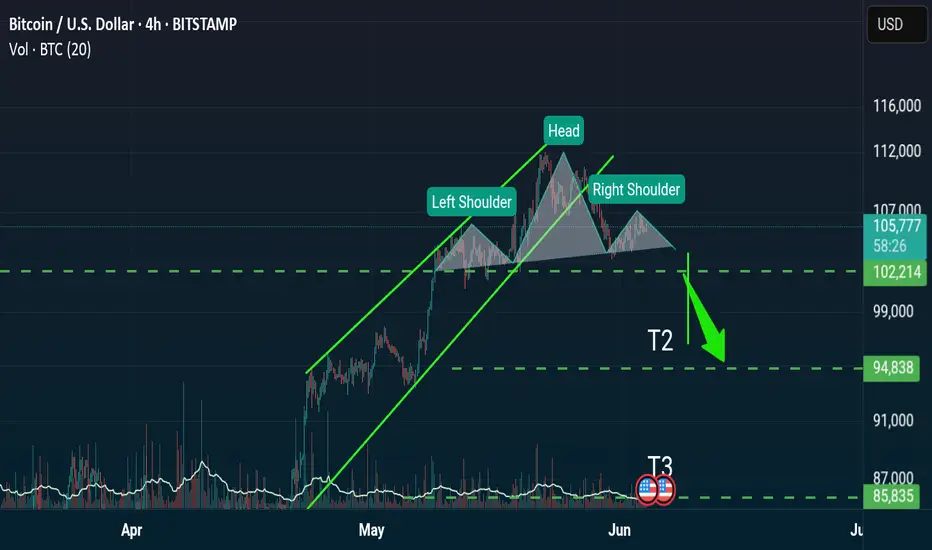
BTC FRACTAL : Has BTC been following THIS EXACT PATTERN?The only difference in terms of the first peak, is the duration. But even the pullback size has been similar:
Interestingly, in terms of the second peak, the increase from the corrective bottom to the new ATH is almost exact at 122%:
Here's why we MAY still have a small push upward:
- The previous time, the peak was at least 6% higher. Currently, that would put us around 116K.
- The current pennant pattern is different from the previous bearish flag.
2%:
Pattern:
Do you think the bearish cycle is starting, or is another push up likely?
___________________
BINANCE:BTCUSD

Next Tradable Cycle Turns (Intraday)This chart contains the timings for several turns and accelerations in Bitcoin for intraday setups.
Make sure the price is at a meaningful support or resistance when coincident with a vertical line.
This technique also derives some horizontal lines for support and resistance, but you should use your levels as well.
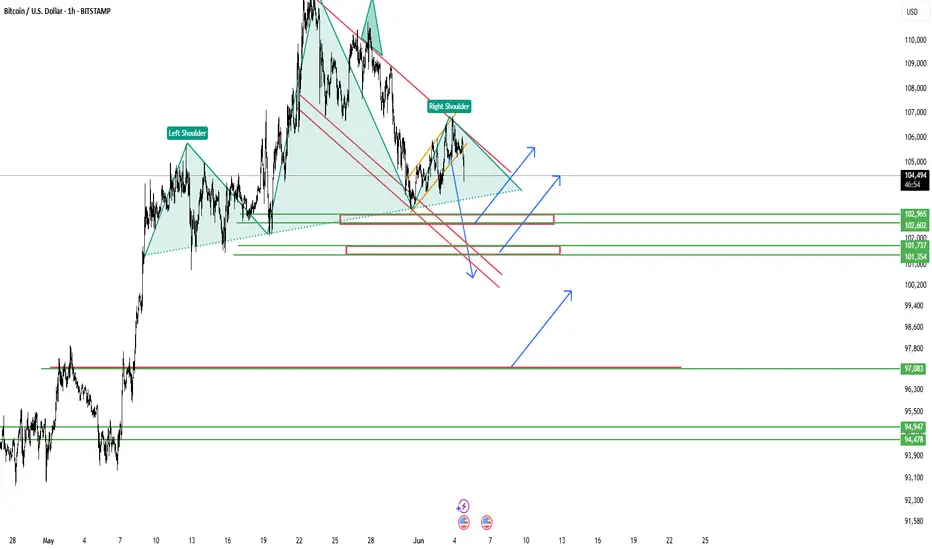
Bitcoin - Bearish Head & Shoulders Within a Falling Wedge | Key This chart illustrates a potential Head and Shoulders pattern, signaling a possible trend reversal on the 1H Bitcoin/USD timeframe. The price is currently compressing within a falling wedge, and the right shoulder has recently completed.
Key highlights:
Head & Shoulders pattern: Suggests a bearish reversal if neckline breaks.
Price inside falling wedge: Could act as a short-term consolidation structure before a breakout.
Demand zones:
102,965 – 102,602
107,000 – 101,737
97,350 – 97,083
Scenarios:
Bullish breakout of the wedge may invalidate the head & shoulders and trigger upside continuation.
Bearish breakdown below neckline and demand zones could open deeper retracements.
This setup offers a clear "wait-for-confirmation" strategy before entering long or short, based on price reaction at key levels.
If this Head & Shoulders plays out... oh boy 😏
We’re diving straight into those demand zones.
Next stops?
🔻 102,600
🔻 101,700
🔻 97,000 (ultimate trap zone)
But hey — break the wedge to the upside and bulls might flip the script.
Let’s see who wins 🔥📉📈
#Bitcoin #BTC #HeadAndShoulders #CryptoAnalysis
The deeper the dip, the more precise the entry.BTC didn’t break. It reloaded.
This isn’t fear — it’s efficiency. And the market just offered a second chance to those who didn’t hesitate.
Here’s the logic:
Price is holding above the 4H OB, and the entry zone aligns perfectly with the Daily FVG — a textbook reaccumulation base
Below that sits another 4H OB — clean invalidation and maximum risk definition
The bullish thesis stays intact as long as price holds above 101,511 — anything between here and that OB is just noise
Above, the first objective remains 107,739, then a sweep into the Daily OB around 111,861. That’s where real distribution begins — not before.
Execution view:
Long from 103k–104k with conviction
Invalidation: 101.5k
TP1: 107.7k
TP2: 111.8k
Beyond that? We follow structure
They’ll panic on the retrace. I’ll build position. Precision isn’t about calling tops — it’s about knowing where price wants to rebalance.
More like this? The profile description holds the rest.

BTC Market Structure Summary🔹 Market Structure Summary
🔼 The impulsive structure (1–5) confirms bullish dominance in the medium term.
🔽 The ongoing ABC correction is healthy and expected in Elliott Wave Theory before continuation.
🔵 Once wave (c) completes at the projected zone (78.6%), a new bullish impulse could start, targeting higher highs above the previous ⑤ peak.

Bitcoin-is that it for now ? Lazy summer, take off in September?
Not posted this chart for a while but we may find it has become Very relevant to what to expect for the next few months
First thing to note is that PA is once again in TOP of range box and ALSO got rejected off the Long Term Blue line that has rejected BTC PA ATH since 2017. This also coincidened with the 1.618 Fib Extension.
Rejection here was highly likely and given how PA had pushed up, it is not surprising to see PA at least taking a breath.
For me, even though we do have the ability to push higher, I am not to sure we will just yet.
The weekly MACD could offer some credence to this idea
The Arrow points to an area that could turn out to be similar to what we are doing now.
The MACD has begun curling over after a prolonged push higher. While There was strength left, PA took a breath and regrouped.
The Chart below shows this period and how BTC PA reacted...and is circled
This was in Dec 2023 to Jan 2024.
PA had just had a sustained push higher and needed a break.and following a 7 week range, PA moved up another 67%
7 weeks from now brings us to near August.
There are charts that point towards a move in August / September
Here is another chart that offers some confluence to this idea.
The Dotted line is a line of support that PA has used as support numerous times this cycle and currently, is almost bang on the 50 SMA. Assuming that PA goes back down to that and bounces again, a 67% rise takes us back up to the Top of Range
Should we drop that far, to the 50 SMA again, we are in the 92K - 95K zone, scaring a LOT of people, wrecking Leverged players and putting Fear everywhere.
PERFECT FOR BUYING
This area also happens to be the 1.382 Fib extension on the main chart, the next Major line of support below us currently.
Should we fall through that, we reach the Bottom of Range and the intersection with the 50 SMA in.......August
So, we have to wait and see. We can push higher now but to do so would require breaking through that long term Blue line of resistance. I am not sure we can do that just yet.
Also, Should we post a RED June candle, Even a small one, the ideas in the Monthly candle post I recently posted also back up the idea of a lazy summer...... and a move higher around Mid to late August
Stay safe

BTC drop and Bounce targetsBTC need a fib retracement in order to keep going up, I think 0.5 is a bounce target to $120k
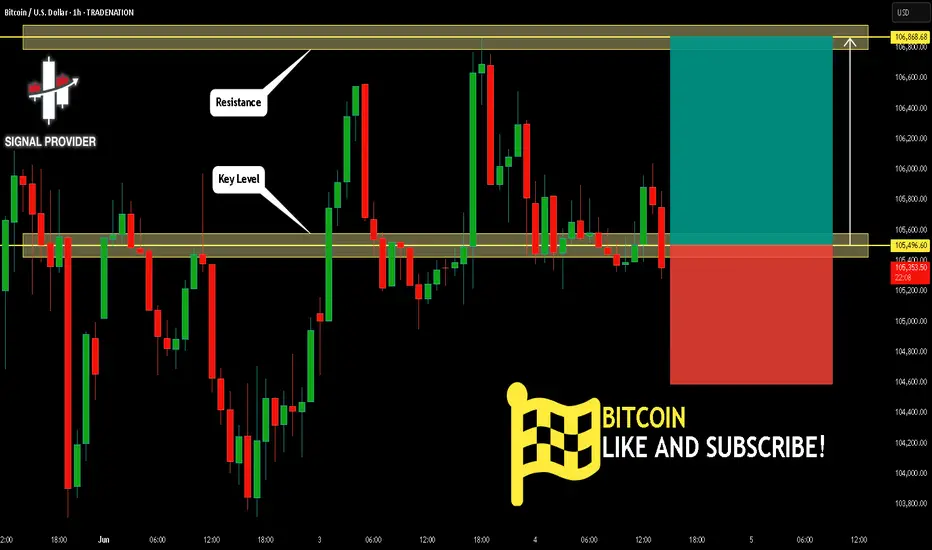
BITCOIN Will Move Higher! Long!
Please, check our technical outlook for BITCOIN.
Time Frame: 1h
Current Trend: Bullish
Sentiment: Oversold (based on 7-period RSI)
Forecast: Bullish
The price is testing a key support 105,496.60.
Current market trend & oversold RSI makes me think that buyers will push the price. I will anticipate a bullish movement at least to 106,868.68 level.
P.S
The term oversold refers to a condition where an asset has traded lower in price and has the potential for a price bounce.
Overbought refers to market scenarios where the instrument is traded considerably higher than its fair value. Overvaluation is caused by market sentiments when there is positive news.
Disclosure: I am part of Trade Nation's Influencer program and receive a monthly fee for using their TradingView charts in my analysis.
Like and subscribe and comment my ideas if you enjoy them!
Bitcoin Bear pattern Pair: BTC/Usdt
Timeframe: 4h
Pattern: head/shoulders
Rising wedge was breakout prev week, now not need forget about GAP $92 000
Attention always with long/short but cheap chance soon
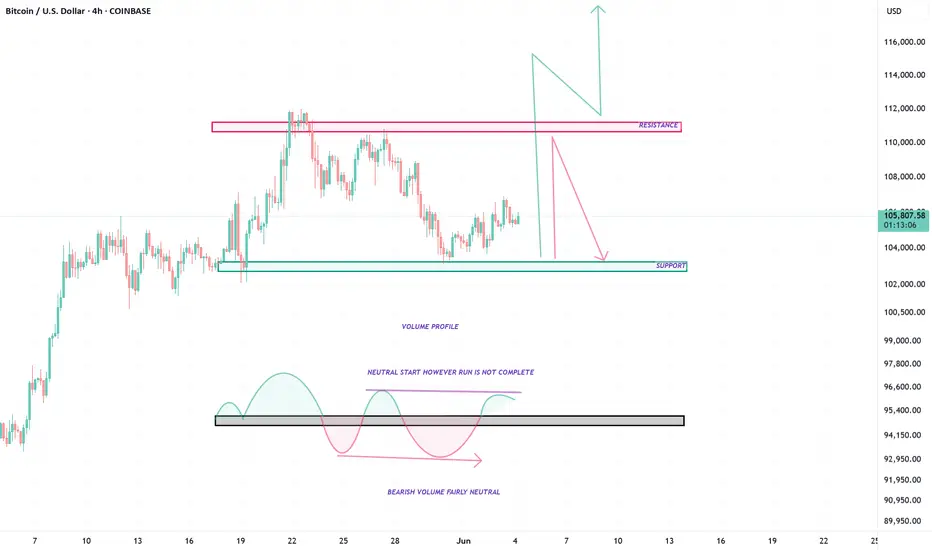
BTC - RUN TO RESISTANCE, WHAT NEXT ?Good Morning Everyone,
Hope all is well. BTC still has some strength left in this push upwards. Odds are that it will squeeze to get to that resistance. Expect either a strong break and further push up or lots of rejection at the resistance zone which will force BTC to renegotiate its supports below.
ENJOY!
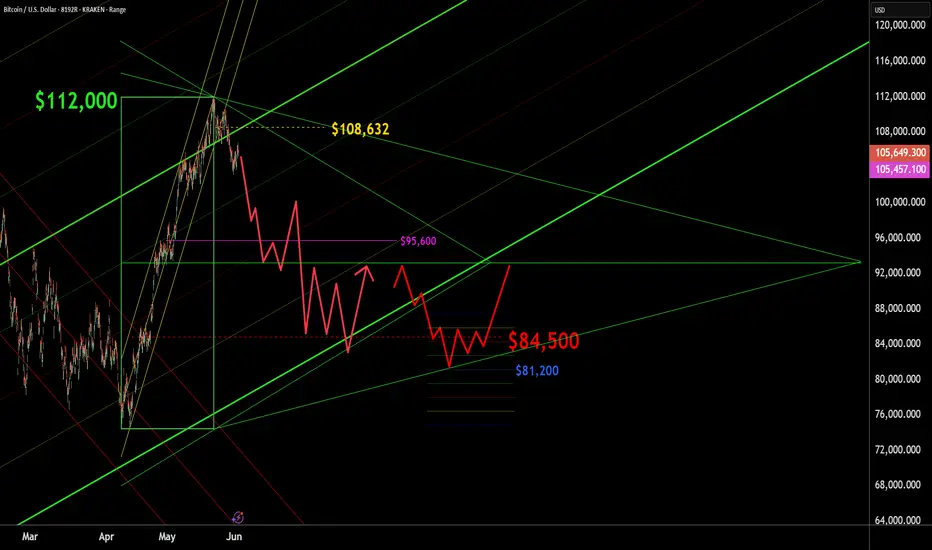
BTC - UPDATE - $84,500 target BTC appears to reluctantly be topping, with a while probability of having already topped at $112,000. My best estimate of the next on boarding price for BTC is in the $84,500 area. Prices above $108,632 indicate I was wrong. Pros could consider shorting to the same number. This is just conversation. And not trading advice. Murrey Math, Elliot Wave , Kumar Wave being employed. See past charts for how we got to here.
The price of Bitcoin is set to experience a major collapse!Based on its historical price action, bitcoin might crash to 55K in next one year.

Bitcoin in Fibonacci retracement 105, 537 shows a huge resistence level, since yesterday BTC is ranging in this area; we are waiting for the news to see which side is more favorable to undergo. Mostly showing positive sentiment and traders are solidifying their position.

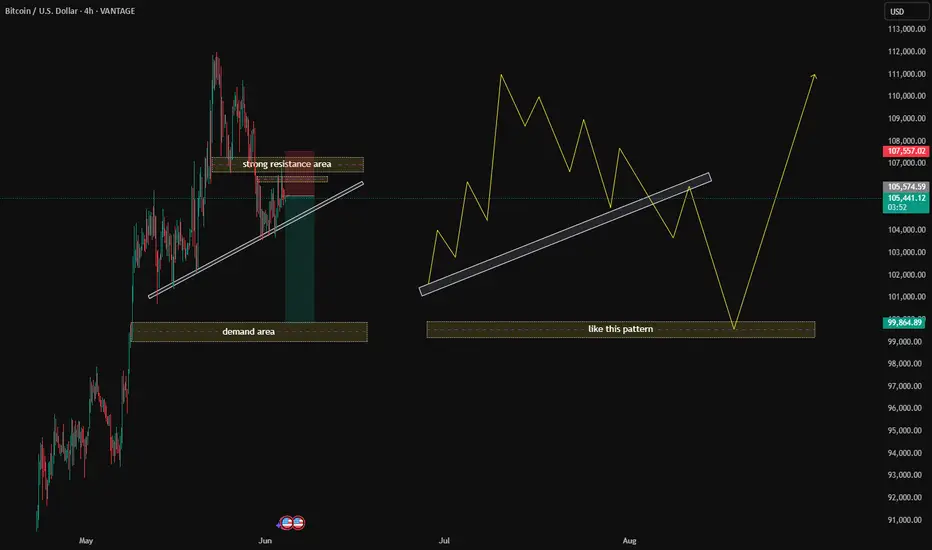
Key Chart Elements Bitcoin (BTCUSD) on the 4-hour timeframe🟡 Key Chart Elements:
1️⃣ Strong Resistance Area
This is marked with a red zone at the top.
This area is where sellers have historically stepped in, pushing the price down.
Price action is currently testing this area, indicating potential rejection or consolidation.
2️⃣ Demand Area
Marked in green at the bottom.
This is a previous area where buyers stepped in with strong momentum.
Price could bounce from here if it retraces.
3️⃣ Trendline Support
An upward-sloping white trendline acts as dynamic support.
Price has been respecting this trendline; any break below it might signal bearish momentum.
4️⃣ Yellow Zig-Zag Patterns
These lines represent price action forecasts or possible scenarios.
They show:
An initial bounce off resistance and then a potential retracement.
A deeper pullback towards the demand zone.
A final strong bullish move after retesting the lower support.
🔑 Scenario 1: (Left Side of Chart)
✅ Price is currently testing the strong resistance area while riding the trendline.
✅ If price respects this trendline and breaks above resistance, a continuation to the upside is expected.
✅ A stop-loss would typically be placed below the trendline.
✅ A take-profit could target previous highs near $107,000–$108,000.
🔑 Scenario 2: (Right Side of Chart)
✅ Shows a deeper retracement scenario:
Price breaks the trendline, heading toward the demand area (around $99,000).
After bouncing from demand, price respects the trendline from below, forming a bullish structure.
Once price stabilizes and reclaims the trendline, a strong bullish breakout is anticipated.
🔍 Suggested Trading Plan:
🔹 Aggressive Bulls:
Look for a break and retest above the strong resistance area (red zone).
Enter on confirmation with a tight stop below the trendline.
🔹 Conservative Bulls:
Wait for a deeper pullback into the demand area and the yellow projected structure.
Enter near $99,000 after confirmation (e.g., bullish engulfing candle or strong bounce).
🔹 Bears:
Watch for a strong rejection from the resistance area with a break of the trendline.
Consider shorting toward the demand area with a stop above the resistance zone.
💡 Conclusion:
Your chart suggests both bullish and bearish scenarios depending on price action near the key levels:
Strong resistance (~$106,000–$107,000)
Demand area (~$99,000–$100,000)
Trendline support (dynamic level)
Traders should watch for confirmation (e.g., break and retest, engulfing candles) before entering trades.
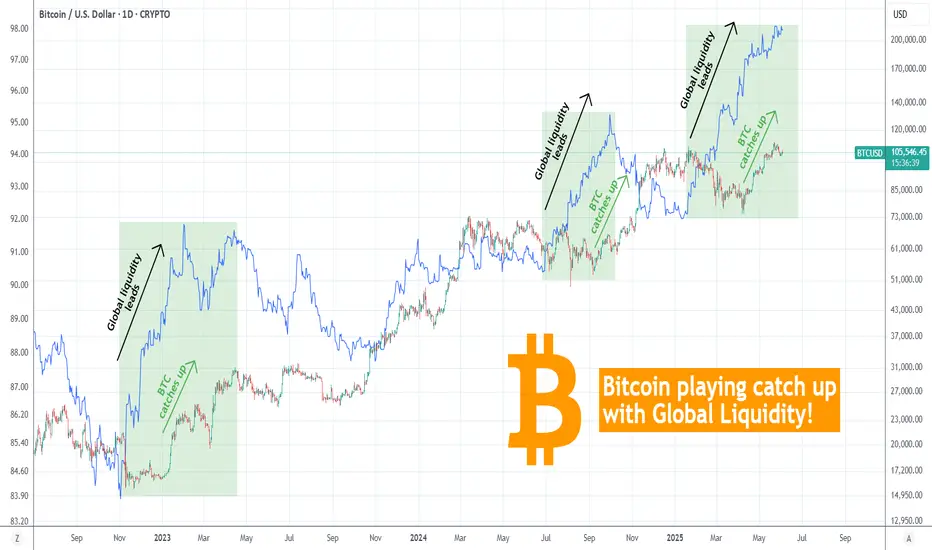
BITCOIN Will it catch up to the rising Global Liquidity again?Bitcoin (BTCUSD) is attempting to stage yet another short-term rally on its Tariff War recovery Bullish Leg but the picture is even more interesting on the long-term.
This is a simple yet very powerful and explanatory chart where it shows that every time the Global Liquidity (blue trend-line) led the uptrend and started rising before BTC on this Bull Cycle (since the November 2022 bottom), BTC eventually caught up to the trend and closed the Gap.
This time Global Liquidity has been rising since the start of the year (early January) while Bitcoin only started to do so since April 07. Even if the Global Liquidity pauses here, Bitcoin still has the potential to continue rising irrespectively.
How high do you think this can go? Feel free to let us know in the comments section below!
-------------------------------------------------------------------------------
** Please LIKE 👍, FOLLOW ✅, SHARE 🙌 and COMMENT ✍ if you enjoy this idea! Also share your ideas and charts in the comments section below! This is best way to keep it relevant, support us, keep the content here free and allow the idea to reach as many people as possible. **
-------------------------------------------------------------------------------
💸💸💸💸💸💸
👇 👇 👇 👇 👇 👇
BTC Massive Drop from 118K to 50K! As you can see i hope weekly Elliot wave will complete in around 118K to its highest price and then may start a correction wave as ABC weekly so that BTC Price could reach to 50K!
$BTCUSD - DIP INCOMING *I don't place trades based on trend lines but just act as a guide of how price action behaves.
Diagonal trend line which supported price on the way up is now broken and currently being tested as resistance.
That being said price is holding up pretty well as the MA is acting as a support which will be my trigger to go SHORT if broken. Add to that the weekly open resistance confluence and 100K retest is the first Short target and if markets overreact which they normally do then sub 89K is not off the books.
Stay safe
BTC RESISTANCESMight have some reaction when the levels got hit. Let's see and review it in the future.
based on just price level and price reactions