BTCUSD.PI trade ideas

How Low Will Bitcoin Go?How Low Will Bitcoin Go? Bitcoin support levels and their likelihood of being retested.

Bitcoin Trading RangesBitcoin Trading Ranges over the past few years and the different breakouts and breakdowns.

Is it A Good Time To Buy Bitcoin? Is it A Good Time To Buy Bitcoin? (based on its extension from the 200W MA)


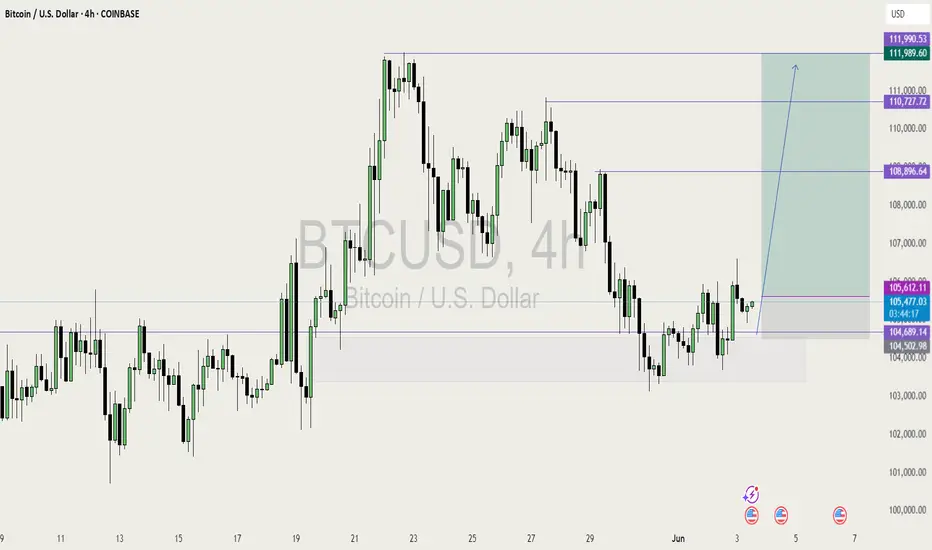
Technical Analysis BTC/USD (4h) – Potential Bullish Scenario
Rebound from Local Support (~105,000 USD)
The price reacted to a key support level and is showing early bullish candles, suggesting a possible continuation of the upward trend.
WT_LB Oscillator (WaveTrend)
Currently in the oversold zone and starting to curl upward – a typical early buy signal.
Medium-Term Trend Still Bullish
The recent pullback hasn’t broken key market structure – likely just a profit-taking phase before another leg up.
Structure of Higher Highs and Higher Lows (HH-HL)
The chart continues to show a bullish structure, and the current consolidation may serve as a base for an upward breakout.
⚠️ Trade Setup:
Entry: ~105,460 USD
Take Profit (TP): ~116,265 USD
Stop Loss (SL): ~102,249 USD
Risk-to-Reward (R/R): Approximately 1:3 – favorable setup.

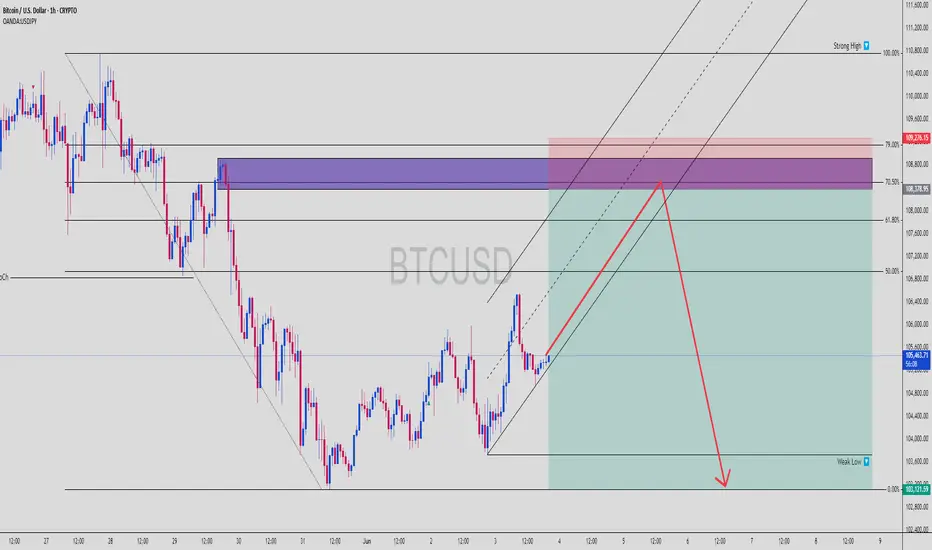
BTCUSD Bear Trap Loading – Premium OB Sell Setup ActivatedBTCUSD | 1H Smart Money Rejection Play – Premium Repricing Before Breakdown
The king of crypto is looking shaky. Smart money isn’t buying the pump. Here’s why BTCUSD might be gearing up for a steep dump from a premium order block reaction 🩸👇
📌 1. Market Context:
After a clean bearish leg, BTCUSD is now retracing into a premium zone — above the 70.5% Fib
Price is climbing into a high-probability reversal OB (highlighted in purple/red)
This area aligns with the 70.5%–79% golden retracement zone — where institutions love to load shorts 🧠📉
💎 2. Key Levels to Watch:
🔺 Premium OB Zone (Sell Zone): 108,378.95 – 109,276.15
🟣 Golden Rejection Zone: Fib 70.5% – 79%
🔽 Target Weak Low: 103,121.59
⛔ Invalidation/SL Above: 109,276.15
🎯 RR Potential: 1:4+ sniper-grade
Price is expected to tap this premium zone, sweep liquidity, and collapse into the weak low for a full market cycle completion 🔁
🧠 3. Smart Money Flow:
This move smells like a liquidity grab trap – taking out late longs before a drop
No bullish BOS from HTF – market structure still bearish
OB overlaps with inefficiency (FVG), making it ripe for rejection
Strong high is intact — unbroken = more confluence for downside
🎯 4. Execution Strategy (Entry Tips):
⚔ Wait for:
M5–M15 shift in structure (BOS) from bullish to bearish inside the OB
Sharp rejection wick or engulfing candle for confirmation
Ideal entry = wick entry near 109.2 with tight SL just above OB
Target = weak low for full mitigation and profit harvesting
This is surgical precision territory. The sniper must be patient before pulling the trigger 🥷
🔥 5. Why This Short is GOLD:
✅ OB + Fib + FVG confluence = high-odds reversal zone
✅ Price is in premium – not discount = perfect for shorts
✅ Weak low = magnet
✅ No bullish confirmation = no reason to long
This is not a guess — this is the blueprint for institutional execution 📐
📉 Drop “BTC Dump Mode 🚨” in the comments if you’re watching this setup too
🔁 Save this setup for your playbook
⚔ Follow @ChartNinjas88 for more institutional-level trade ideas like this one
BITCOIN Is this even a possibility?Bitcoin (BTCUSD) is currently on a short-term pull-back, following the impressive rally to new All Time Highs (ATH) from the April 07 bottom. This first 'serious' short-term relief correction has stopped on the former Lower Highs trend-line, which previous acted as a Resistance and is now holding the price from further downfall, acting potentially as Support.
This is the exact same price action that BTC had during its break-out from the previous Lower Highs trend-line last October. The symmetry between the two fractals is remarkable as not only did they both form their 1D Death Cross patterns on their bottoms and their 1D Golden Cross patterns on the Lower Highs break-out but also their Phase 1 rallies (1st Bullish Leg) have been exactly the same: +49.58%.
As a result, as long as the Pivot holds, there is a good chance we see a strong rebound, which if it holds the same total symmetry of the previous fractal, it should peak at +120%, which gives a $164000 Target.
Do you think that's even a possibility? Feel free to let us know in the comments section below!
-------------------------------------------------------------------------------
** Please LIKE 👍, FOLLOW ✅, SHARE 🙌 and COMMENT ✍ if you enjoy this idea! Also share your ideas and charts in the comments section below! This is best way to keep it relevant, support us, keep the content here free and allow the idea to reach as many people as possible. **
-------------------------------------------------------------------------------
💸💸💸💸💸💸
👇 👇 👇 👇 👇 👇

BTCUSD 6/3/2025We may be encountering another Daily push to the upside before encountering the Weekly Bearish Retracement.
_SnipeGoat_
_TheeCandleReadingGURU_
#PriceAction #MarketStructure #TechnicalAnalysis #Bearish #Bullish #Bitcoin #Crypto #BTCUSD #Forex #NakedChartReader #ZEROindicators #PreciseLevels #ProperTiming #PerfectDirection #ScalpingTrader #IntradayTrader #DayTrader #SwingTrader #PositionalTrader #HighLevelTrader #MambaMentality #GodMode #UltraInstinct #TheeBibleStrategy

BITCOIN LONG TRADE IDEAI'm looking forward to buying BTC in this price level if I see a good bullish price action which confirm my trade idea.
Market structure on 4HR is currently bullish.
Looking at the monthly and weekly time frame, BTC is extremely bullish and it's clear that BTC is not done with it's bullish run.
I expect to see BTC give another good run to the 120k-150k price level
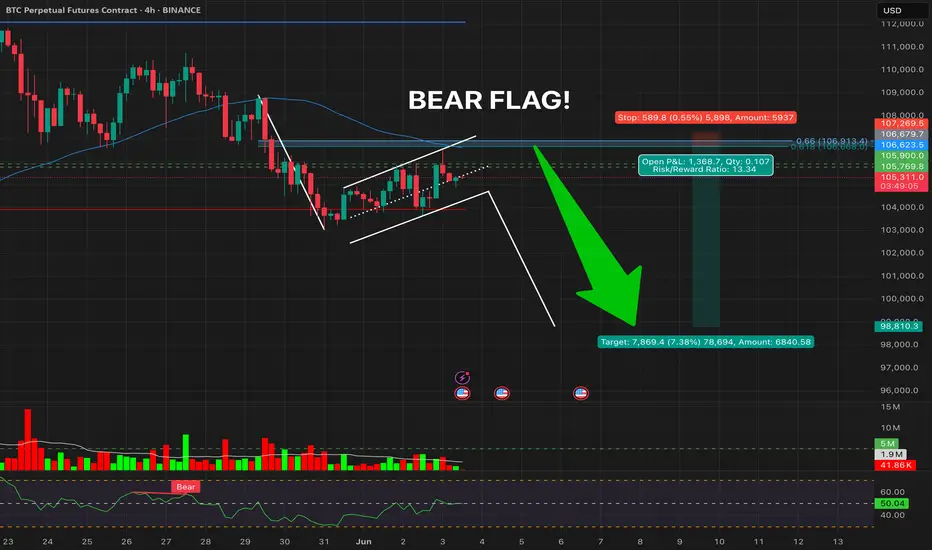
BTCUSDT – Bear Flag Breakdown Imminent?Price is forming a textbook bear flag following the sharp drop from ~108.8K.
The structure shows rising lows in a tight channel, typically a pause before further downside.
📉 Bear Flag Anatomy:
Breakdown support: ~104,000
Measured move target: 98,810
RSI: 49.94 — hovering just below neutral, watch for dip <40 for breakdown confirmation.
Volume: Still low — waiting for a spike to confirm supply pressure.
🧨 Trigger Conditions:
4H close below flag support
RSI < 40
Volume spike above 20-bar average (~1.96M)
🎯 Short Plan:
Entry: Rejection from the fib golden pocket or flag support breakdown
TP: 98,800 (pattern target, confluence with prior support)
🔍 If confirmed, this breakdown could mark the start of a Phase E markdown in Wyckoff terms.
💬 Let me know your thoughts below — are you shorting this flag or expecting a fakeout?
#BTC #Bitcoin #CryptoTrading #BearFlag #ShortSetup #Wyckoff #PriceAction #4HChart
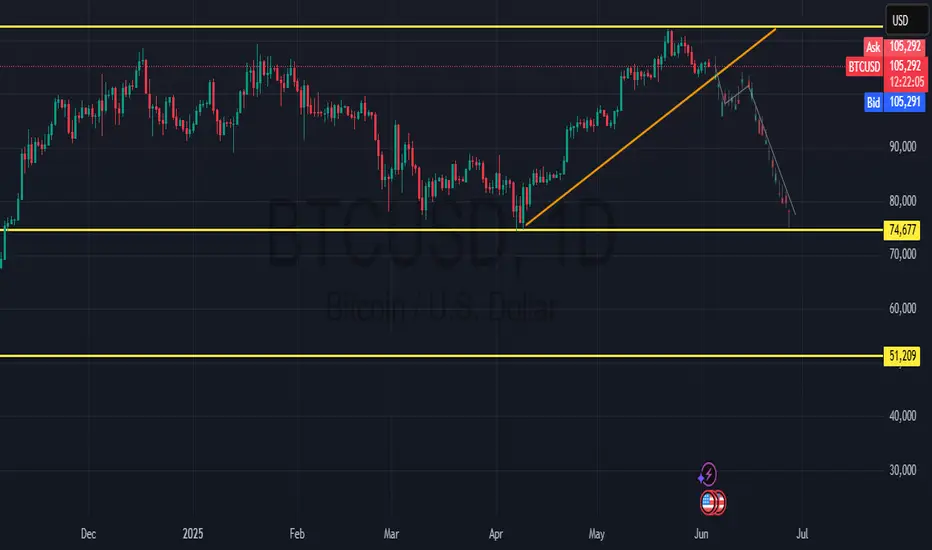
shortGood Morning judging from my view, we are going to get a possible break out for a retest a sell all the down to 76,900
BTC at Make-or-Break: Rejection or Liftoff to $130K?
Bias/Summary
BTC is at a critical zone between 109K–112K. Price is currently showing hesitation after initial rejection at the Yearly L3 (112K), and I’m leaning short unless we see a strong breakout and hold above that level. However, if bulls reclaim it, we could see a fast move to 130K before many can react.
Technical Context:
Yearly L3 sits around the $112K zone – a historically significant level.
Price faced rejection at $112K and is now hovering near $109K.
Lower timeframe showing indecision, possible bearish bias.
Watching for:
Rejection + lower high below $112K = short setup.
Clean breakout + retest of $112K = shift to long bias.
Trade Idea / Setup:
🟥 Scenario A – Short Bias (Current Leaning):
Entry: 110K–111.5K (if rejection confirms)
Stop Loss: Above 112.5K
Targets:
TP1: 104K
TP2: 99K
TP3: 94K
R:R: Up to 3.5:1 depending on entry and target
🟩 Scenario B – Breakout Long (Contingent Setup):
Entry: 113K+ (after breakout and solid retest)
Stop Loss: Below 111K
Targets:
TP1: 120K
TP2: 130K
R:R: ~3:1 or more if momentum confirms
Risk & Patience Reminder:
⚠️Let price lead. No breakout = no long. No clear rejection = no short. Wait for confirmation, and don’t force entries in the chop.
Patience > Prediction.
NFA. DYOR. Manage your risk.

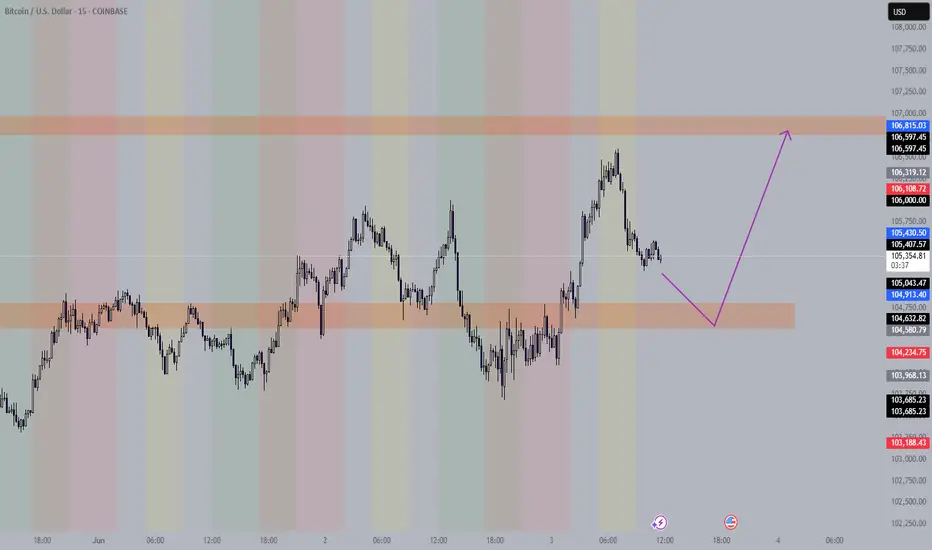
BTCUSD Approaching Support Trendline | Potential Bullish ContinuBitcoin (BTCUSD) is showing a potential bullish continuation pattern on the 15-minute chart. Price is currently near a rising trendline support, with a possible bounce forming. The projected move suggests a strong upside if the support holds. Key levels to monitor include the recent low around 104,773 and upside target near 107,000. The setup indicates a favorable risk-reward structure. This is a technical analysis perspective and intended for charting reference.

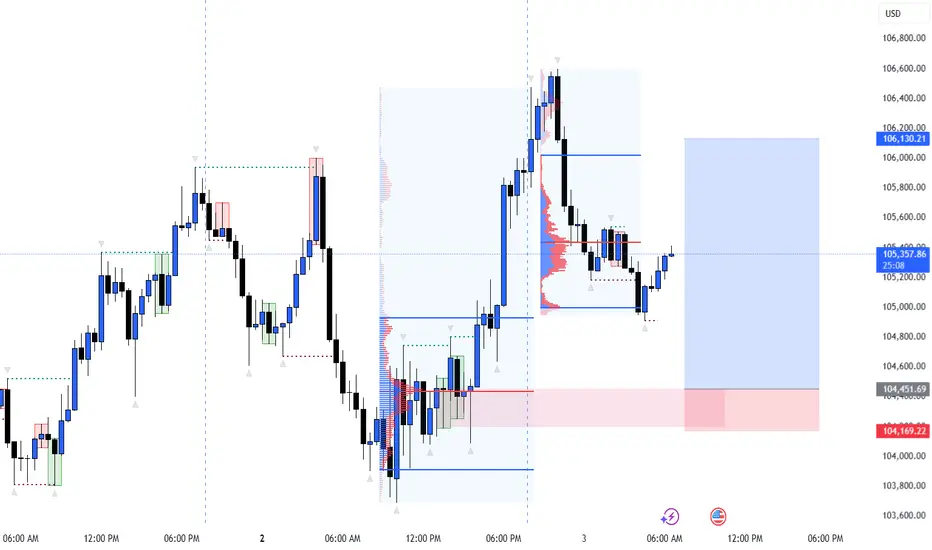
BTCUSD IS BULLISH BUT TRUMP MIGHT SPOIL IT, BEWARE!🧠 Context:
We’re looking at BTCUSD after a textbook liquidity sweep, demand zone reaction, and clear structure shift. This chart beautifully displays institutional order flow, giving us a high-probability long setup.
🔍 Detailed Breakdown:
✅ 1. Liquidity Sweep & Demand Reaction:
Price made a sharp move downward into a previous demand zone (marked red).
The move into 104,169–104,451 region swept sell-side liquidity resting below previous lows.
The strong bullish engulfing candle from that zone confirms mitigation of a bullish order block.
🔁 2. Break of Structure (BoS):
Post-demand tap, BTC broke above a minor supply structure, forming a higher high.
This is our confirmation of a short-term bullish market structure shift.
🎯 3. Entry Setup:
Price retraced slightly after the break of structure and appears to be forming a higher low.
Current price is around 105,309, a potential entry for longs.
🧱 4. Target Zones:
TP1: 105,800 – fill inefficiency zone
TP2: 106,130.21 – supply zone / previous high
SL: Below demand zone (~104,150) — below OB and liquidity sweep
🧊 5. Volume Profile Insight:
High volume node concentrated at the lower consolidation, signaling accumulation.
Price is now trading above POC, supporting a bullish continuation narrative.
🧭 Conclusion:
This BTCUSD setup shows classic Smart Money reversal mechanics:
✅ Liquidity grab
✅ Order block tap
✅ Structure break
✅ Volume confirmation
📈 Bias: Bullish
🎯 Long targeting 106,130
🛑 SL below 104,169
🔔 Manage risk and monitor lower timeframes for confirmation. BTC has room to run, but always watch reaction at key zones.
BTC Educational Idea by 1PercentFundedBTC Update : These are the possible scenarios for BTC based on 2021
Scenario A. BTC rejects 108/109k (Purple Arrow) & retest 98k (High Probability)
Scenario B. BTC retest 110/111k (Black Arrow) & creates a double top before dumping to 88/98k
Our team will be building shorts at 108k onwards & will add if 111k is given. 117.5k invalidation.

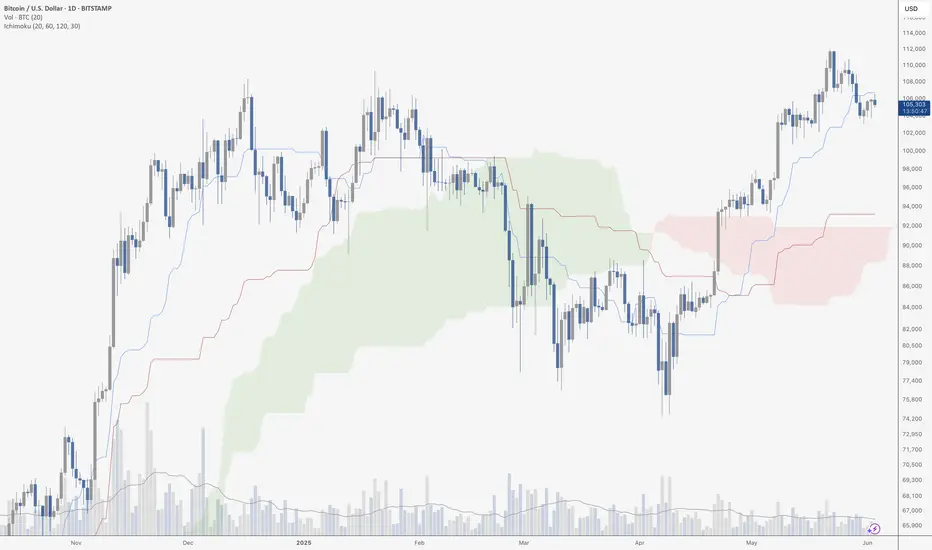
Bitcoin Loses The TenkanToday, I’m revisiting the Ichimoku Cloud system – a tool I used extensively in the past and still find incredibly useful for adding context to market structure. While I don’t use it as a primary system these days, it’s a fantastic way to gain a different perspective on price action, trend strength, and key support/resistance areas. The Ichimoku system, at its core, helps traders see the bigger picture at a glance by combining several indicators into a single, cohesive framework.
Looking at Bitcoin’s daily chart through this lens, we see that the price has lost the Tenkan-Sen as support. The Tenkan-Sen – or conversion line – acts as a dynamic gauge of short-term momentum, and losing it can be a warning sign that momentum is stalling. The next logical level to watch is the Kijun-Sen – or baseline – which sits in the 94,000–95,000 range. A test of this level would align with a potential period of consolidation or pullback unless Bitcoin can reclaim the Tenkan-Sen quickly.
It's also worth noting the Kumo twist – a shift in the color of the cloud from red to green – which signals a potential change in the longer-term trend bias. This is typically viewed as a bullish sign, especially when price is above the cloud itself. However, the Kumo twist alone isn’t a buy signal – it simply tells us the trend bias is starting to shift, and we still need price to hold above key support levels to confirm it.
Overall, while the cloud remains bullish with price above it and the Kumo twist suggesting a shift in sentiment, losing the Tenkan-Sen is a yellow flag. It’s not a full reversal signal, but it does suggest caution in the short term. If Bitcoin can hold above the Kijun-Sen and reclaim the Tenkan-Sen, the uptrend remains intact. But if we see a deeper move into the cloud, that could signal a more prolonged consolidation or even a correction.
This isn’t a forecast – just a reminder to stay balanced, challenge our own biases, and use different tools to see the market from multiple angles.
CRYPTO Updated Analysis! BTC is showing HTF weakness...This purple BTC algorithm proving itself beautifully on the buy-side has definitely increased my short conviction for the near term. I am shorting this for the time being at least until we prove a strong higher time frame buying algorithm like yellow prove itself. Otherwise, I am looking for a break of yellow and a proof of HTF purple - which would almost certainly lead to a $60,000 liquidity hunt as we saw back in 2021.
Stay cautious and let the algorithms guide you - both on the higher time frame and lower time frame.
Happy Trading :)

BTCUSD Analysis Using MMC – Bearish Rejection & Target🔷 Introduction:
Bitcoin is showing classic Market Maker manipulation at work—volume compression, false breakouts, support-resistance flips, and a fading rally under a well-defined descending curve.
This post offers a deep dive into the true intentions of smart money behind recent price actions, helping traders avoid traps and align with institutional moves.
🔎 Detailed Breakdown of Chart Structure:
🧱 1. Volume Contraction Zone – The Calm Before the Storm
📅 Period: May 13–18
Price consolidates within a symmetrical triangle pattern.
Volume steadily decreases as price tightens – a sign that market makers are accumulating positions while keeping volatility low.
This low-volume phase creates uncertainty for retail traders, shaking out weak hands and building a base for a deceptive breakout.
🔍 MMC Insight: Market Makers reduce volatility to absorb liquidity without alerting the market to their accumulation. This builds energy for a manipulated move.
📌 2. False Breakout to Previous Target Zone (~$110,000)
📅 May 20–23
A sudden bullish impulse takes price to the previous target zone, marked as a key area of historical liquidity.
Retail traders enter late long positions at this stage, anticipating further breakout.
🎯 But instead:
Price swiftly rejects from this level, forming long upper wicks and bearish engulfing candles.
This move is a liquidity sweep, where smart money offloads positions to late buyers.
🔍 MMC Insight: Institutions engineer a breakout to bait traders, only to dump into the momentum they create.
🔁 3. SR Interchange (Support Flips to Resistance)
📅 May 27–June 2
Former support around $104,000 – $105,000 is broken and then retested from below.
Price attempts to reclaim it, but fails—each touch results in rejection.
This confirms the area has flipped to resistance, aligning with MMC’s SR Interchange Rule.
📉 Significance: This zone now acts as a control point where market makers defend short positions.
🚫 4. Candle Rejection Area – Curved Trendline Resistance
A visually defined curved resistance line caps each rally, suggesting consistent seller presence.
Recent candles show clear rejection wicks and small-bodied candles at this level—classic distribution behavior.
Market is compressing under this trendline, hinting at an imminent breakdown.
🔍 MMC Insight: Curved trendlines show passive sell pressure where institutions repeatedly cap price in preparation for a drive lower.
📉 5. Next Target & Volume Burst Area: $101,000 – $102,000
This zone is crucial due to:
Presence of imbalance (inefficiency) left from previous bullish moves.
Likely stop loss clusters from retail long traders.
Historical high-volume node suggesting pending revisit for order rebalancing.
🟨 Yellow Zone = Volume Burst Area: Expected to act as a magnet for price due to liquidity concentration.
🧠 Psychology of the Trap:
📈 Retail Bias: “Bullish triangle breakout means more upside.”
🧠 Institutional Plan: “Use that belief to create exit liquidity, then reverse.”
This is textbook MMC manipulation:
Contract volume to build positions.
Break out to bait liquidity.
Reverse at supply.
Sell into rejection zones.
Trap traders at SR flips.
Drive price to reclaim liquidity at lower targets.
📊 Strategy Plan:
🔻 Bearish Bias Setup:
Entry Zone: $105,200 – $106,000 (candle rejection area)
SL: Above $106,800 (above supply curve)
TP1: $103,000
TP2: $101,000
TP3 (optional): $99,000 for deeper flush
🔁 Flip Bullish if:
Price reclaims $107,000 with momentum and closes above the curve.
Watch for volume confirmation and bullish SMC patterns (e.g., BOS + FVG fill).
⚠️ Risk Management & Notes:
Trade with 1–2% max risk per position.
Let confirmations play out (don't preempt rejection).
Watch U.S. data releases this week (highlighted on chart) – potential volatility triggers.
📌 Conclusion:
Bitcoin’s current behavior is a masterclass in market structure manipulation. Understanding MMC lets us:
Avoid false breakouts
Align with institutional intentions
Trade with probability, not emotion
Expect lower prices unless $106,800 is cleanly broken. The path of least resistance currently points downward toward liquidity zones.

BTC Upside ScenarioAfter a Little long Analysis i get this point now it's up to you i don't want to say buy or sell, you are the responsible of your own actions, but i share my perspective, be consistent on your plan if you don't have any or you don't know much so hit me up...
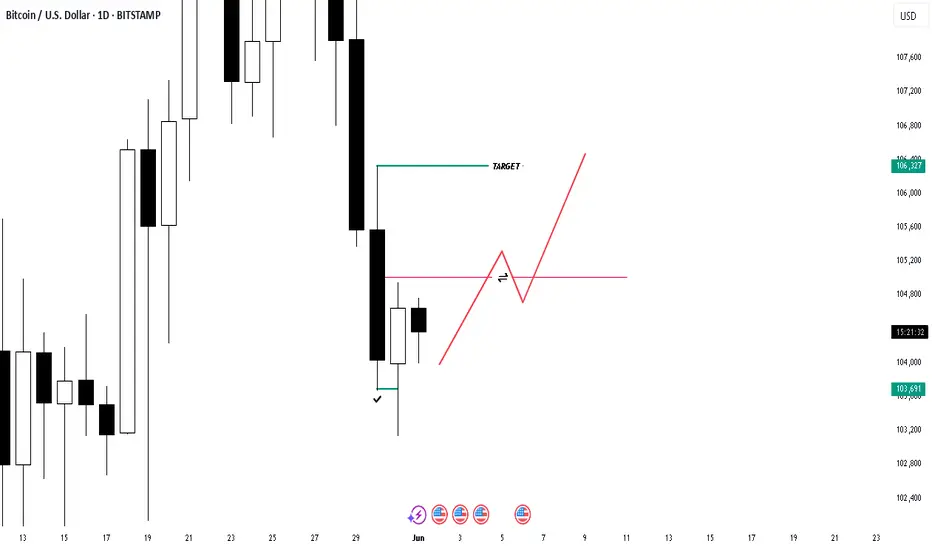
BTC PULLBACK Price is rejecting 30 May 2025 price.
Indicate rally as pullback targeting 106327.
equilibrium 30/5/25 is 105015
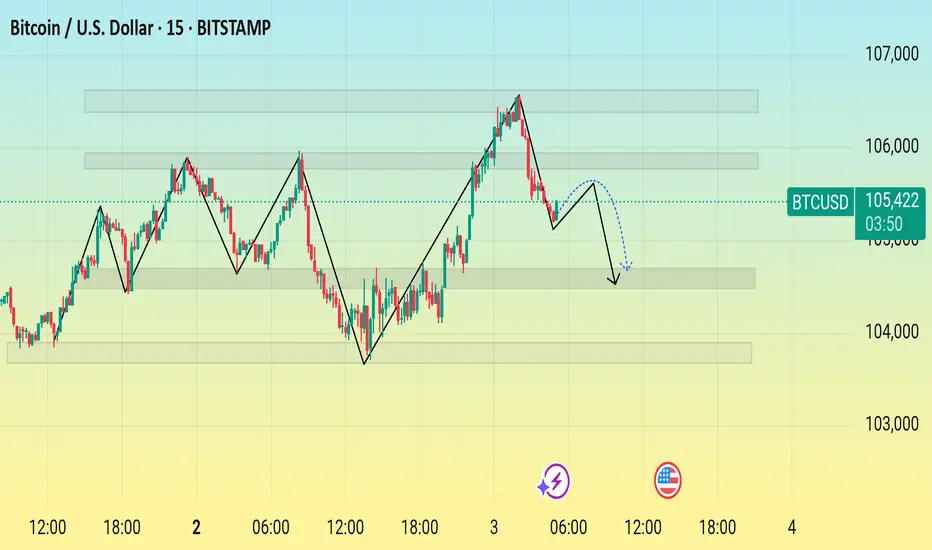
Bitcoin Price Action Forecast – June 3, 2025Recent market structure and a potential bearish move. After a peak near 107,000, Bitcoin has started a downward trend. The projection suggests a minor pullback before continuing lower toward the 104,000–103,500 support zones. Traders may watch for confirmations before entering positions.
81 kThis channel is not providing individualized trading or investment advice, nor is it a banking service, brokerage service, trading service, investment service or money management
