BTCUSD SMC Short Play | Fair Value Gap Rejection Ahead?Bitcoin (BTCUSD) Smart Money Sell Opportunity | Liquidity Sweep Setup
Here’s a surgical-level BTCUSD bearish setup unfolding on the 30-minute chart, giving pro traders and learners a textbook SMC opportunity. Let’s break it down:
🔍 1. Trade Idea Summary
This move is a retracement into a premium zone, reacting off a:
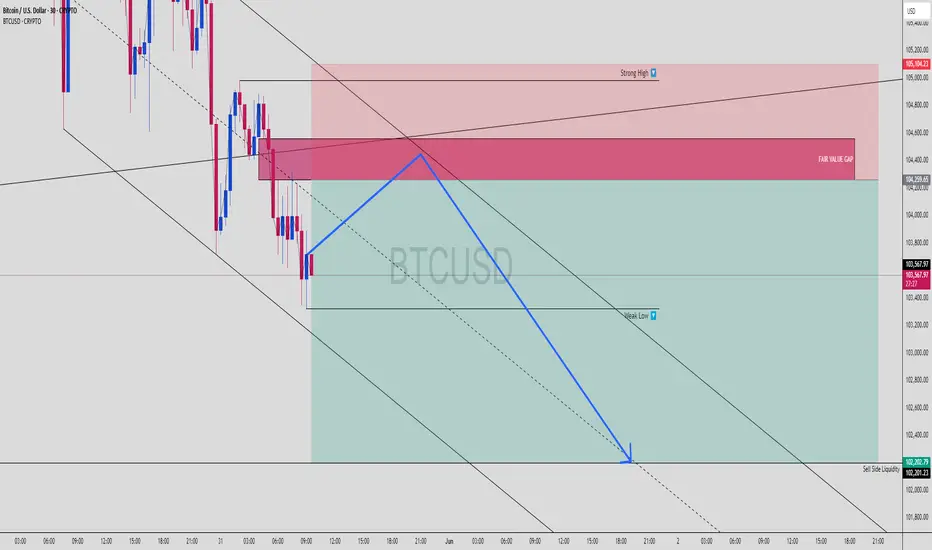
✅ Fair Value Gap (FVG) between ~104,300 and 104,600
✅ Strong High at ~105,100 acting as liquidity
✅ Perfect Sell-Side Liquidity Target at ~102,200
Expecting a short retracement play with a clean 1:4+ RRR.
📊 2. Key Zones Marked on Chart:
FVG Zone: 104,259 – 104,600
Strong High (Liquidity Trap): 105,104
Entry Zone: Watch rejection inside FVG or after sweep of Strong High
TP Zone (Sell Side Liquidity): 102,200
SL: Above 105,200
🧩 3. Smart Money Logic Behind This Setup:
Price is in distribution phase, moving within a descending channel
Impulse down created imbalance (FVG) ➝ market now retracing to fill it
Expecting:
Liquidity grab above recent highs
Rejection from FVG zone
Strong push down toward sell side liquidity
⚙️ 4. Trade Execution Plan
Wait for price to enter FVG
Look for:
M5/M15 CHoCH (Change of Character)
Bearish OB or breaker block for sniper entry
Target liquidity zone marked on chart
Trail SL once price breaks below 103,000
📉 5. Market Bias + Risk Tip
HTF Bias: Bearish
Mid-Term Target: 101,800–102,200
❌ Don’t jump early — wait for structure break or FVG reaction
📍 Drop a “🔥” if you’re learning
🧠 Comment “SMC ENTRY” if you caught this setup
📲 Save for later & follow @ChartNinjas88 for daily breakdowns
BTCUSD.PI trade ideas
BTCUSD Trendline Trap? Smart Money Short at FVG
🔍 1. Trade Idea Summary
Trendline gets violated ➝ retail panic
Price retests Fair Value Gap at a premium level
Confluence:
✅ Trendline break liquidity
✅ FVG mitigation
✅ Bearish order block zone
✅ Lower high structure formation
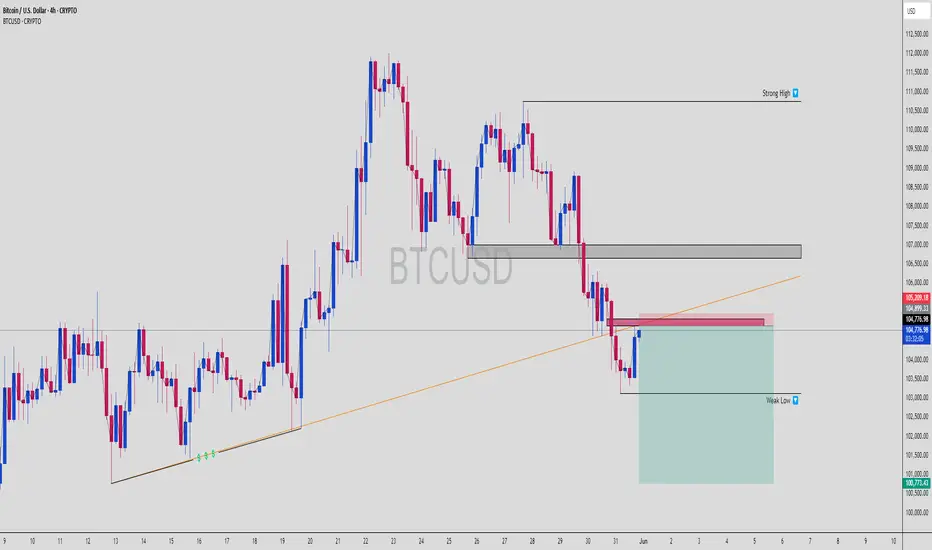
Targeting the weak low sweep around $100,773.
📊 2. Key Chart Levels
Entry Zone: $104,800 – $105,200 (FVG)
Stop Loss: Above $105,209
Take Profit: $100,773 (Weak Low / Sell-side liquidity)
RR: ~1:3+, textbook sniper setup
🧩 3. Smart Money Concept Breakdown
Trendline Break = Liquidity Grab
Price taps into a premium zone FVG + OB
Expecting:
Rejection candle formation
Lower time frame BOS
Sell-side liquidity target @ weak low
This is a setup you can replay again and again — pure institutional footprint.
⚙️ 4. Execution Plan
Monitor retest reaction near FVG zone
Look for M5 or M15 bearish BOS/CHoCH
Refine entry on confirmation
Lock partials near midpoint, TP at weak low sweep
⚔️ 5. Pro Tips:
Trendline breaks are often traps — always check where the liquidity hides
FVGs act like magnets — price often returns to fill the imbalance before real moves
Volume dying into FVG = 🔥 clue for rejection
📉 Comment "BTC Trap Sniper 🎯" if you saw this setup too
🔁 Save this chart for future reference
⚔️ Follow @ChartNinjas88 for more SMC breakdowns & fib-paired traps
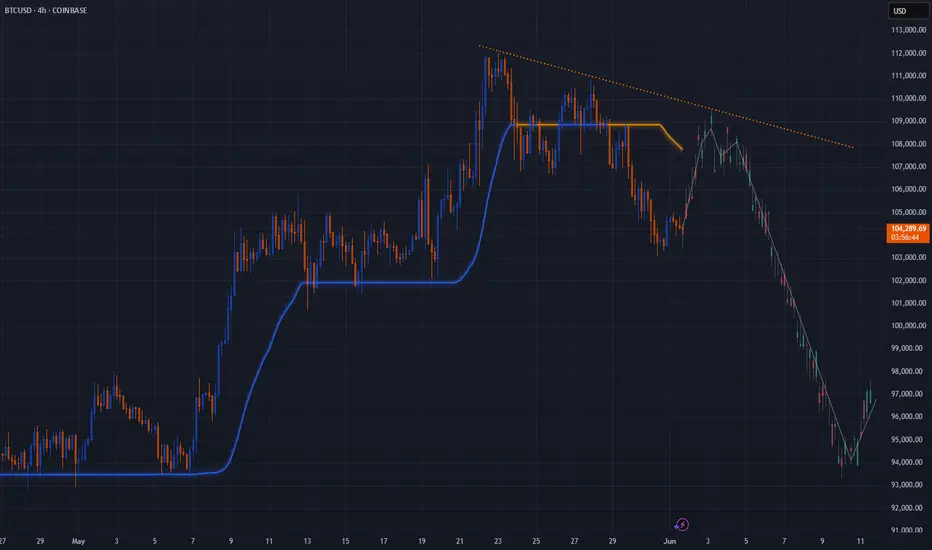
Bullish outlook for BTCUSDThe image shows a 4-hour candlestick chart for Bitcoin (BTCUSD) spanning from mid-2024 to June 2025. The chart includes technical analysis elements such as trendlines, support and resistance levels, and a potential ascending triangle pattern.
BTCUSD Entre point 103900 105500target 104900 stop loss 103100I think you meant to say the entry point is either 103,900 or 105,500. Assuming the correct entry point is one of these:
- Entry Point: 103,900 or 105,500
- Target: 104,900
- If entry point is 103,900 target looks like 1,000-point gain
- If entry point is 105,500 target looks like 600-point loss, which doesn't make sense given the target is supposed to be a gain. Given the numbers, let's assume the entry point is 103,900.
- Stop Loss: 103,100 (800-point risk)
Risk-reward ratio looks decent if entry point is indeed 103,900! Let's see how it plays out. What's your trading strategy behind this setup? Are you expecting a bullish breakout?
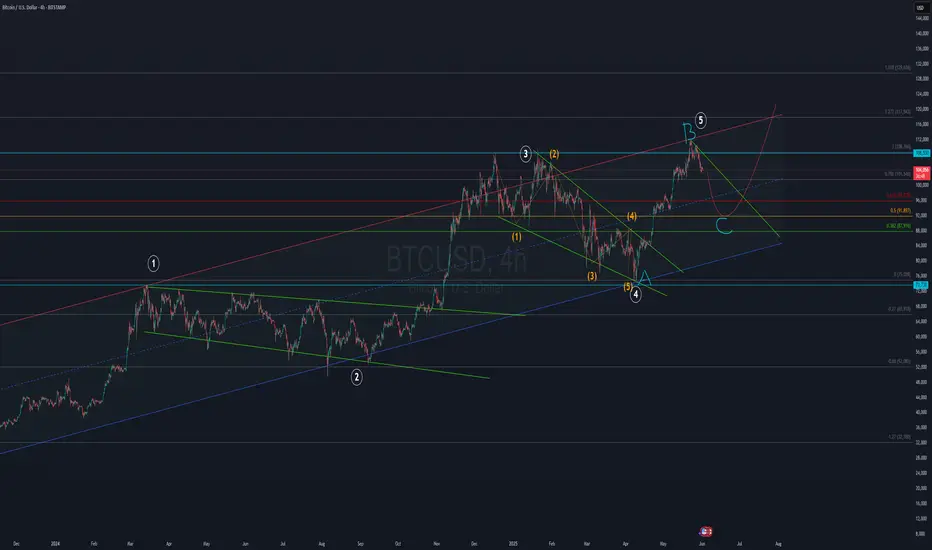
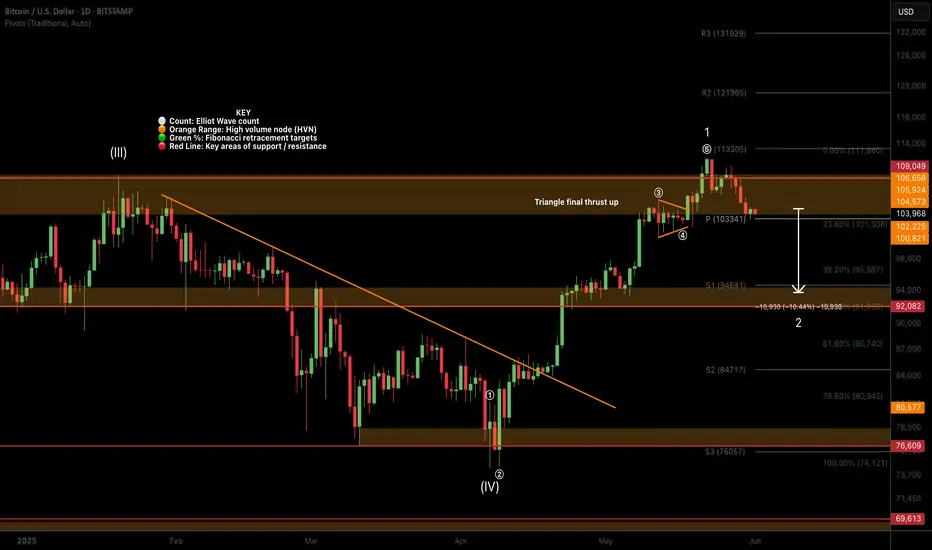
BTC (Daily) Elliot Wave 2 UnderwayBTC appears to have completed a motif wave (1) poking above all time high after printing a triangle for wave 4. Triangles are an ending pattern with a final thrust up afterwards typically breaking all time highs before reversing in wave 2, selling into retail FOMO.
Wave 2 has a $92k target at 0.5 Fibonacci retracement and high volume support node.
Wave 3 should be a powerful move up taking price way into all time high.
Safe trading
BTC/USD LongAfter creating the M Pattern I expect the market to go up to get more Liquidity before we see one more drop. When we go bullish, we would create a ABC correction, what would confirm it
BTC MAY CONTINUE LOWER WITH A WEEKLY CLOSE BELOW THE TRENDLINEI am of the opinion that BTC may continue with the downtrend. We are already seeing several daily candle closing below the trendline but the FVG is still not violated.
If the weekly candle closes below the trendline with an aggressive bullish candle and the next weekly candle closes below the FVG, then we should be ready for more downside probably back to the very origin of the current bullish run.
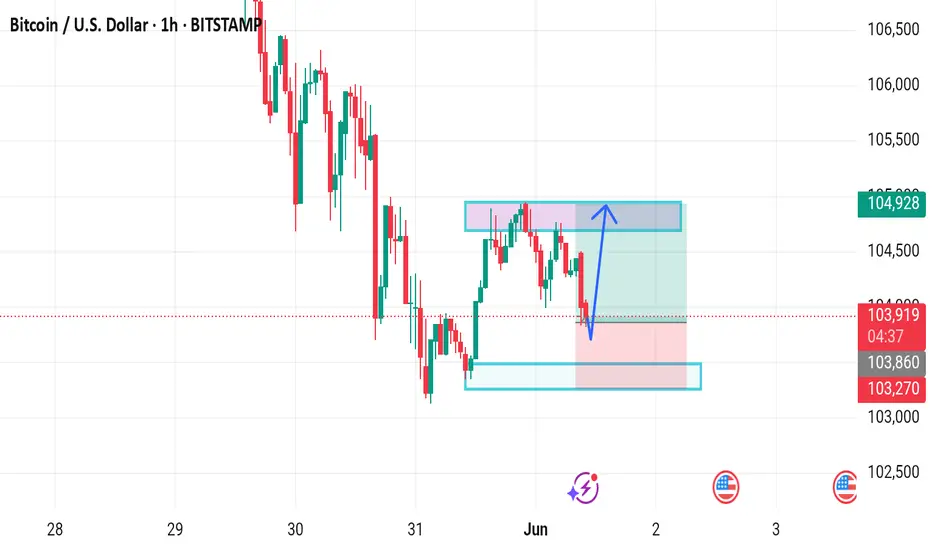
BTCUSD RetracemmentExpecting a temporary surge towards the upside on BTC price. Price should bounce from 103700 towards 105000 on this Sunday

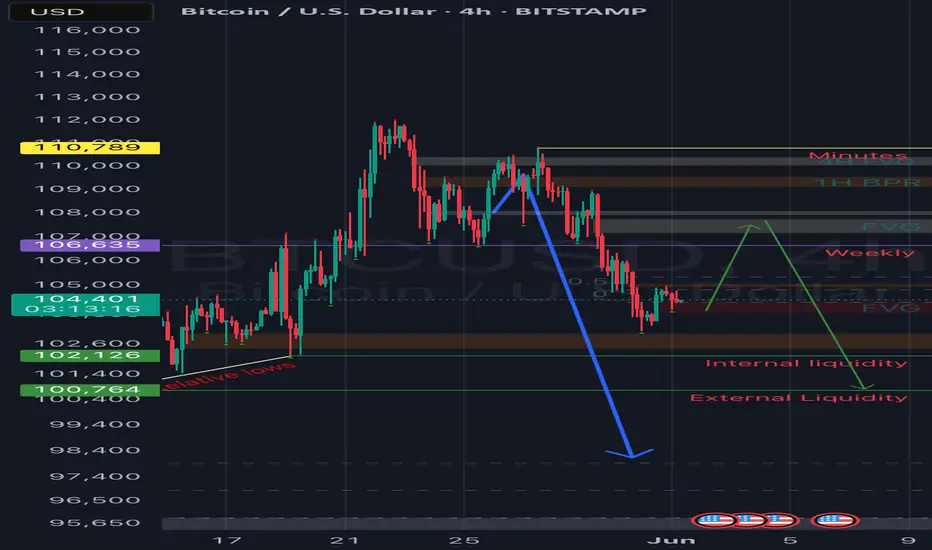
$BTC.X downside target 97000#Bitcoin recently has touched a new high and is reacting to a downside channel, which is perfectly aligned for a downside target of 97000

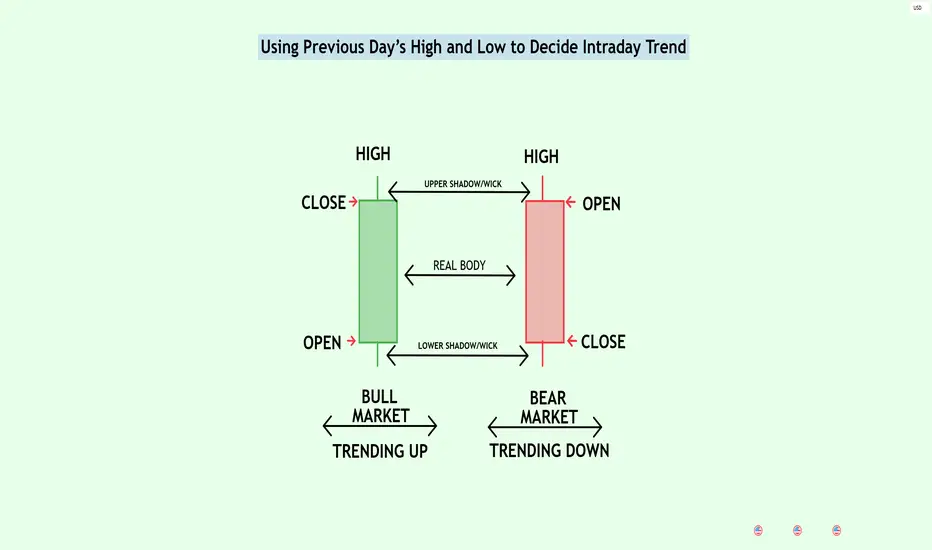
Using Previous Day’s High and Low to Decide Intraday TrendIntroduction and Disclaimer
This article explains how to use the daily chart to understand and plan for short-term or intraday market direction.
To fully understand this, you should already know what directional bias means. If you’re not familiar with it, I highly recommend reading my previous article on the topic before continuing here.
Disclaimer
I'm not a financial advisor.
This article does not offer financial, investment, legal, or any kind of regulated advice.
It's made for educational and entertainment purposes only.
Trading involves risk. You can lose all your money—or even more—if you’re not careful.
You're reading the thoughts of a 22-year-old.
The goal of this article is to show you how to use the previous day’s high and low on a daily chart to:
Get a clear intraday bias (bullish or bearish).
Find entry signals for your trades.
Set clear invalidation points, meaning when a trade idea becomes invalid.
This is part of what’s called multi-timeframe analysis—looking at higher time frames to understand what might happen on lower ones.
Even if you trade short-term (like on 5 or 15-minute charts), it's still helpful to know what the bigger picture (like the daily chart) looks like. Why? Because it shows the main trend, important levels, and key zones that may not appear on lower time frames.
In my opinion, smart trading involves breaking down the price chart from top to bottom—starting with the big picture—then making decisions based on your trading strategy.
The ideas in this article work well for:
Intraday traders who want to capture moves during the day, and
Swing traders who want to catch bigger moves by entering early.
This concept can also be applied to higher time frames, such as the previous week’s high and low.
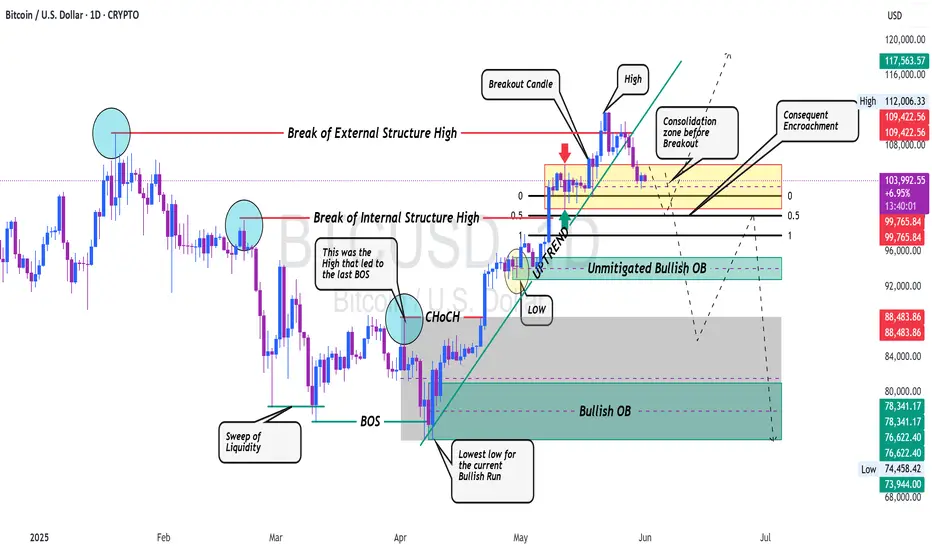
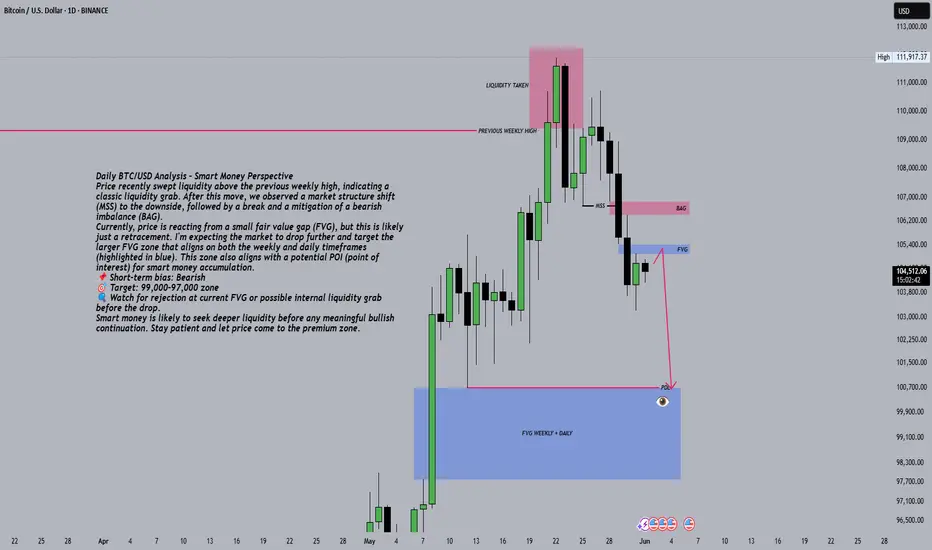
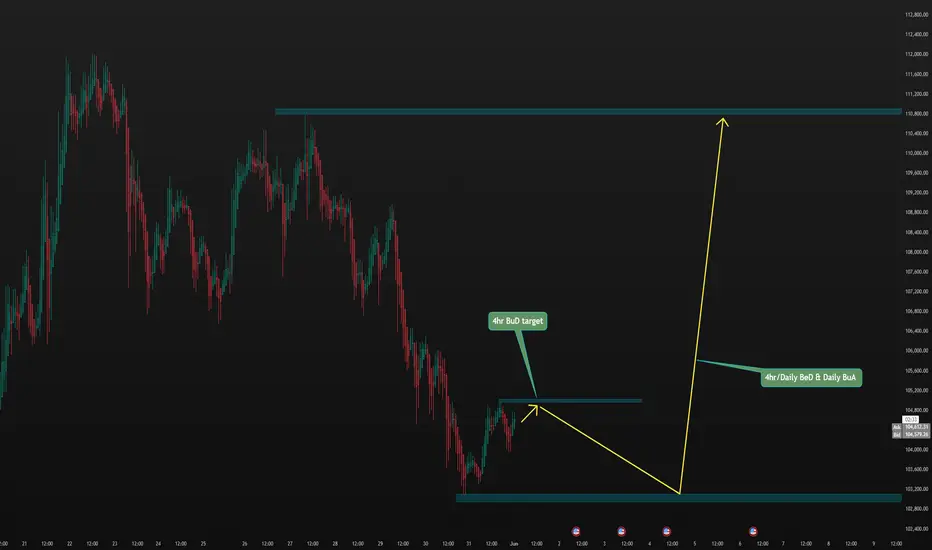
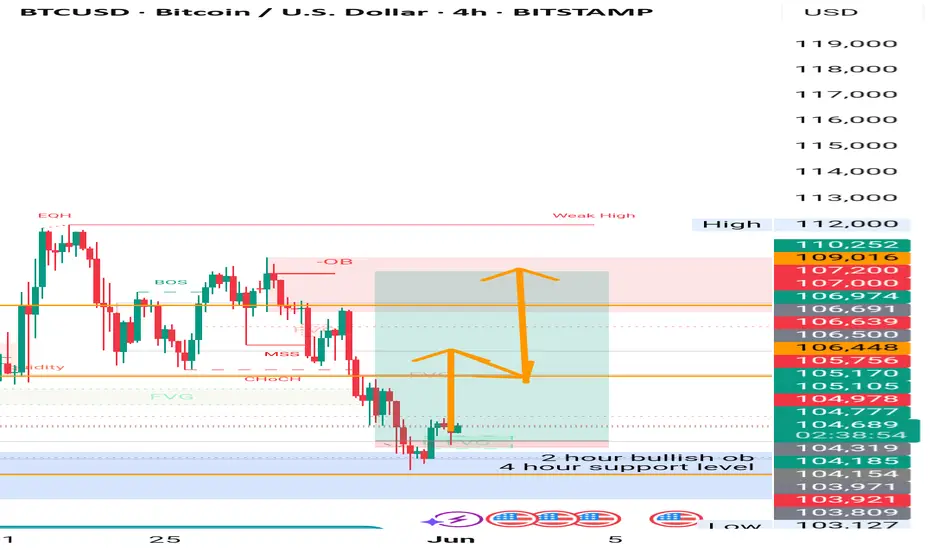
Daily BTC/USD Analysis - Smart Money PerspectivePrice recently swept liquidity above the previous weekly high, indicating a classic liquidity grab. After this move, we observed a market structure shift (MSS) to the downside, followed by a break and a mitigation of a bearish imbalance (BAG).
Currently, price is reacting from a small fair value gap (FVG), but this is likely just a retracement. I'm expecting the market to drop further and target the larger FVG zone that aligns on both the weekly and daily timeframes (highlighted in blue). This zone also aligns with a potential POI (point of interest) for smart money accumulation.
📌 Short-term bias: Bearish
🎯 Target: 99,000–97,000 zone
🔍 Watch for rejection at current FVG or possible internal liquidity grab before the drop.
Smart money is likely to seek deeper liquidity before any meaningful bullish continuation. Stay patient and let price come to the premium zone.
Final BTCUSD update..Good day traders, here is my final update on BTCUSD and I like how price has been respecting our PD arrays. Keep in mind traders price moving in waves and what again😂😂🏃🏾♂️, point is today is the last trading day for the week and my thoughts is that we can expect BTCUSD to start going higher today and tomorrow maybe till Tuesday …sorry I’m being too sure but if you focus on time and price you start to KNOW(ledge) things or maybe I should say secrets?!🤨🤔
I always expect price to manipulate higher if my bias is shorts, ICT’s power of 3 works wonders when it come to this thought process.
Watch how price reacts to the FVG where price is trading now, it’s not a signal just watch out price moves always from it for the rest of today.
We only going high to shoot lower…keep that in mind!!🤯
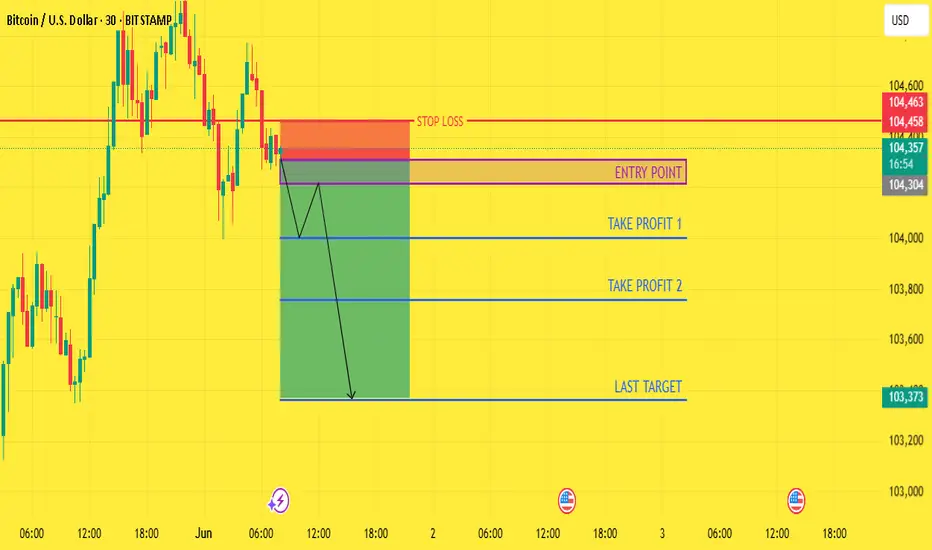
NEXT WEEK CHECK BTCUSD SIGNAL READ CAPTIONbtcusd) sell zone
( trade satup )
entry point (104308) to (104213) 📊
first tp (104000)📊
2nd target (103755) 📊
last target (103360) 📊
stop loss (104463)❌
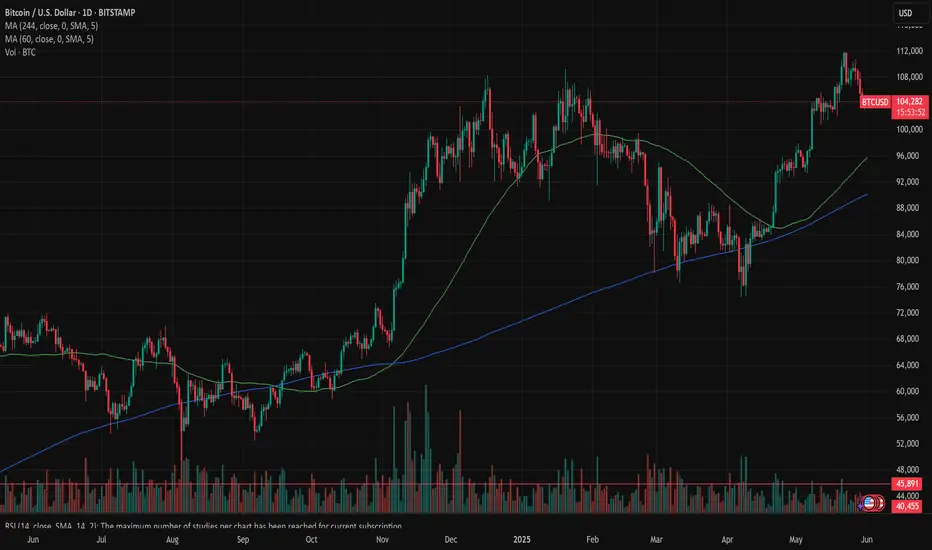
Bitcoin: eased on profit-takingAs expected, BTC eased a bit during the previous week. Two weeks ago, BTC celebrated its anniversary, so-called Pizza Day, with a fresh new all time highest level at $111,6K. After the strong push to the upside, it was expected that some profit taking would take place in which sense, the price of BTC will revert a bit. During Saturdays trading, BTC reached the lowest weekly level at $103,2K, but is ending the week above the $104K.
The RSI moved down from the strongly overbought market side, reaching the level of 50 as of the weekend. It is still not a clear indication that investors are eyeing the oversold market side, as long as RSI is moving above the 50 levels. The MA50 continues to strongly diverge from MA200, confirming further the golden cross occurred two weeks ago.
BTC recently returned to the levels from the beginning of May, and might spend some time testing these levels in the week ahead. This could imply movements between the $102K and $104K. Charts are pointing that the next historical support line is at $102K level, which easily might be tested in the week ahead. However, there is also equal probability for the short term reversal in the week ahead, where BTC might again shortly test levels around the $106K. Return toward the $109K is also possible, based on charts, but with a lower level of probability.
It's not the time for Bitcoin...yet.
BTC rose by 6% during Bitcoin 2024 with the presence of Trump.
This year, it has disappointingly sunk by 4% during Bitcoin 2025.
I have come to the conclusion that BTC will make one final attempt to reach 108k and then failing to keep up with the momentum, plummet towards 93k.
Institutional participation has been spectacular this year as shown with all the huge amounts of purchases, but something crucial to a continuation of momentum has been lacking thus far: retail investors. Without their participation, it's impossible to reach to the moon.
So much BTC has been purchased in whopping amounts, but BTC has only appreciated 3k from the previous ATH of 108k. It needs to go lower first before the actual lift-off can become possible.
Why BTCUSD could Drop down 90,000BTCUSD created new Highs 2 weeks ago (almost 112,000). Last week, it created a new LH and bearish engulfing pattern. Sellers took over and the odds it will continue to drop down to 90,000 as a form of correction is highly probable.

BTCUSD Weekly Structure Analysis – Bearish Trend + Target🔍 Overview:
Bitcoin has shown us a classic market structure shift, moving from bullish strength into a clear bearish retracement, all while respecting major zones and smart money concepts. This current price action highlights a Bearish Break of Structure (BOS), followed by a continuation move toward a key demand zone, which we are eyeing for the next potential reversal opportunity.
🧩 1. TRC Breakout & Early Bull Run
The chart shows a strong bullish phase starting from November 2024, which peaked in late May 2025.
The TRC (Trendline Resistance Channel) Breakout marked the shift from lower highs to higher highs.
This breakout was the initial sign of bullish strength, leading to a break of structure (BOS) around the $108,000–$110,000 level.
⚠️ 2. BOS Confirmed – Structure Starts to Crumble
Once price reached the reversal area near $112,000 (supply zone), we saw a failure to form new highs.
The Bearish BOS was confirmed when price failed to hold support and aggressively broke below the previous higher low.
This BOS is our first confirmation of trend exhaustion and a transition into bearish structure.
🧠 3. Structural Analysis & Smart Money Behavior
Notice how price moved sideways near the top before dropping — a typical distribution phase.
This is where smart money distributes positions to retail buyers at the top before the markdown.
After the BOS, each lower high confirmed the bearish market structure, with no strong bullish CHoCH in sight.
🧱 4. Major CHoCH & Interchange Zone
Look lower on the chart — the SR Interchange Zone around the $76,000–$78,000 area is significant.
This acted as resistance in early 2025, flipped into support later, and now stands as a potential Major CHoCH (Change of Character) if price revisits and reverses here.
If price respects this zone again, it could mark the next bullish accumulation phase.
🎯 5. Current Target: $83,000–$85,000 Zone
Based on structural behavior, liquidity voids, and past interaction, our short-term target is the $83,000–$85,000 demand zone.
This area is marked as “Target + Next Reversal” on the chart.
We expect either:
A reaction and reversal from this zone
Or a deeper push toward SR Interchange depending on volume and macro triggers
🧮 Key Technical Breakdown:
Component Observation
Trendline Break TRC Breakout in February
Bullish BOS Confirmed around $108,000
Reversal Area ~$112,000 (Supply/Distribution)
Structure Shift Bearish BOS confirmed
Current Target $83,000–$85,000
CHoCH Potential $76,000–$78,000
Bias Bearish short-term
🧠 Trading Wisdom:
“Structure tells the story — price action confirms it.”
Always analyze shifts in structure, not just candle patterns. BOS and CHoCH are some of the most reliable tools in understanding true market intent, especially when aligned with high-volume reversal areas.
✅ Final Thoughts:
Bitcoin is currently in a controlled retracement phase, and we are watching closely how price behaves near the $83K–$85K demand zone. If that fails, the deeper SR Interchange at ~$76K becomes the next high-probability zone for long entries.
This is a time to be patient, analyze clean structure, and ride with smart money, not against it.

Bitcoin analysis based on Heiken-Ashi4hr, daily forecast based on HA pattern. We'll come back to validate it.
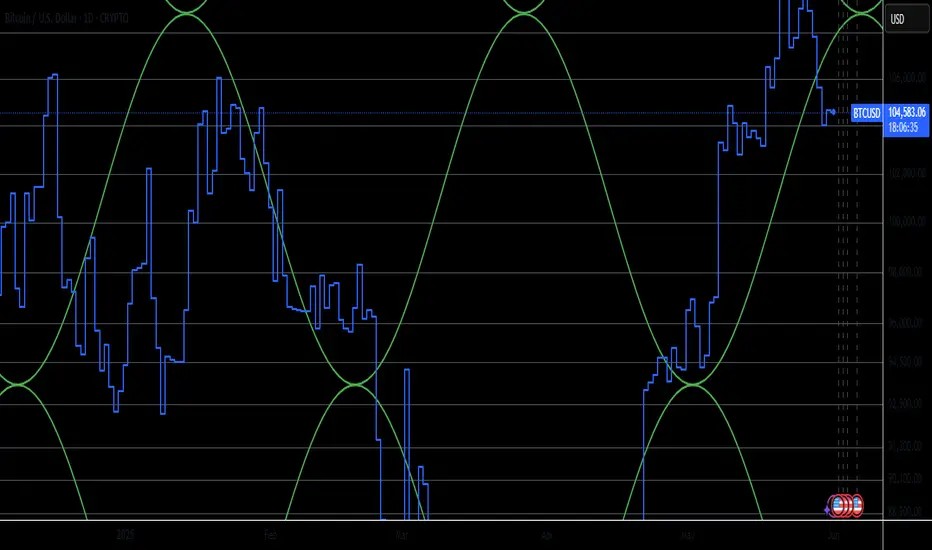
BTC/USD: Bullish Breakout Likely Above $110KAccording to the sinusoidal wave, Bitcoin will break to the next level at around 110k. Given a sinusoidal wave amplitude of 17%, the next Bitcoin price target is projected to be around 126k.
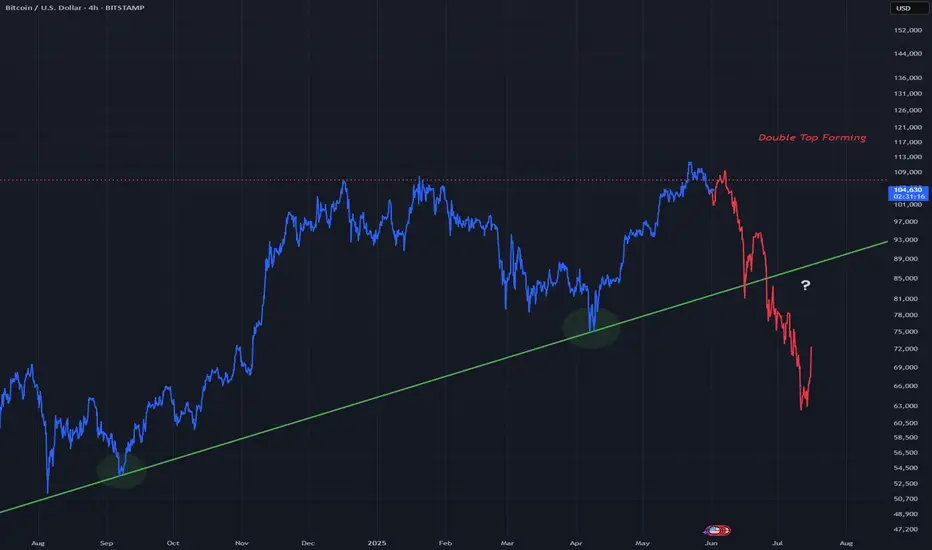
BTCUSD - Bear Double Top ScenarioBitcoin is still above the ascending trend line in green however price is looking to form a next high reaching new ATH's
This could lead to resistance at the next top creating a double top, pushing price back down to the ascending trend line. From there if this strong trend line in green breaks it could turn very bearish below that line.
4Hr chart
Simple order block scalp
BTCUSD Trade Breakdown 🔍💰
Clean order block to order block move on BTCUSD. Took the entry on the retest of a key zone—low risk with a tight stop thanks to timing and volume conditions. ✅
Price needed to push through a bearish FVG, and now the trade is running risk-free. I'm holding for now and watching for more entries in line with the setup.
🎉 One of our members followed this trade on a £20 live learning account and is currently up 14%! Awesome to see the strategy working in real time for learners.
Gold setup is looking ready too 👀
📈 Like, comment, and share your thoughts or questions. Got any recommendations or similar setups? Drop them below! Appreciate you checking it out 🙌
---
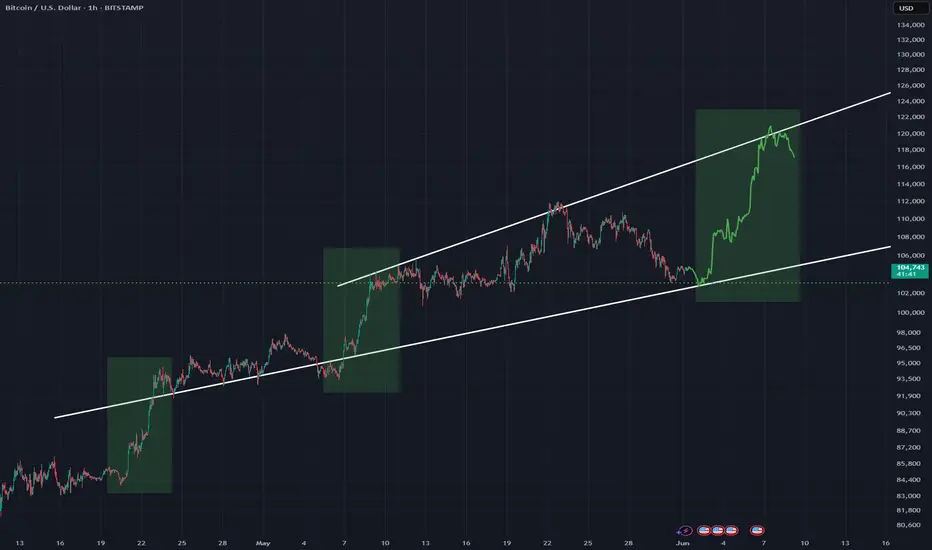
Bullish View #BTC Looking for a third strong wave up within this expanding pattern as price hits support in white
Moves up in green rectangles are similar
Hourly timeframe with the horizontal dotted line as a strong support line
sellers are getting absorbedin this chart you can see the CVD decreasing while price is increasing.
we also made a tridant structure
although these are all bead lows, that i would like to be swept absorption is happening and money is flowing in.
so im prepared in case it wants to make a sweep on CME market open.
but its an obvious long
