BITCOIN Getting Ready For The 1hr Bounce.Alright ladies and gentlemen, bears 1hr tf party almost completed.
Vertical blue line is where it ends and Bulls take over again, so whatever price drops when it reaches that vertical blue line (if not sooner) that will be it and will start bouncing.
Now, if the bounce starts from a point too low (near $100k ) and doesn't breaks above $107k again then brace for a hard landing next week cause bulls are getting weaker and weaker on every drop and if this pattern continues then we will see numbers below $100k by next week.
It is very important for price to end this week candle above $109k .
Buckle up ladies and gentlemen, we are heading for a rough end of week.
Best areas to enter for next bounce are below $102500 with liquidation point below $100k with low lev recommended. Use lev wisely.
Know the rules of the game....play it right. Have a nice trading day.
BTCUSD.PI trade ideas

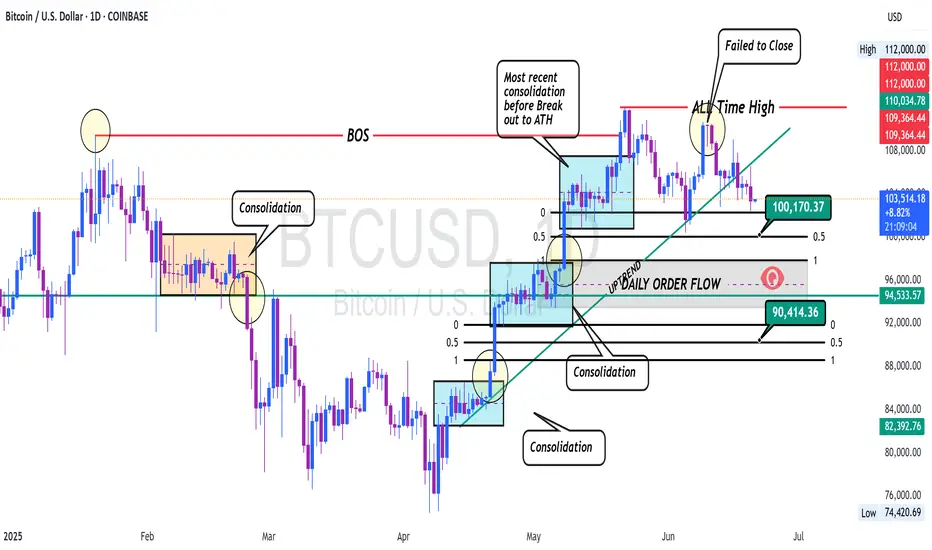
BTC MAY SELL TO $95K ZONE In my last BTC idea, I simply mentioned that I would remain bearish on BTC until I see a closure above the most recent high of $112,000. Right now after BTC failed to close above the previous high, we have been seeing some bearish movement and now the king of crypto is trading the uptrend line.
We also saw a pullback toward the trendline but the price of the asset could still not break and close above the trendline thereby giving some warning to BTC Bulls and retail traders trading with emotions rather than paying attention to price action.
For me, I believe that for as long as price continues to trade below the trendline, we are more likely to see some attempts for price to violate already mitigated FVG and see price at the $98,000 to $101,000 zone in the first instance and if we see a close below the FVG, then we might see $95,000 sitting in the daily Order Flow zone.
Pay attention to price action and trade with less emotions.
BTCUSD MOVES H1 ANNALSIS OUTLOOK BULLISH 20/6/2025buy 10.3700
others limit 10.3300
Take profit 10.4200
take profit 10.4800
take profit 10.5500
stop los 10.2500
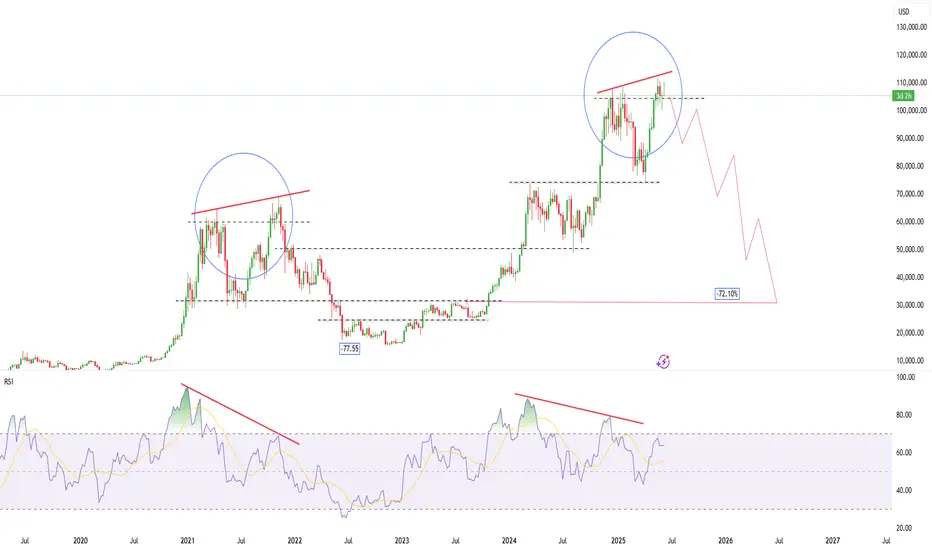
Bitcoin Dip Coming Soon1. Historical Example (Left Side of the Chart - around 2021-2022):
"NFT" Label at the Top: The trader has labeled a peak around late 2021 with "NFT." This likely signifies a period of market euphoria or a local top, possibly correlated with a peak in NFT hype.
Failure to Make New Highs / Bearish Structure: After this peak, the price action shows lower highs and lower lows, indicating a downtrend.
Break of Support: The price broke down from a previous support area.
Targeting Previous Demand: The arrow points down towards a shaded maroon box. This box represents a significant area of previous demand/support FVG (roughly $15,000 - $30,000 in this hypothetical chart) where buyers previously stepped in, or where price consolidated before a major move up. The expectation was that price would revisit this significant prior zone.
2. Current/Projected Scenario (Right Side of the Chart - 2025 onwards):
"NFT" Label at the Current Top: Again, an "NFT" label is placed near the recent high (around
105,000 − 105,000− 110,000 in this chart). This suggests the market is again at a euphoric peak or a significant local top.
Potential Double Top / Rejection: The price has made a significant high and seems to be struggling to push further, showing signs of rejection (as indicated by the recent candles with upper wicks and a potential downturn). This could be forming a double top or a lower high relative to the absolute peak.
Two-Stage Short Target:
First Target (Short Arrow): The shorter arrow points down to a horizontal line around the $75,000 - $80,000 level. This is likely a near-term support level, perhaps a previous swing low or an area of recent consolidation. A break below the current highs might lead to a test of this level.
Second, Larger Target (Long Arrow): The longer arrow points down to a much larger shaded maroon box. This box (roughly $30,000 - $40,000 in this chart) represents a significant, longer-term demand/support zone. This zone was a major area of consolidation or previous resistance that turned into support before the most recent leg up to the $100k+ levels.
Rationale for the Deeper Target: If the near-term support (around 75k−75k−80k) fails to hold, the trader expects a more significant correction.

BTCUSDEventually anything goes up sooner or later goes down especially speculative and high liquidity market this is the system or core process and nothing is impossible.
Again, it's just simple prediction based on simple technical analysis there are so many other factors involve where to market would be next move means its only just forming not confirmed yet once again just scenario. NOT FA.
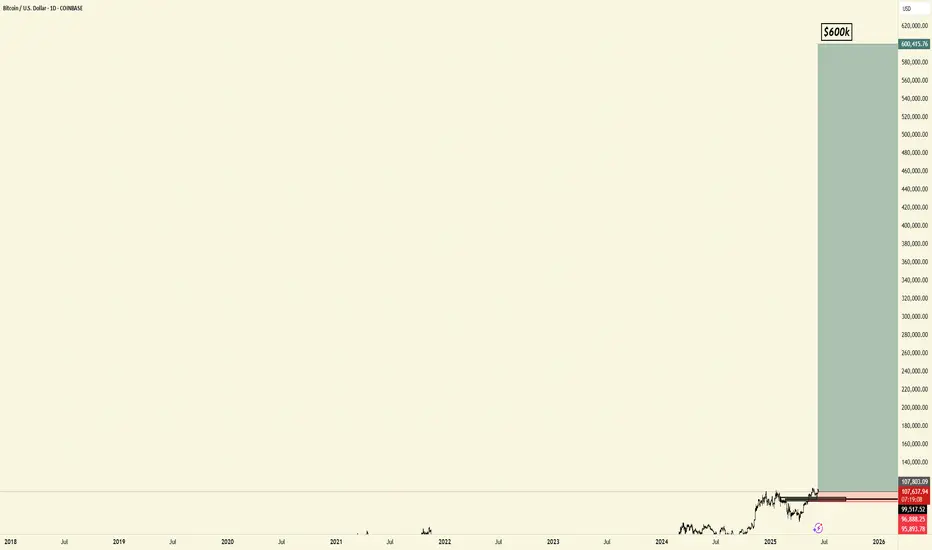
Bitcoin long $600k- long Bitcoin targeting $10-12T market cap by 2028
- acceleration of companies accumulating Bitcoin + continuation of Saylor & Strategy's ongoing TWAP
- notable uptick in global concerns w/ having access to non-sovereign store of wealth not affected by government intervention + over-reliance on USD + US Debt
- Gold's current market cap: $23T. Bitcoin is incredibly more useful as a SOV that's transferable easily across nation states & easier to transact with between parties anywhere globally
- currently holding $100k support after selling off to ~$75k during tariff fears + austerity with DOGE + macro higher low from last year and held support from November election
- including improved crypto regulatory environment otw soon + general sentiment around crypto a lot more positive
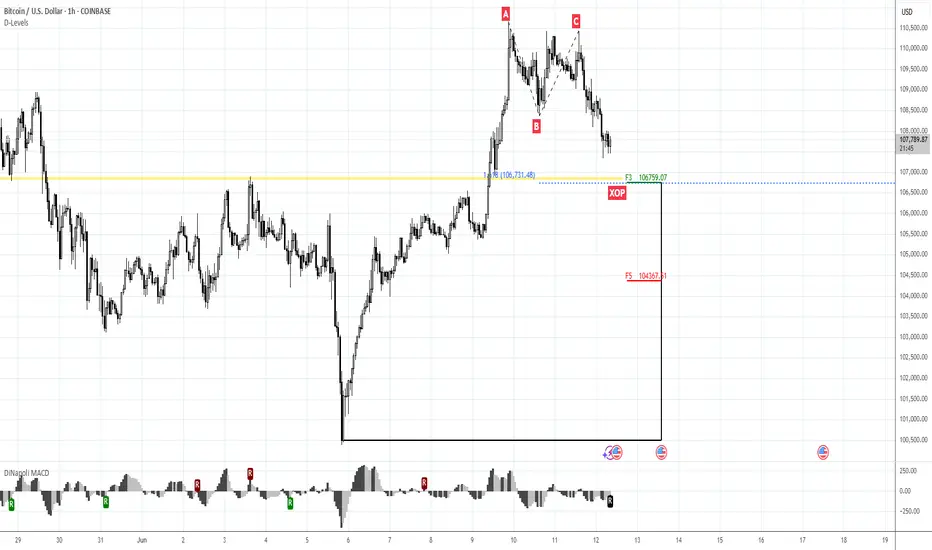
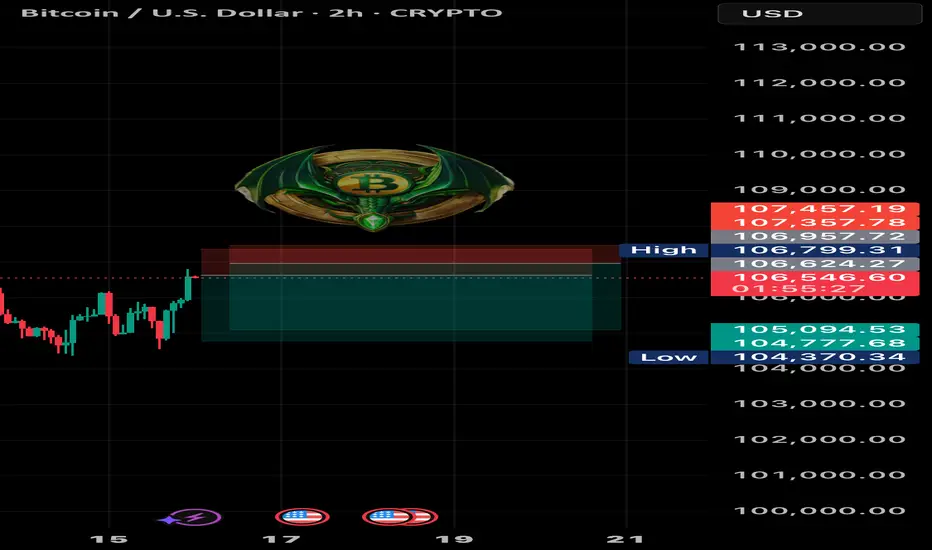
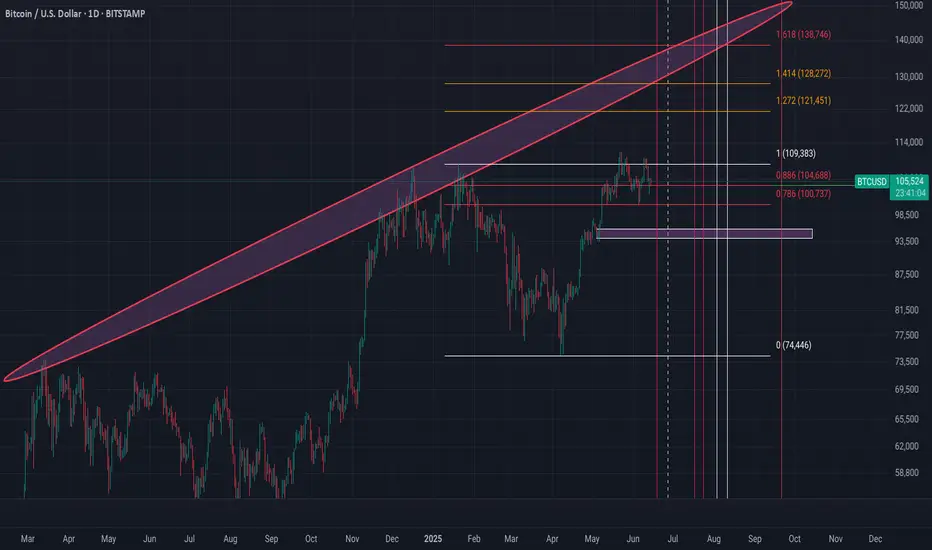
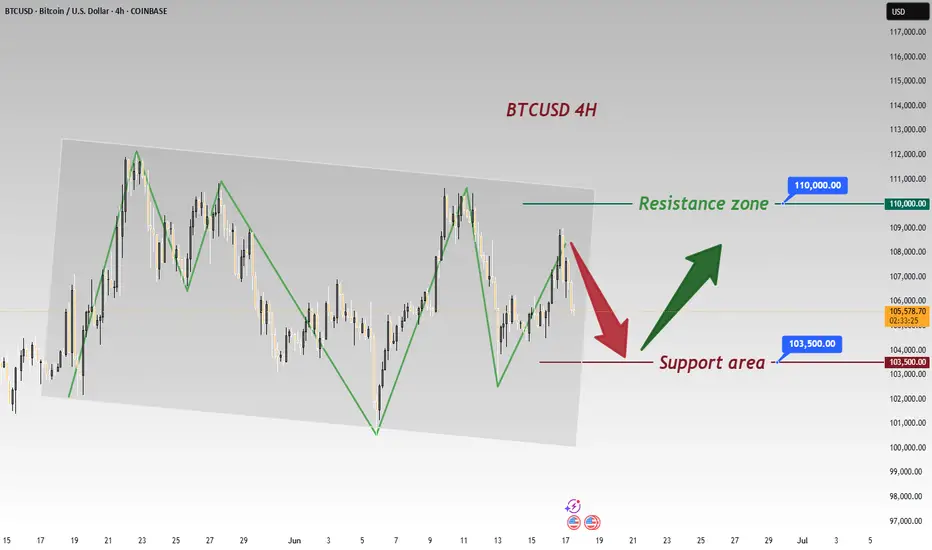
106.5K and 104.5KMorning folks,
As we've suggested upward action happened. Now overall situation stands relatively easy to understand. 100K seems like short-term vital area for upside tendency. While two support levels of 106.5K and 104.5K are those which market has to hold to keep tendency intact.
I would even prefer 106.5K area because this is also natural support line and because it agrees with downside AB-CD 1.618 extension target.
BTC SHORT TP:102,200 18-06-2025Let’s keep it simple: this pump looks fake.
I’m entering SHORT between 104,550 and 105,500, aiming for a target between 101,300 and 102,300. Average RR: 3.4 — solid and clean.
⏱️ Timeframe: 2H
⏳ Estimated duration: 12 to 24 hours
⚠️ Context: Bearish continuation — let’s ride the wave, not the noise.
Use your stop-loss based on your risk strategy. If price doesn’t move within the expected time, the setup is invalid.
We don’t use indicators, we’re not out here drawing lines or cute little shapes — I just give you a clean trade.
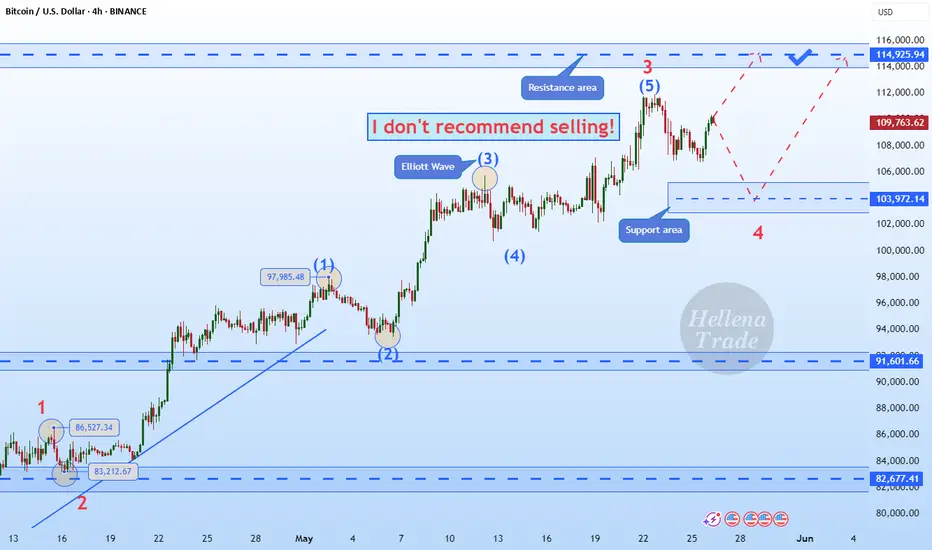
Hellena | BITCOIN (4H): LONG to resistance area of 115,000.I see that price has shown a violent rise in a five-wave move and I have redrawn the waves a bit to make it clear where to expect a correction. I think we are currently seeing a correction in wave “4” (104,000).
But most importantly, I expect an update of the high. Therefore, I believe that the level of 115,000 will be reached and it may be a wave “5”, after which we can expect a deeper correction.
Manage your capital correctly and competently! Only enter trades based on reliable patterns!
BTC SHORT TP:105,000 16-06-2025Back from a quick break and we’re jumping straight into action 😎
Short and sweet setup — we’re looking for a fast move down.
Entry: 106,500 – 107,000
Target: 104,800 – 105,100
RR: 3.0 average
Timeframe: 2H
Duration: 20–24 hours
Context: Quick and clean short after a small vacation break — let’s stack more green.
📌 Use a tight stop or adjust based on your strategy.
If the move doesn’t play out within the time range, the setup is invalid.
We don’t use indicators, we’re not out here drawing lines or cute little shapes — I just give you a clean trade.
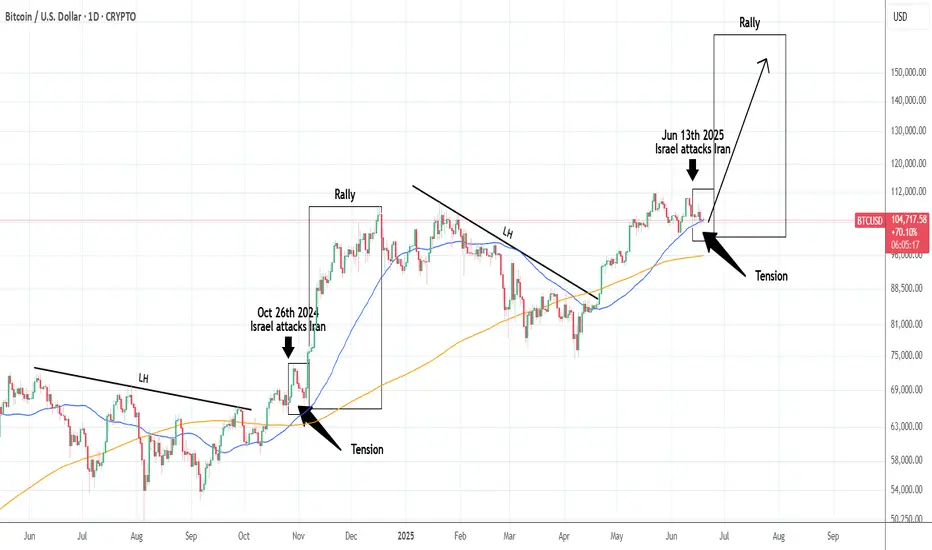
BTCUSD: Israel-Iran conflict like October 2024.Despite the Middle East tension, Bitcoin remains long term bullish on its 1W technical outlook (RSI = 63.167, MACD = 6883.200, ADX = 33.150). It remains supported on its 1D MA50, in fact in the same manner it was during the previous Israel-Iran conflict. I was on October 26th 2024, when Israel launched three waves of strikes against 20 locations in Iran and other locations in Iraq, and Syria. Simila to the June 13th 2025 attacks. It is more than striking how similar the two price patterns are. Assisted by the U.S. elections on November 5th 2024, a massive rally followed the Middle East conflict. A repeat of that may very well send Bitcoin to $150,000 and above.
## If you like our free content follow our profile to get more daily ideas. ##
## Comments and likes are greatly appreciated. ##
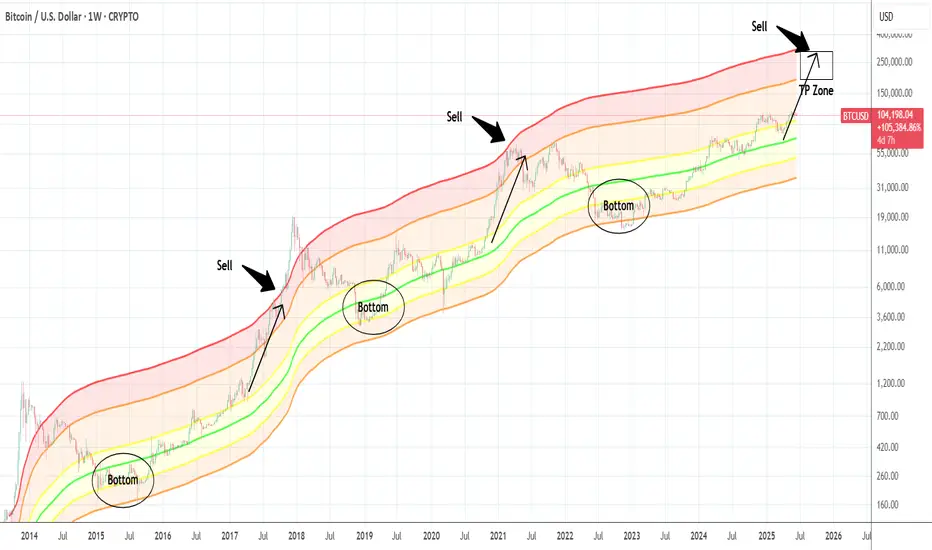
BTCUSD: Nowhere near a top yet.Bitcoin remains neutral on its 1D technical outlook (RSI = 47.257, MACD = 443.000, ADX = 29.912) due to high volatility recently but the bullish long term trend is intact and even more so, hasn't yet started the year-end rally. The Mayer Multiple Bands have always priced a Cycle's Top on their red trendline so no matter how high that may seem from the current market price, the TP zone should be between the orange (2 Stdev above) and red (3 Stdev above) trendines. Minimum TP = 200,000 for this Cycle.
## If you like our free content follow our profile to get more daily ideas. ##
## Comments and likes are greatly appreciated. ##
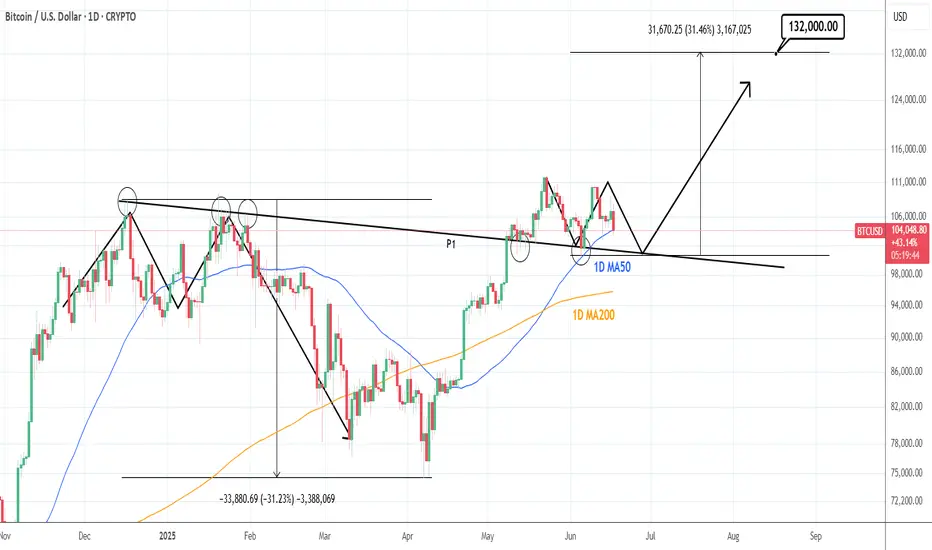
BTCUSD: 1D MA50 and 100k form a strong support base.Bitcoin has turned neutral again on its 1D technical outlook (RSI = 45.783, MACD = 629.200, ADX = 20.857) and is about to get bearish as it hit its 1D MA50 today, erasing the gains of the last 3 days. The 1D MA50 has held two times since June 5th and another one might be what Bitcoin needs to justify the next rally. Besides this however, we got a heavier Support on the P1 trendline, which on the previous ATH (Dec 17th 2024) was a Resistance and since May 12th 2025 it turned into Support. Technically, as long as 100,000 holds, we expect a strong rebound into August that may repear the inverse of December 2024 - March 2025 (-31%) and rise by +31% (TP = 132,000).
## If you like our free content follow our profile to get more daily ideas. ##
## Comments and likes are greatly appreciated. ##
BTC July/August Top3 Drives Pattern (Mar 2024, Jan 2025)
Last Drive in July/August but leaning towards July
June 19th - 22nd for potential impulse
June 27th/28th for a local top into Early July Bottom | if Price is Bearish into these dates then Local Bottom
July 17th to 24th for Summer Top
Aug 3rd to 11th for a potential Local Bottom
Expected Top is 120k and up (Can be seen on Fibs) | 135k would be ideal
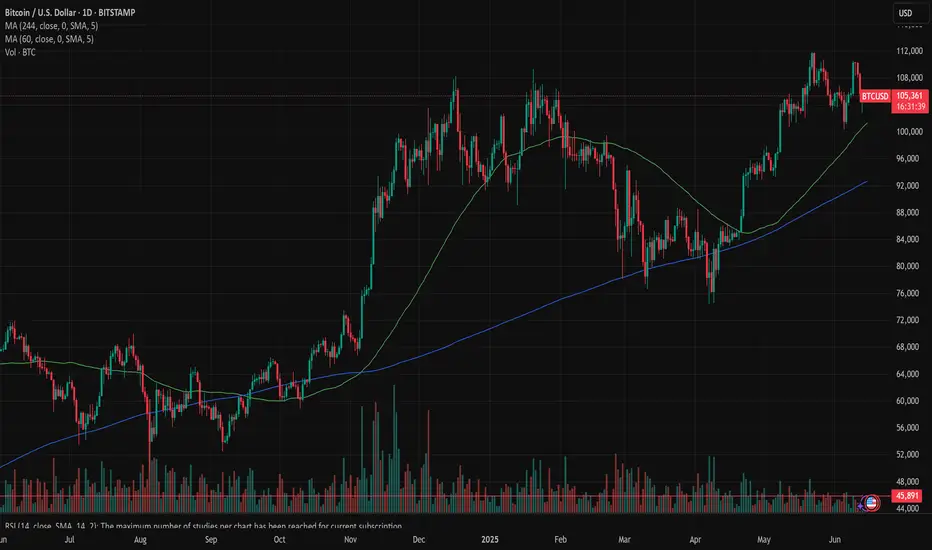
Bitcoin: weekly gains and dipsThere has been a sort of roller coaster with BTCs weekly price movements during the previous week. The week started with a strong move toward $110K. Although it seemed like a fresh new momentum toward the higher grounds, or eventually new all time highest level, the price soon began to tumble down, ending the week above the $104K level. On charts, it looks more like a “pump and dump” strategy, imposing a potential for a further correction. However, the reaction of BTC market on the negative news regarding the new unrest in the Middle East was exposed shortly on Friday trading session, when the price shortly reached the $102,9K level.
The RSI modestly dropped below the 50 level, ending the week at the 47. The MA 50 currently stands as a supporting level for BTCs price, while the indicator continues to diverge from its MA200 counterparty.
As per current charts, there is a high probability that weekly gains and dips will continue. The line connecting the lowest level from the beginning of April this year and lows from the beginning of June and from the previous week shows that there is a high probability for $104K to be tested. It also perfectly combines with MA50 as a currently supporting line. In case that the $104K is breached toward the downside, then it might bring some short bearish movements with BTC. In this scenario, the $100K might be again the target. However, if the $104K sustains the selling pressure, then the BTC will return toward the $108K.
Btc Short position Btc short position frame 15 min
Waiting the confirmation and sell
Flag pattern at 15 min
BTC PERPETUAL TRADE ,Sold From $106,800BTC PERPETUAL TRADE
BTC SELL SETUP
Currently $106,800
Sold From $106,800
(Trading plan IF BTC go up to $108,000
will add more shorts)
Expecting target $105,300 OR DOWN
In the event of an early exit,
this analysis will be updated.
Its not a Financial advice

Bitcoin’s Cup & Handle Brewing — $150K in Sight???✅ Cup Formation
Left rim near $111K
Rounded bottom down to ~$75K
Full recovery back to $112K
Volume declined into the bottom and rose on the right side — textbook structure
✅ Handle Formation
Shallow pullback from $112K to ~$102K
Occurring above prior resistance, now acting as support
Forming a clean downward-sloping channel with declining volume — ideal pre-breakout setup
🎯 Measured Move Target
Cup depth: ~$36K
Breakout above $111K projects toward $135K–$150K
🧠 Confirmation Triggers
Break and daily close above $112K
Volume spike above 20-day average
Stochastic RSI turning upward from oversold range
⚠️ Breakdown Note
Pattern remains valid as long as BTC holds above ~$93K (50% of the cup depth).
The handle may extend lower within the channel before breakout.
⌛️ TIME FRAME
If no breakout by August then Im probably wrong 😑

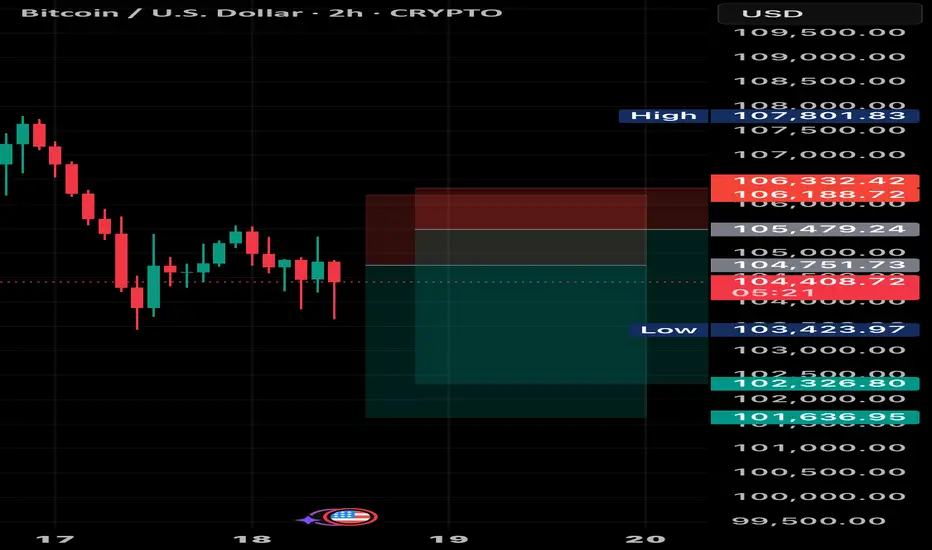
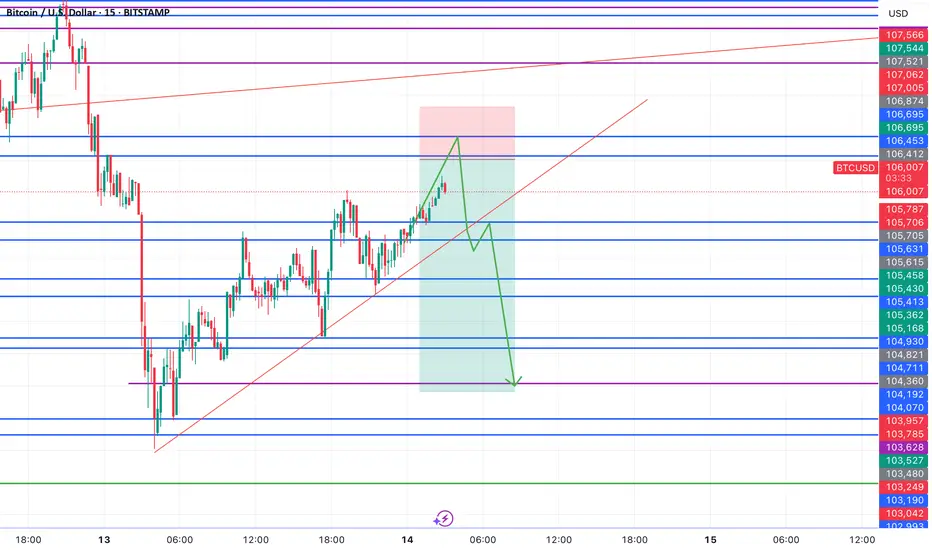
99K and 97.5K potential targetsMorning folks,
As you can see, not occasionally last time we chose only nearest 107K and 109K targets. Market indeed looks a bit heavy. Now short-term context turns bearish and we consider reaching of 99K target as rather high. Next potential target area is 97.K - butterfly target and daily Fib support.
Obviously now we do not consider any new longs and need some clear signs of sentiment changing, that we do not have by far. Let's see what will happen around support area
Expect BTC/USD to drop to 102000 post-Fed rate decisionBTC/USD Update 📈
BTC rebounded from 103500 support, now at ~105500. Short-term correction may test 100000 psychological support ⚠️
I think the Fed's interest rate decision this time may cause BTCUSD to drop directly to 102000 .
⚡️⚡️⚡️ BTCUSD ⚡️⚡️⚡️
🚀 Sell@ 105000 - 104500
🚀 TP 102500 - 101500
Accurate signals are updated every day 📈 If you encounter any problems during trading, these signals can serve as your reliable guide 🧭 Feel free to refer to them! I sincerely hope they'll be of great help to you 🌟 👇

BTCUSD Tests Support—Buy for ReboundBTCUSD opened high and trended lower today 📉, now approaching the support zone—time to buy directly and ride the rebound! 🚀
⚡️⚡️⚡️ BTCUSD ⚡️⚡️⚡️
🚀 Buy@ 105000 - 105500
🚀 TP 106000 - 107500
Accurate signals are updated every day 📈 If you encounter any problems during trading, these signals can serve as your reliable guide 🧭 Feel free to refer to them! I sincerely hope they'll be of great help to you 🌟 👇
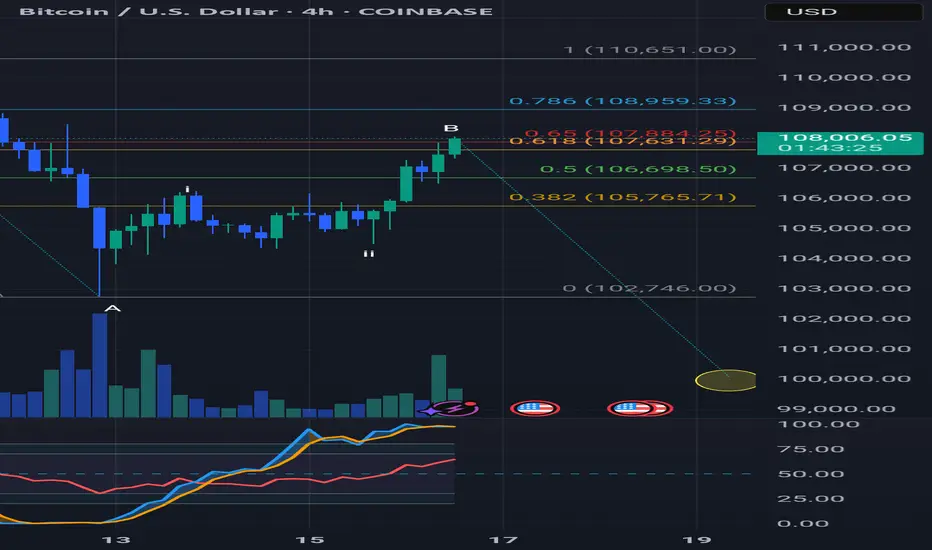
BTC to $100k?BTC retraced up to the 0.618 fib level in a 3 wave B. Soon it could resume the wave down to ~$100k. What do you think?
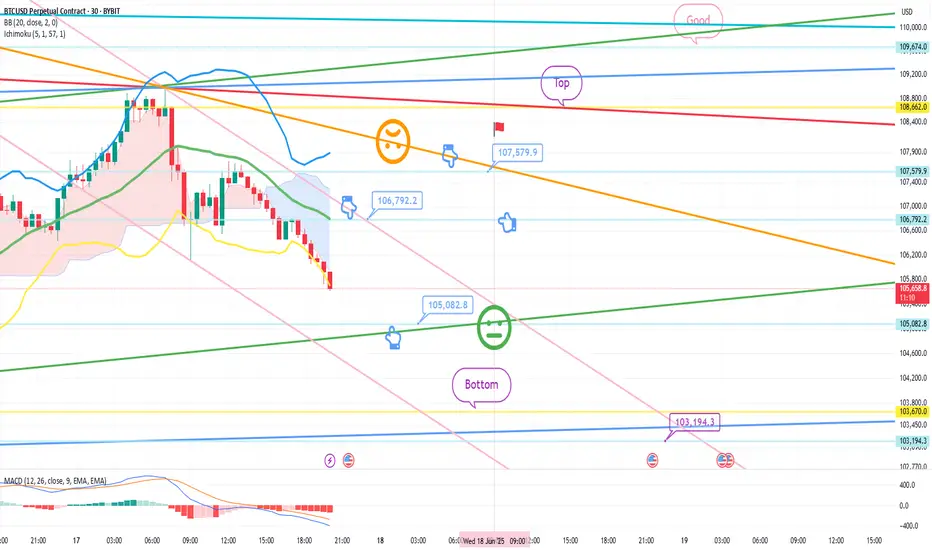
June 17 Bitcoin Bybit chart analysisHello
This is Bitcoin Guide.
It's been a while.
I took a break recently because the participation rate was not good.
Since it's been a while since I did an analysis, I did it in a short form,
I hope you enjoy it.
If you "follow"
You can receive real-time movement paths and comment notifications on major sections.
If my analysis was helpful,
Please click the booster button at the bottom.
Here is the Bitcoin 30-minute chart.
I created a strategy based on the possibility of sideways movement in Nasdaq and the rebound of Tether Dominance.
* When the blue finger moves,
It is a two-way neutral short->long switching strategy.
1. $106,792.2 short position entry point / stop loss price when orange resistance line is broken
2. $105,082.8 long position switching / stop loss price when green support line is broken
3. $107,579.9 long position 1st target -> Top 2nd target price
If it goes down from the current position,
Check the bottom section -> up to $103,194.3.
Please use my analysis as a reference only
I hope you operate safely with principle trading and stop loss price.
Thank you.