Bitcoin Hugging The Daily 50 MABitcoin continues to hover in familiar territory, and today’s chart doesn’t add much new drama – but it does offer some useful structure to work with.
Price is grinding just above the 50-day moving average, which currently sits around $104,000. That level has provided reliable support over the last few weeks and is now reinforced by horizontal support from the prior range breakout. A clean bounce here keeps the door open for another attempt at the $112,000 high, which remains the key resistance level to reclaim.
Below the current price, the structure is layered. The next major support sits around $100,700, and below that, the psychological $100K mark acts as a backstop. A break below that level could set the stage for a deeper pullback toward $92,800 or even $88,800 – both of which served as prior resistance and could now act as support.
Momentum remains weak, volume is nothing to write home about, and volatility has tapered off. But this type of coiling action often precedes a bigger move. The good news for bulls is that despite the chop, Bitcoin has consistently made higher lows – a sign of quiet accumulation and underlying strength.
Bottom line – Bitcoin is range-bound but respecting structure. As long as it holds above $104K, bulls are still in the game. Break below $100K, and the picture changes quickly. Stay nimble.
BTCUSD.PI trade ideas

Bitcoin H1 | Pullback resistance at 61.8% Fibonacci retracementBitcoin (BTC/USD) is rising towards a pullback resistance and could potentially reverse off this level to drop lower.
Sell entry is at 106,682.50 which is a pullback resistance that aligns with the 61.8% Fibonacci retracement.
Stop loss is at 107,900.00 which is a level that sits above the 78.6% Fibonacci retracement and a swing-high resistance.
Take profit is at 103,612.00 which is a swing-low support.
High Risk Investment Warning
Trading Forex/CFDs on margin carries a high level of risk and may not be suitable for all investors. Leverage can work against you.
Stratos Markets Limited (tradu.com ):
CFDs are complex instruments and come with a high risk of losing money rapidly due to leverage. 63% of retail investor accounts lose money when trading CFDs with this provider. You should consider whether you understand how CFDs work and whether you can afford to take the high risk of losing your money.
Stratos Europe Ltd (tradu.com ):
CFDs are complex instruments and come with a high risk of losing money rapidly due to leverage. 63% of retail investor accounts lose money when trading CFDs with this provider. You should consider whether you understand how CFDs work and whether you can afford to take the high risk of losing your money.
Stratos Global LLC (tradu.com ):
Losses can exceed deposits.
Please be advised that the information presented on TradingView is provided to Tradu (‘Company’, ‘we’) by a third-party provider (‘TFA Global Pte Ltd’). Please be reminded that you are solely responsible for the trading decisions on your account. There is a very high degree of risk involved in trading. Any information and/or content is intended entirely for research, educational and informational purposes only and does not constitute investment or consultation advice or investment strategy. The information is not tailored to the investment needs of any specific person and therefore does not involve a consideration of any of the investment objectives, financial situation or needs of any viewer that may receive it. Kindly also note that past performance is not a reliable indicator of future results. Actual results may differ materially from those anticipated in forward-looking or past performance statements. We assume no liability as to the accuracy or completeness of any of the information and/or content provided herein and the Company cannot be held responsible for any omission, mistake nor for any loss or damage including without limitation to any loss of profit which may arise from reliance on any information supplied by TFA Global Pte Ltd.
The speaker(s) is neither an employee, agent nor representative of Tradu and is therefore acting independently. The opinions given are their own, constitute general market commentary, and do not constitute the opinion or advice of Tradu or any form of personal or investment advice. Tradu neither endorses nor guarantees offerings of third-party speakers, nor is Tradu responsible for the content, veracity or opinions of third-party speakers, presenters or participants.

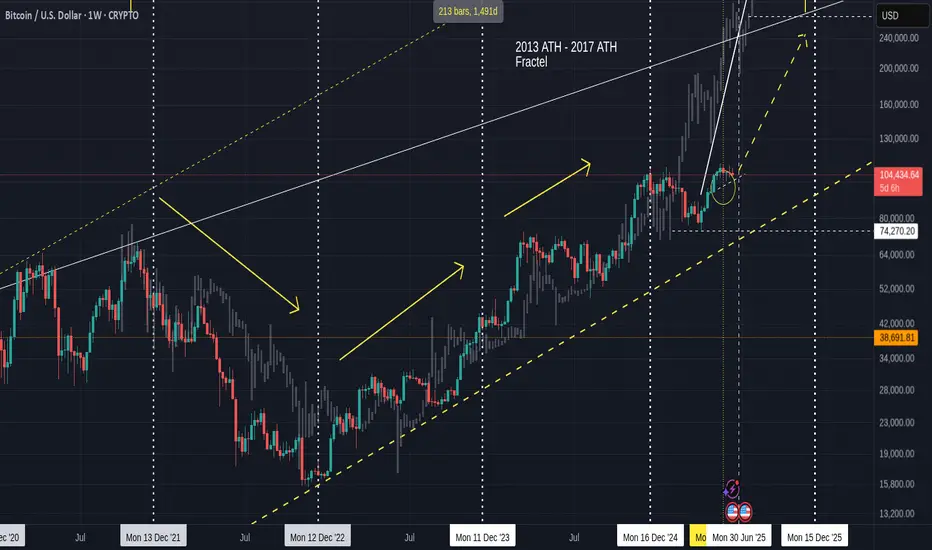
Bitcoin in expected price zone, may go lower then UP ?
This is the old fractal chart and I have faded out the Fractal from 2013 to 2017,
Everything ese remains unchanged since Feb this year.
We hit the expected price range indicated by the circle and we are still in that area but I expect, once the month closes and we have a small red month candle, then we can start printing Green again.
The daily version of this chart shows us more local detail
We have left the area of resistance and so now, we have a free move BUT I think we may dip down to that line of support around 100K - 98K
This would not be a bad thing to do before the end of the month as it would cool off the PA / RSI and MACD and so give confidence to the serious investor while scaring the pats off the New guys and Gals.
The Daily MACD still has a way to dip before it may find support on the neutral line
This level could see PA near that line of support but it is possible for MACD to drop while PA ranges.
So we could see that Dip to line of support and it may offer the last 100K buying zone for a very long time ..
But we do have Stupid people trying to start WW3 with Lies and Greed - this could possibly destabilise things.
Be Cautious
BTCUSD Interlocking Shapes H4 TFDescending wedges and channels usually breakout to the upside while ascending wedges and channels usually breakout to the downside. We currently have an ascending channel on the H4 TF. But as usual, nothing is confirmed until a clear breakout and retest.

Markets closed Expect buyers from yesterday too cash put on their entry’s and create a uptrend buying low and selling high for this week stay on the look out for trend changes
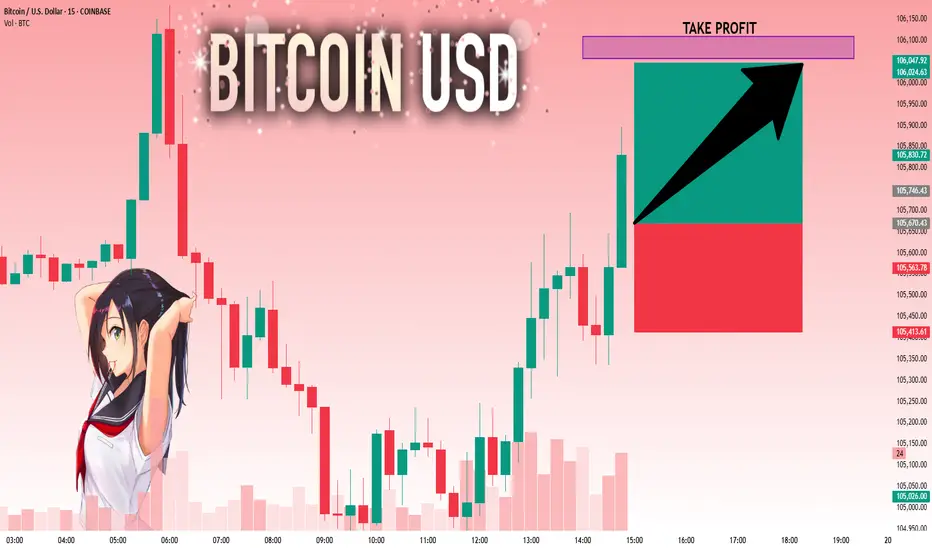
BTCUSD📈 Bitcoin (BTCUSD) Market Update
Current Price: $105,000.00
Outlook: Strongly Bullish
Bitcoin is currently trading at $105,000 and showing continued bullish momentum. Price action indicates strong demand at current levels, with technical structure suggesting potential for an explosive move upward.
Key Insight:
Buy pressure remains dominant, with no immediate signs of reversal. BTC is holding above key support zones and appears poised for a continuation rally.
📊 Trade Idea:
Bias: Long (Buy)
Entry Zone: Market Price (~$105,000)
Short-Term Targets:
🎯 Target 1: $110,000
🎯 Target 2: $120,000
🎯 Target 3: $130,000
Note: Monitor for consolidation above $105,000 as a base for further upside. Risk management remains essential—adjust stop-loss levels as per your strategy.
BRIEFING Week #25 : Heading into Summer ModeHere's your weekly update ! Brought to you each weekend with years of track-record history..
Don't forget to hit the like/follow button if you feel like this post deserves it ;)
That's the best way to support me and help pushing this content to other users.
Kindly,
Phil

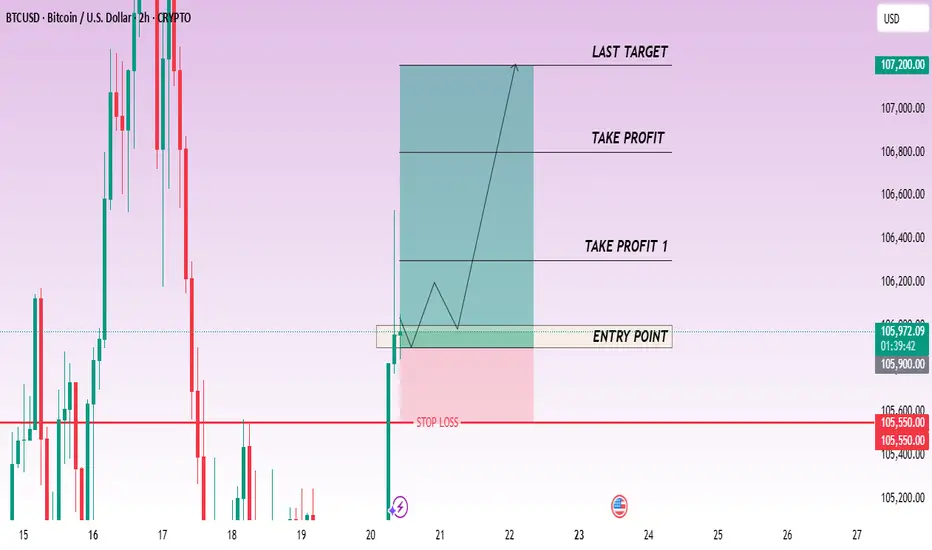
CHECK BTCUSD SIGNAL READ CAPTAINbtcusd buy now ✅
entry point (106.000) (105.900)
TAKE PROFIT 1: (106.300)
TAKE PROFIT 2: (106.800)
LAST TARGET (107.200)
STOP LOSS (105.550)
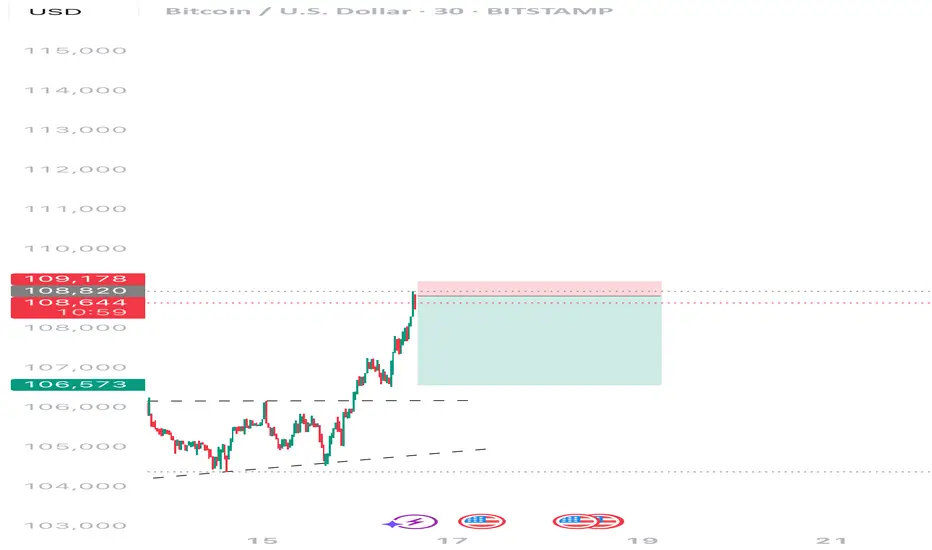
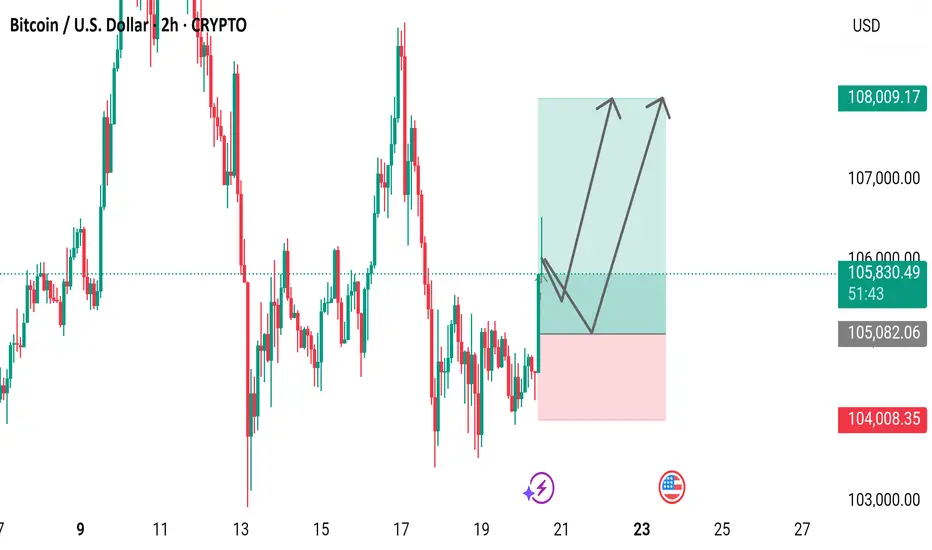
Bitcoin (BTC/USD) 2-Hour Candlestick Chart2-hour candlestick price movement of Bitcoin (BTC) against the U.S. Dollar (USD) as of June 20, 2025. The current price is $106,004.49, reflecting a 2-hour increase of $1,317.33 (+1.26%). The chart highlights a recent upward trend with a support level around $105,082.06 and resistance near $108,009.17. A shaded area indicates a potential price range, with a bullish projection suggested by the overlaid trendline.
BITCOIN, trend outlook for this summerWhile the fundamentals are still very complicated on the stock market at present, with the FED intransigent, trade war/diplomacy (deadline set for July 9 to reach trade agreements) and extreme geopolitical tensions, can the bitcoin price withstand all these challenges and continue its annual bull run over the summer? Let's take a look at a number of elements, including a major technical risk and two factors that are, on the contrary, favorable to a new record this summer.
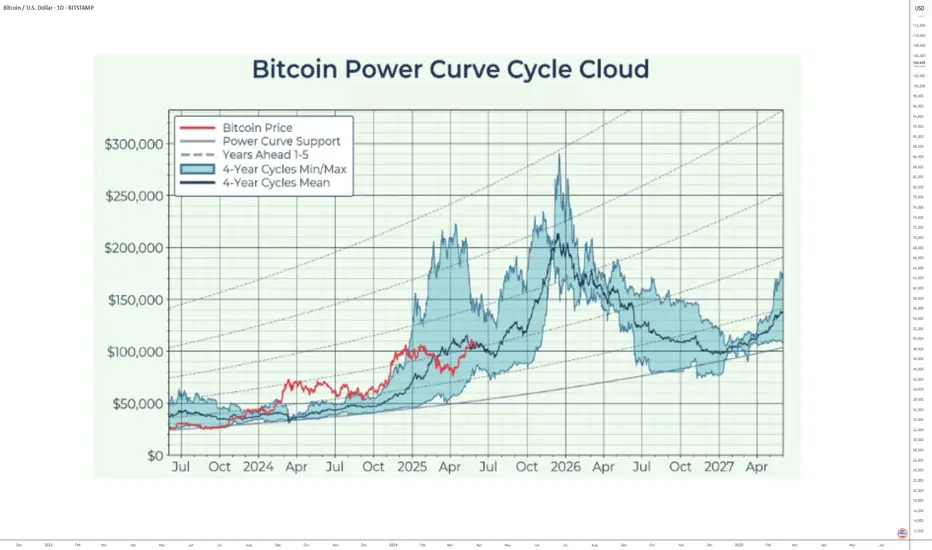
1) Bitcoin's bullish cycle linked to the spring 2024 halving is still long
Let's start with the cyclical aspect of bitcoin, the famous 4-year cycle built around the quadrennial halving. The last halving took place in April 2024, and if the cycle repetition works again, then the current cycle is due to end at the end of 2025. So there's still time for bitcoin to set a new record, even if it comes under short-term pressure - it still has 5 months to go.
The first chart below summarizes the 4-year cycle by averaging the time and price of all previous cycles since 2009. Our current cycle is represented by the red curve, and in terms of probability, the end of the cycle is expected between October and December 2025.
There's still time, and this is the first major piece of information in our article.
2) A bearish technical divergence in weekly data calls for great caution
On the other hand, technical analysis of the bitcoin price in weekly data gives a warning signal with the presence of a bearish price/momentum divergence, market momentum being represented here by the RSI technical indicator.
This bearish divergence resembles that at the end of the previous cycle in November 2021, but the comparison stops here. At that time, all end-of-cycle models were on alert, but this is not the case today. Nevertheless, we must be aware that this bearish divergence could be a pressure factor this summer.
3) Global liquidity as represented by the M2 monetary aggregate gives grounds for optimism about bitcoin's summer trend
Global M2 deploys a strong positive correlation with the bitcoin price, and it takes an average of 12 weeks for this liquidity to act on BTC. This monetary aggregate measures the sum of the money supply (M2) of the major economies - USA, China, Eurozone - converted into US dollars. It includes sight deposits, savings accounts and certain short-term instruments, representing the gross liquidity immediately available in the global economy.
This level of liquidity is directly influenced by monetary (key rates, QE/QT), fiscal and wage policies. The evolution of the US dollar plays a crucial role: a strong dollar mechanically reduces global M2 in USD, while a weak dollar increases it. In this respect, Chinese and US dynamics are often divergent, as they are driven by different credit logics (centralized planning on the Chinese side, rate-based adjustment on the US side).
Since the beginning of April, Bitcoin has been on a marked uptrend. This progression, which we have followed step by step, raises an essential question: can this momentum be maintained this summer, despite the fundamental challenges of the moment?
Such a hypothesis is plausible, provided that a key - and often underestimated - driver continues to act: the unprecedented increase in global liquidity, as measured by the M2 monetary aggregate. According to the latest available data, global M2 has set a new all-time record, and this is a factor supporting the BTC trend for the first part of the summer.
DISCLAIMER:
This content is intended for individuals who are familiar with financial markets and instruments and is for information purposes only. The presented idea (including market commentary, market data and observations) is not a work product of any research department of Swissquote or its affiliates. This material is intended to highlight market action and does not constitute investment, legal or tax advice. If you are a retail investor or lack experience in trading complex financial products, it is advisable to seek professional advice from licensed advisor before making any financial decisions.
This content is not intended to manipulate the market or encourage any specific financial behavior.
Swissquote makes no representation or warranty as to the quality, completeness, accuracy, comprehensiveness or non-infringement of such content. The views expressed are those of the consultant and are provided for educational purposes only. Any information provided relating to a product or market should not be construed as recommending an investment strategy or transaction. Past performance is not a guarantee of future results.
Swissquote and its employees and representatives shall in no event be held liable for any damages or losses arising directly or indirectly from decisions made on the basis of this content.
The use of any third-party brands or trademarks is for information only and does not imply endorsement by Swissquote, or that the trademark owner has authorised Swissquote to promote its products or services.
Swissquote is the marketing brand for the activities of Swissquote Bank Ltd (Switzerland) regulated by FINMA, Swissquote Capital Markets Limited regulated by CySEC (Cyprus), Swissquote Bank Europe SA (Luxembourg) regulated by the CSSF, Swissquote Ltd (UK) regulated by the FCA, Swissquote Financial Services (Malta) Ltd regulated by the Malta Financial Services Authority, Swissquote MEA Ltd. (UAE) regulated by the Dubai Financial Services Authority, Swissquote Pte Ltd (Singapore) regulated by the Monetary Authority of Singapore, Swissquote Asia Limited (Hong Kong) licensed by the Hong Kong Securities and Futures Commission (SFC) and Swissquote South Africa (Pty) Ltd supervised by the FSCA.
Products and services of Swissquote are only intended for those permitted to receive them under local law.
All investments carry a degree of risk. The risk of loss in trading or holding financial instruments can be substantial. The value of financial instruments, including but not limited to stocks, bonds, cryptocurrencies, and other assets, can fluctuate both upwards and downwards. There is a significant risk of financial loss when buying, selling, holding, staking, or investing in these instruments. SQBE makes no recommendations regarding any specific investment, transaction, or the use of any particular investment strategy.
CFDs are complex instruments and come with a high risk of losing money rapidly due to leverage. The vast majority of retail client accounts suffer capital losses when trading in CFDs. You should consider whether you understand how CFDs work and whether you can afford to take the high risk of losing your money.
Digital Assets are unregulated in most countries and consumer protection rules may not apply. As highly volatile speculative investments, Digital Assets are not suitable for investors without a high-risk tolerance. Make sure you understand each Digital Asset before you trade.
Cryptocurrencies are not considered legal tender in some jurisdictions and are subject to regulatory uncertainties.
The use of Internet-based systems can involve high risks, including, but not limited to, fraud, cyber-attacks, network and communication failures, as well as identity theft and phishing attacks related to crypto-assets.
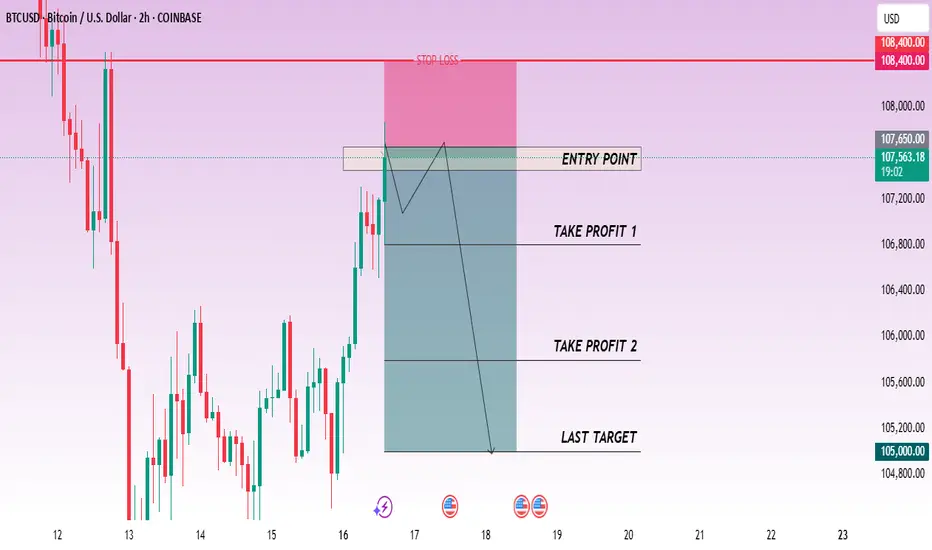
CHECK BTCUSD SIGNAL READ CAPTAINbtcusd sell now ✅
entry point (107.650) (107.450)
TAKE PROFIT 1: (106.800)
TAKE PROFIT 2: (105.800)
LAST TARGET (105.000)
STOP LOSS (108.400)
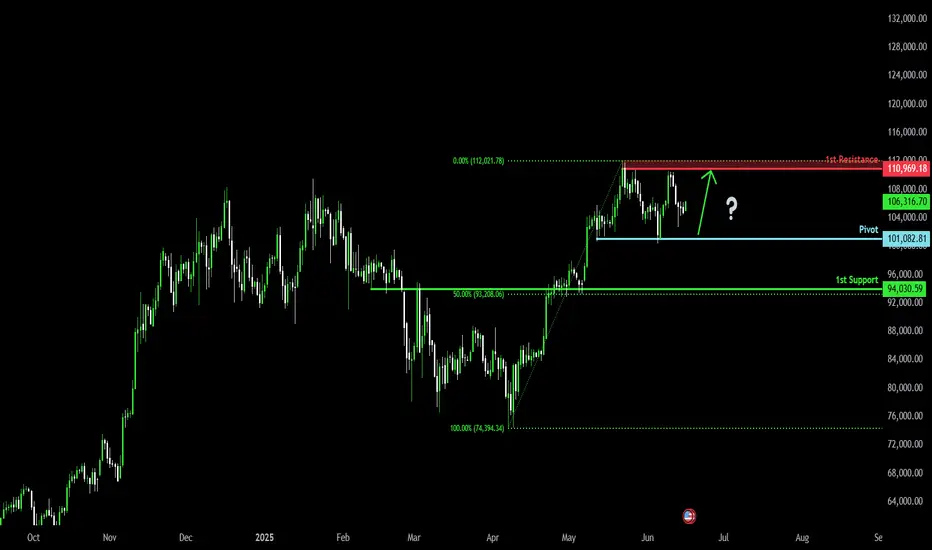
Bullish bounce?The Bitcoin (BTC/USD) is falling towards the pivot and could bounce to the 1st resistance.
Pivot: 101,082.81
1st Support: 94,030.59
1st Resistance: 110,969.18
Risk Warning:
Trading Forex and CFDs carries a high level of risk to your capital and you should only trade with money you can afford to lose. Trading Forex and CFDs may not be suitable for all investors, so please ensure that you fully understand the risks involved and seek independent advice if necessary.
Disclaimer:
The above opinions given constitute general market commentary, and do not constitute the opinion or advice of IC Markets or any form of personal or investment advice.
Any opinions, news, research, analyses, prices, other information, or links to third-party sites contained on this website are provided on an "as-is" basis, are intended only to be informative, is not an advice nor a recommendation, nor research, or a record of our trading prices, or an offer of, or solicitation for a transaction in any financial instrument and thus should not be treated as such. The information provided does not involve any specific investment objectives, financial situation and needs of any specific person who may receive it. Please be aware, that past performance is not a reliable indicator of future performance and/or results. Past Performance or Forward-looking scenarios based upon the reasonable beliefs of the third-party provider are not a guarantee of future performance. Actual results may differ materially from those anticipated in forward-looking or past performance statements. IC Markets makes no representation or warranty and assumes no liability as to the accuracy or completeness of the information provided, nor any loss arising from any investment based on a recommendation, forecast or any information supplied by any third-party.
BTCUSD: Bulls Are Winning! Long!
My dear friends,
Today we will analyse BTCUSD together☺️
The recent price action suggests a shift in mid-term momentum. A break above the current local range around 105,670.43 will confirm the new direction upwards with the target being the next key level of 106,057.41 and a reconvened placement of a stop-loss beyond the range.
❤️Sending you lots of Love and Hugs❤️
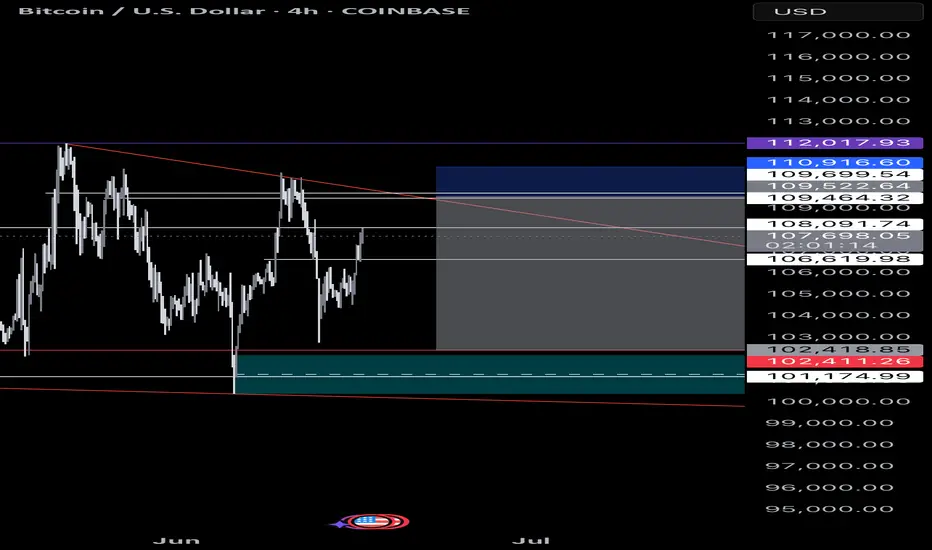
Bitcoin potential short tradeThe world is unstable and the crypto market is consolidating, I don’t expect a break out to all time high or new lows soon. Just a ranging market for now.
Entry: $109,700
Stop-loss: $110,919
Take-profit: 102,500
Let’s see this probability 70% chance of playing out ✔️
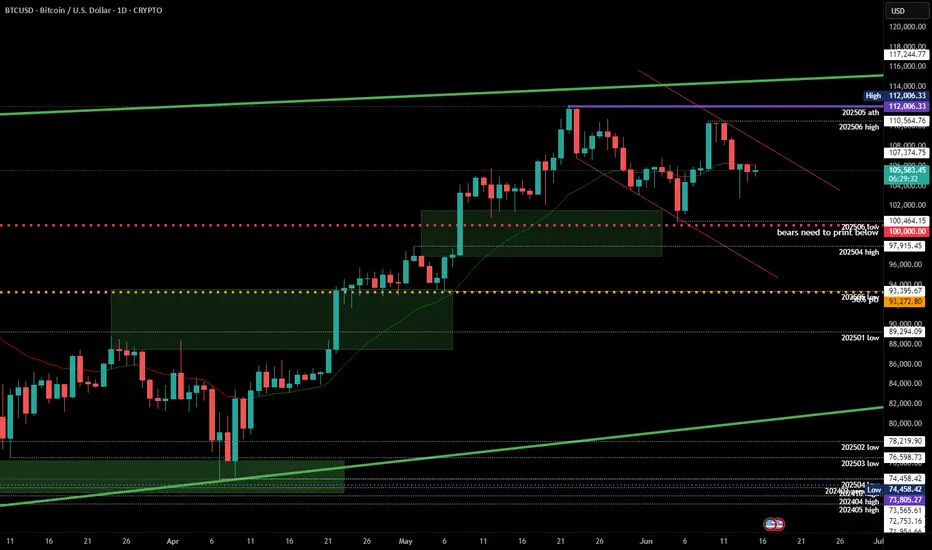
#202524 - priceactiontds - weekly update - bitcoinGood Day and I hope you are well.
comment: Last week I printed another potential two-legged correction where the C would print a new ath. Bulls were to weak to even retest 112k and 110k was all they got. Now I do think there are many more reasons that this will be the mother of all doubles tops than any arguments for the bulls exist, how they could print a new ath. Structure is decent and market has spent many days at the top trying to continuing the trend. Confirmation is a daily close below 100k.
current market cycle: Broad bull channel on the weekly tf. Market is about to re-test the ath and will likely transition into a trading range afterwards or we are already in one.
key levels: 100k - 115k
bull case: Bulls are still hopeful, that’s why we are still above 110k but the next touch could break it and I doubt many will hold long or scale into new ones there. Best bulls can get right now is to go sideways for longer and stay above 100k. I mean… Staying above 100k is as bullish as it get’s if you be honest.
Invalidation is a daily close below 100k
bear case: Can we also get a new bear trend from 110k? We would need 4-5 consecutive daily bear closes for that. Right now bears are only getting 4 but prices is not moving much during those 4 and the bars are overlapping too much. Bulls are still hopeful. Bears need to do more if they want lower prices again. As of now bulls are favored to continue inside the given range.
Invalidation is above 113k
short term: Bearish with stop 113k. Will scale into shorts and take some profits around 100k until we see a big breakout below.
medium-long term - Update from 2025-06-08:
medium-long term - Update from 2025-06-08: “Need to see a clear sign that bulls can not push it beyond 112k and once we turn again from closer to the ath, I will comment on bear targets for the next months.”
This was from last week and market provided this clear sign with the amazing double top but only a daily close below 100k is confirmation. First target below 100k is 97k the breakout retest and after that is the 50% retracement around 93000.
Is Bitcoin Trend in Danger?Damn bears destroy what it was a beautiful trend but Bulls still have one more week to try to finish the job right. TIME will tell.
Alright now that volatility has subside (for now) we can see what the numbers will be for the next 2 to 3 days and doesn't look too good unless bulls are able to climb back up and stay above the $107k within the next 48hrs.
Weekly hasn't changed at all and is to the Upside.
Daily also still to the UPside but showing weakness.
Lets see if the 4hrs TF which is in bullish mode, can fix the damage that bears did today.
Lets see what the weekend brings. No popcorns today ladies and gentlemen.
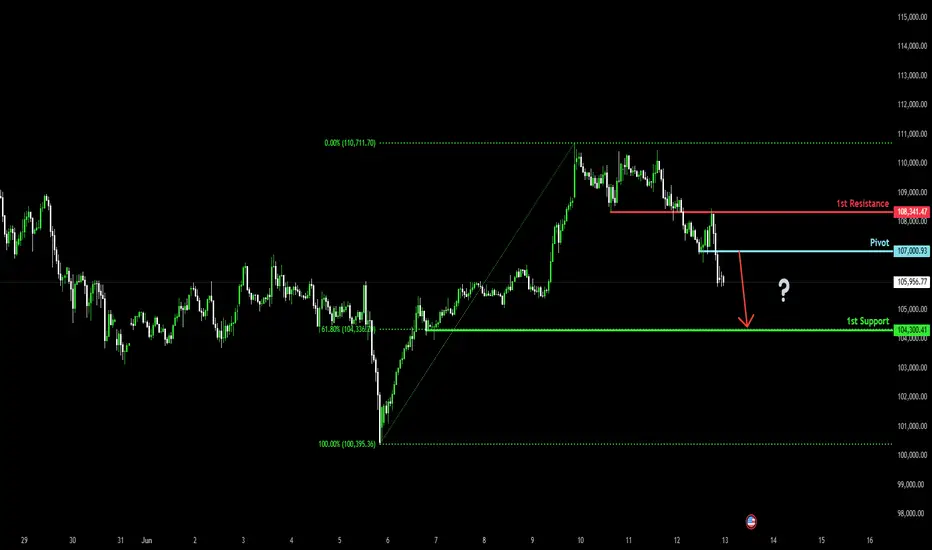
Potential bearish drop?The Bitcoin (BTC/USD) is rising towards the pivot and could drop to the 61.8% Fibonacci support.
Pivot: 107,000.93
1st Support: 104,300.41
1st Resistance: 108,341.47
Risk Warning:
Trading Forex and CFDs carries a high level of risk to your capital and you should only trade with money you can afford to lose. Trading Forex and CFDs may not be suitable for all investors, so please ensure that you fully understand the risks involved and seek independent advice if necessary.
Disclaimer:
The above opinions given constitute general market commentary, and do not constitute the opinion or advice of IC Markets or any form of personal or investment advice.
Any opinions, news, research, analyses, prices, other information, or links to third-party sites contained on this website are provided on an "as-is" basis, are intended only to be informative, is not an advice nor a recommendation, nor research, or a record of our trading prices, or an offer of, or solicitation for a transaction in any financial instrument and thus should not be treated as such. The information provided does not involve any specific investment objectives, financial situation and needs of any specific person who may receive it. Please be aware, that past performance is not a reliable indicator of future performance and/or results. Past Performance or Forward-looking scenarios based upon the reasonable beliefs of the third-party provider are not a guarantee of future performance. Actual results may differ materially from those anticipated in forward-looking or past performance statements. IC Markets makes no representation or warranty and assumes no liability as to the accuracy or completeness of the information provided, nor any loss arising from any investment based on a recommendation, forecast or any information supplied by any third-party.
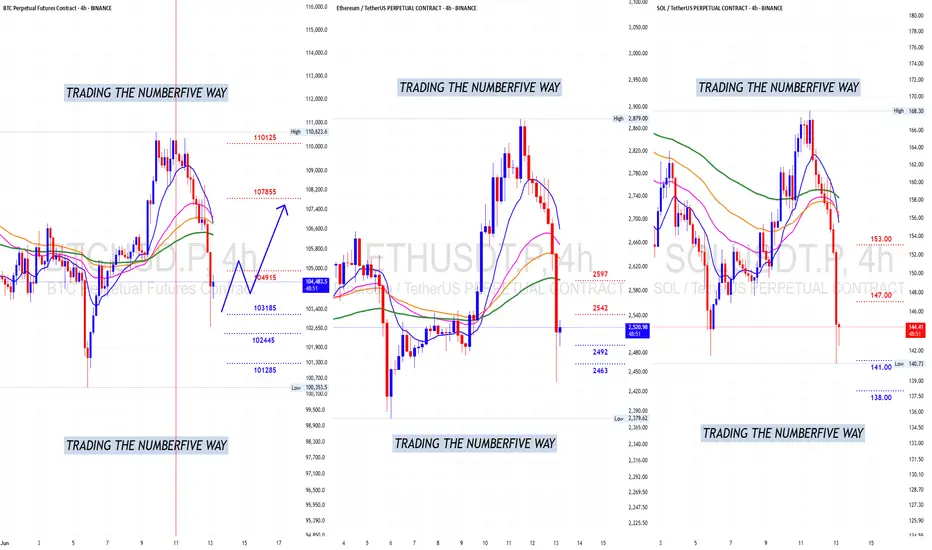
BTC 3 ways , but longhallo , i think BTC its for long , but any way on my chart you can see all possibilitys .

Bitcoin: Temporal ST FibsSo we have consecutive 2 rejections after registering Lower High on bigger scale..
Research Notes
Hypothetically, if it's about to fall based on similar flow of market reactions forming on top then this would be the closest fractal for bearish scenario.
Should be perceived as squeezed version of historic pattern. Not to scale on price axis solely, as increase in volatility can accelerate replication rate at places. The value is in temporal aspect like frequency of reversals.
To be sure I'd add a curve that describes current growth on smaller scale, and which could later on indicate a turning point.
Crossing under would confirm a scenario of bearish continuation.
Experiment
If we connect highs and map it to the local bottom, would the dimensions of original wave carry any structural significance?
Original Fib Channels (price oriented)
Temporal Fibs Sharing common coordinate to define them.
Yet to evaluate this approach for structural buildup. Fibs Channel lines are extended upwards in order to capture the reactions at any scenario.

Bitcoin top on October 2025?To estimate the potential top date of the current Bitcoin bull market, we can analyze the timeframes of the previous two bull markets.
Bitcoin’s Decentralization Is a Fairy TaleBitcoin was born as a revolutionary, decentralized currency, promising financial freedom and independence from traditional banking systems. Yet, as we analyze its real-world distribution, it becomes clear that Bitcoin’s decentralization is more myth than reality.
🔍 The Illusion of Decentralization
Bitcoin operates on a decentralized blockchain, meaning no single entity controls the network. However, when we examine who actually owns Bitcoin, we see a highly concentrated wealth structure that mirrors traditional financial inequality.
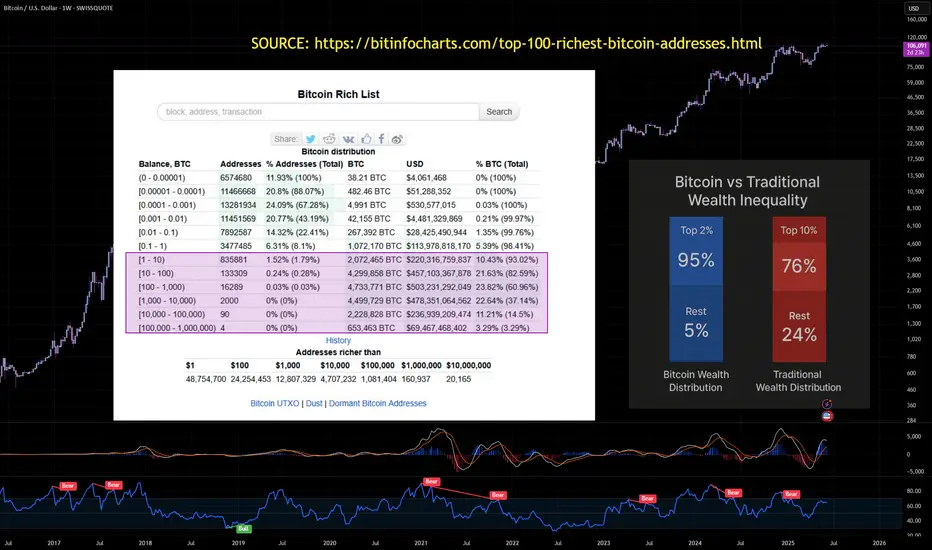
📊 Bitcoin’s Wealth Concentration
The top 0.01% of Bitcoin wallets control over 37% of total supply.
The top 1% of Bitcoin holders control over 40% of Bitcoin.
The top 2% of Bitcoin wallets control over 95% of total supply.
The bottom 98% of wallets hold less than 5% of Bitcoin.
The bottom 50% of wallets hold less than 0.03% of Bitcoin.
10,000 Bitcoin investors own 5 million BTC, worth $230 billion.
Institutional investors and early adopters dominate Bitcoin ownership.
This means that a tiny fraction of wallets dominate the entire market, while millions of small holders own completely insignificant amounts.
💰 Bitcoin vs Traditional Wealth Inequality
Bitcoin was supposed to be more equitable than traditional finance, but its wealth distribution is even more extreme than global financial inequality.
Bitcoin’s wealth gap is far worse than traditional financial inequality, proving that decentralization does not mean fair distribution.
📉 How Did Bitcoin Become So Centralized?
1. Early Adopters Accumulated Massive Holdings
Bitcoin’s first miners and tech-savvy investors acquired BTC when it was nearly worthless.
Many of these wallets still hold huge amounts, making redistribution difficult.
2. Institutional Investors Took Over
Hedge funds, exchanges, and corporations now control a massive portion of BTC.
Bitcoin ETFs and custodial wallets concentrate ownership even further.
3. Lost & Dormant Bitcoin Shrinks Circulating Supply
An estimated 29% of Bitcoin is lost or inactive, meaning fewer coins are available.
This makes the remaining BTC even more concentrated among active holders.
🚨 The Harsh Reality: Bitcoin Is Not Financial Freedom
Bitcoin was supposed to empower individuals, but in practice, it has become a playground for the wealthy.
Decentralization in theory ≠ decentralization in reality.
Institutional investors and exchanges hold a massive portion of BTC.
Bitcoin’s fixed supply (21 million BTC) makes redistribution nearly impossible.
Bitcoin is not the democratized financial system it was promised to be—it’s just another asset class where the rich get richer.
NASDAQ:MSTR NYSE:CRCL NASDAQ:COIN TVC:GOLD TVC:SILVER INDEX:BTCUSD NASDAQ:TSLA TVC:DXY NASDAQ:HOOD NASDAQ:MARA
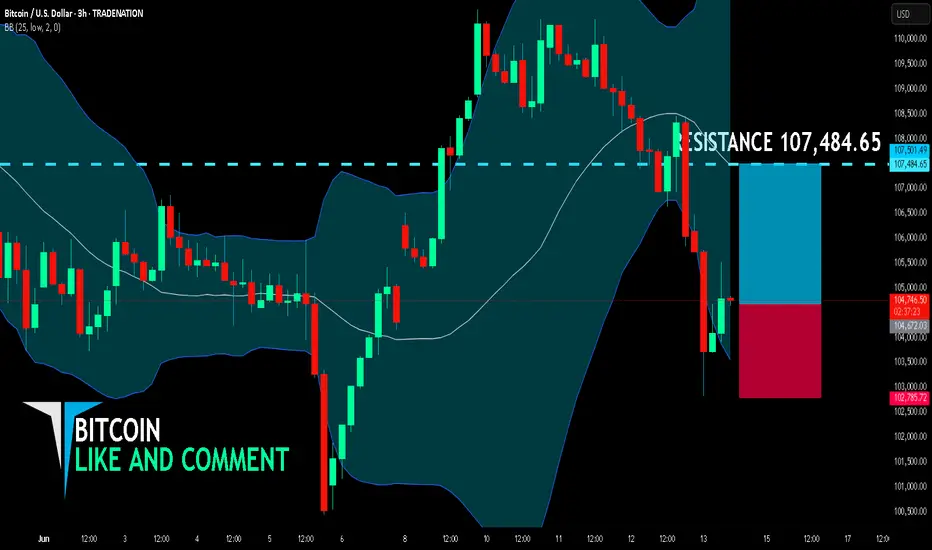
BITCOIN SENDS CLEAR BULLISH SIGNALS|LONG
BITCOIN SIGNAL
Trade Direction: long
Entry Level: 104,672.03
Target Level: 107,484.65
Stop Loss: 102,785.72
RISK PROFILE
Risk level: medium
Suggested risk: 1%
Timeframe: 3h
Disclosure: I am part of Trade Nation's Influencer program and receive a monthly fee for using their TradingView charts in my analysis.
✅LIKE AND COMMENT MY IDEAS✅
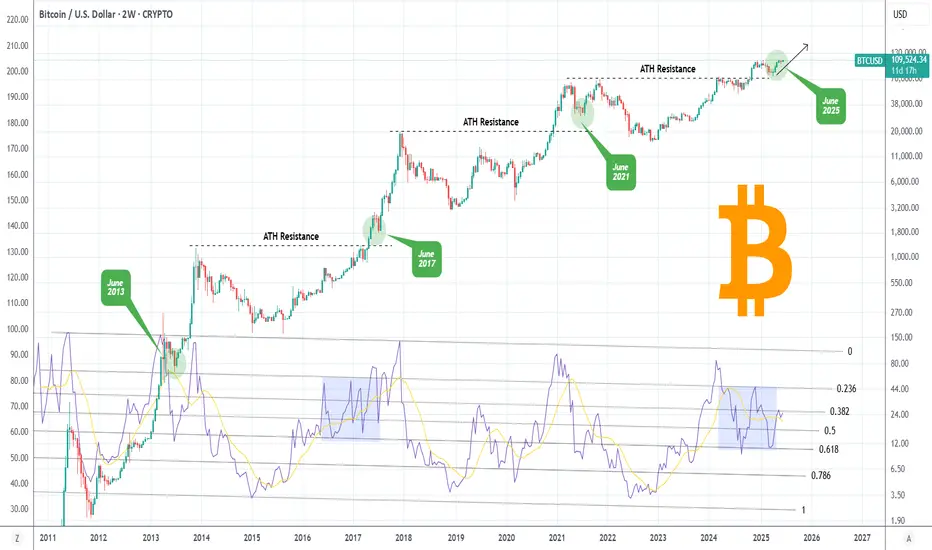
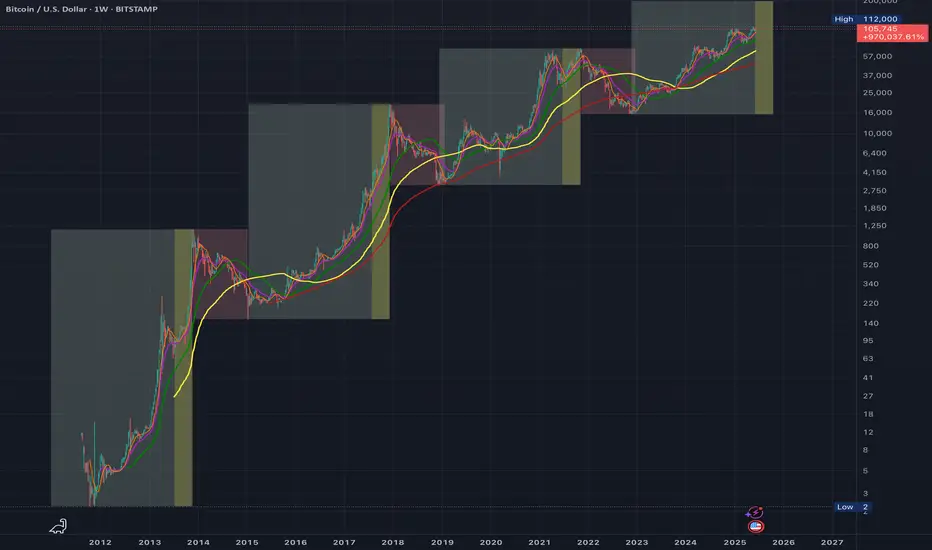
BITCOIN Is 'Bullish June Seasonality' about to kick-in?Bitcoin (BTCUSD) has started June on a very promising note, recovering most of last week's losses and is potentially headed for a new All Time High (ATH). This however, should be no surprise as BTC has exhibited amazing strength during the month of June and onwards since 2013.
As this chart shows, the market has historically rallied on June, in fact it is the month that kick-started Bitcoin's final rallies towards the Top on its last three Cycles.
Based on the 2W RSI, which is ranging within the 0.236 - 0.618 Fibonacci levels, we can argue that the price action is closer to June 2017 than other Cycles. As to how high it can get to, we've analyzed that on other studies, the current analysis only serves to show you that historically we are set for a strong 'Bullish June Seasonality' effect.
Do you agree that this is about to kick-in? Feel free to let us know in the comments section below!
-------------------------------------------------------------------------------
** Please LIKE 👍, FOLLOW ✅, SHARE 🙌 and COMMENT ✍ if you enjoy this idea! Also share your ideas and charts in the comments section below! This is best way to keep it relevant, support us, keep the content here free and allow the idea to reach as many people as possible. **
-------------------------------------------------------------------------------
💸💸💸💸💸💸
👇 👇 👇 👇 👇 👇