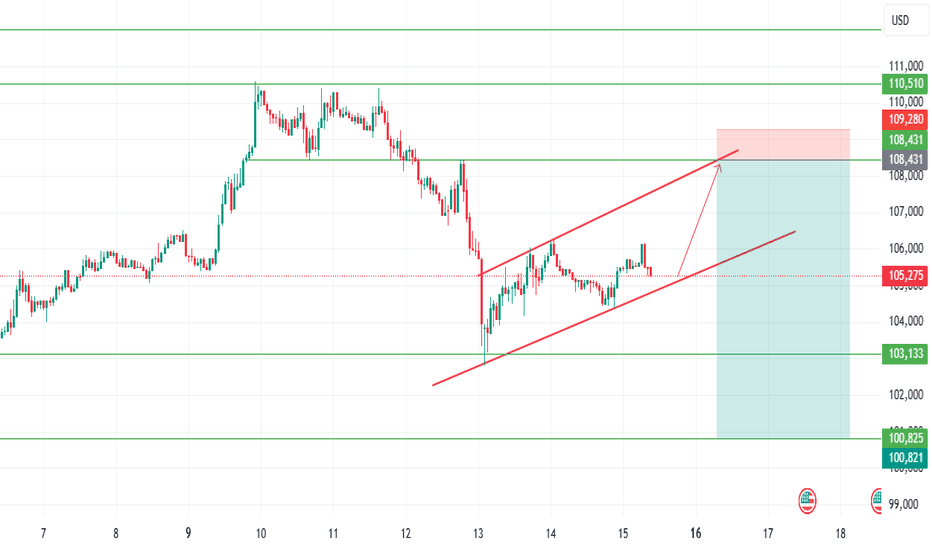
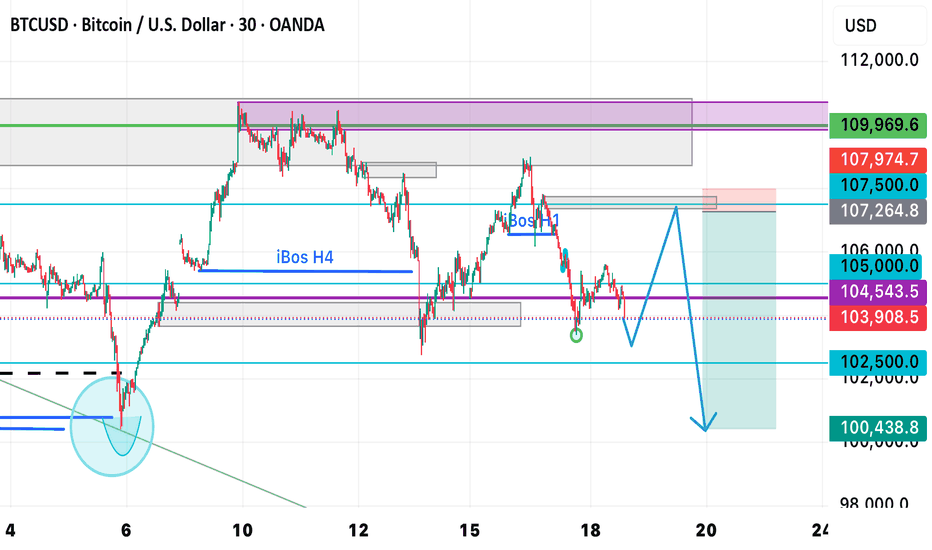
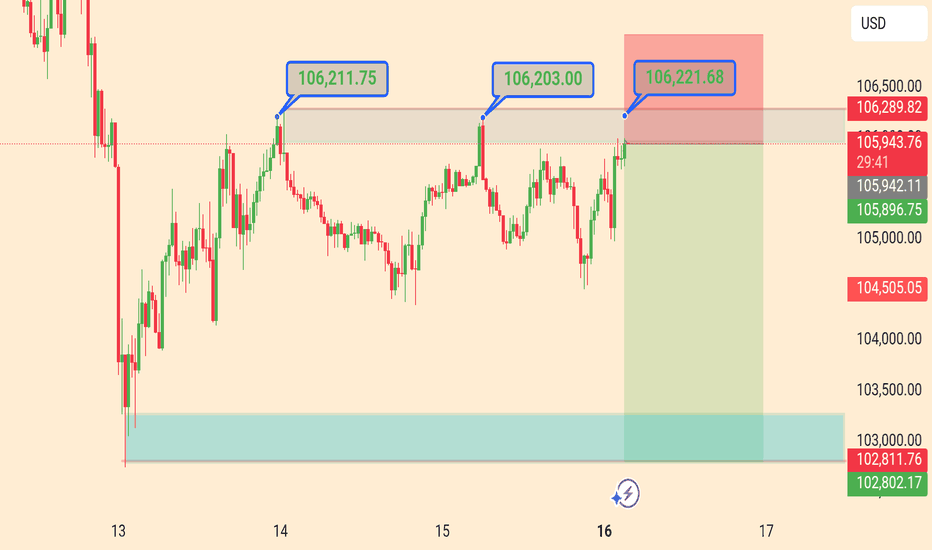
BTC Short. Its time to correctionStrong Sell Limits sitting at our entry level!
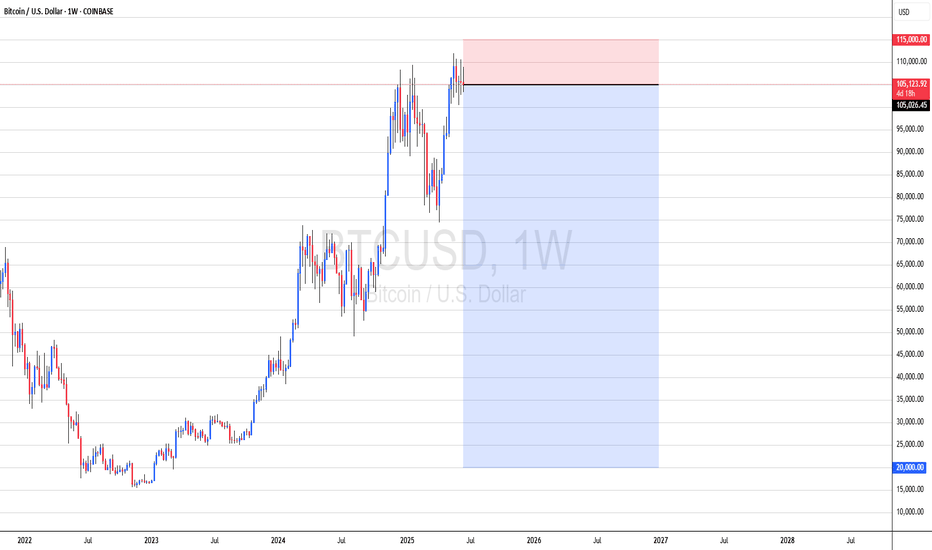
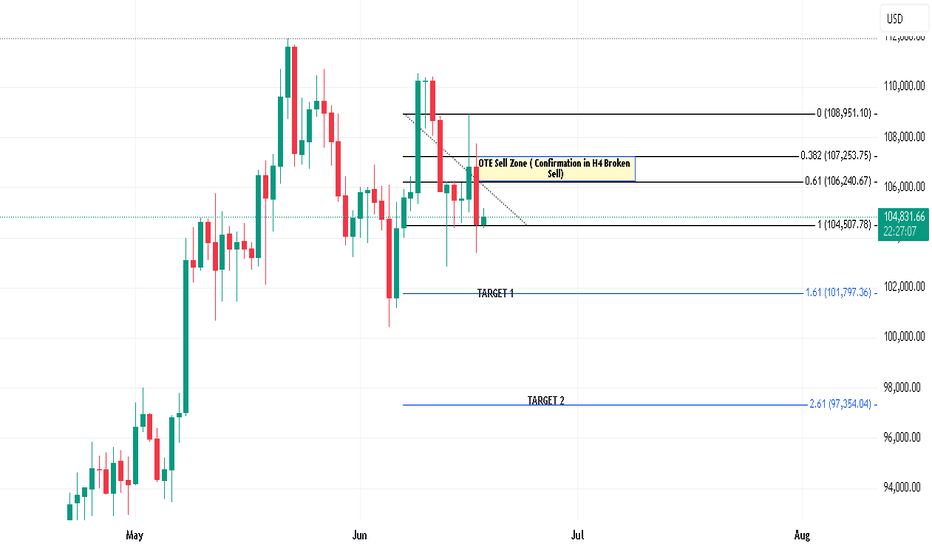
SELL LIMIT / SWING TRADE
ENTRY: 106106.3
SL: 109676.8
TP: 93409.1
Bearish trend is active and this would be the time for correction and even maybe for 91350 gap close .
Join our free DC group for more and faster news about market. Forex,Crypto,Stocks - Fifteenmin crypto group. Dm me if you enjoy this idea.
BTCUSD.PI trade ideas
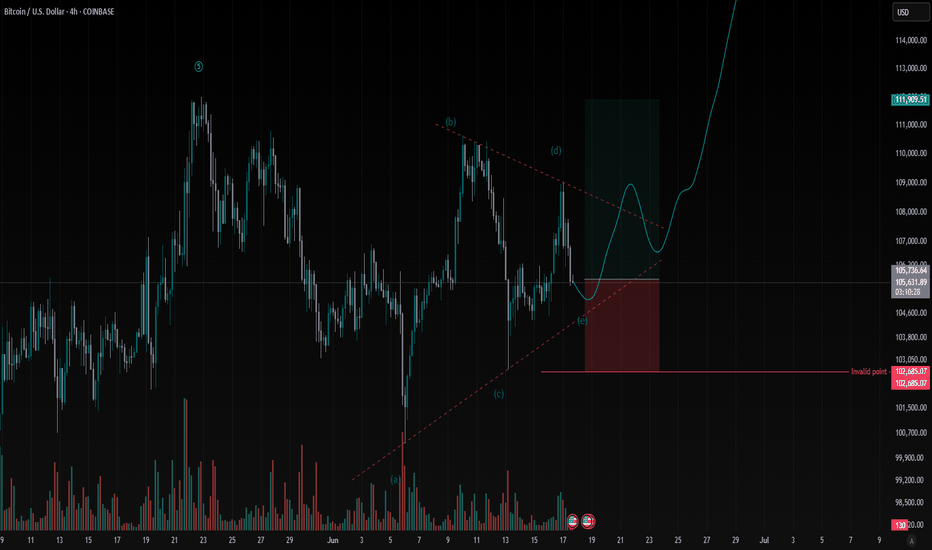
BTC 4H: Triangle Breakout - Next Leg Up?Bitcoin (BTC/USD): 4H Triangle Breakout Signals Bullish Continuation
Hello TradingView,
On the 4-Hour (4H) timeframe, Bitcoin has convincingly completed a significant triangle consolidation pattern. This pattern, which typically signals a build-up of energy, has now resolved with a clear bullish breakout.
The price action over the last few days has been coiling, and we're now seeing strong confirmation as BTC pushes decisively above the triangle's upper trendline, ideally supported by robust volume. This indicates that the recent period of indecision has ended, and bulls are regaining control, setting the stage for the next upward move.
Crucial Invalidation Point: For this bullish setup to remain valid, Bitcoin must firmly hold above $102,664.54. A sustained close below this level on the 4H chart would invalidate our thesis and suggest that a deeper correction or re-evaluation is needed.
Outlook: With the breakout confirmed, we anticipate a push towards immediate resistance levels and potentially a retest of recent higher price points. Always manage your risk, and happy trading!
⚠️ Disclaimer:
Not financial advice. For educational and informational purposes only.
Do your own research (DYOR). Trading involves substantial risk; you can lose money.
Past performance is not indicative of future results.
Bitcoin Strategic Compression, ETF Inflows and Powell’s Shadow.⊢
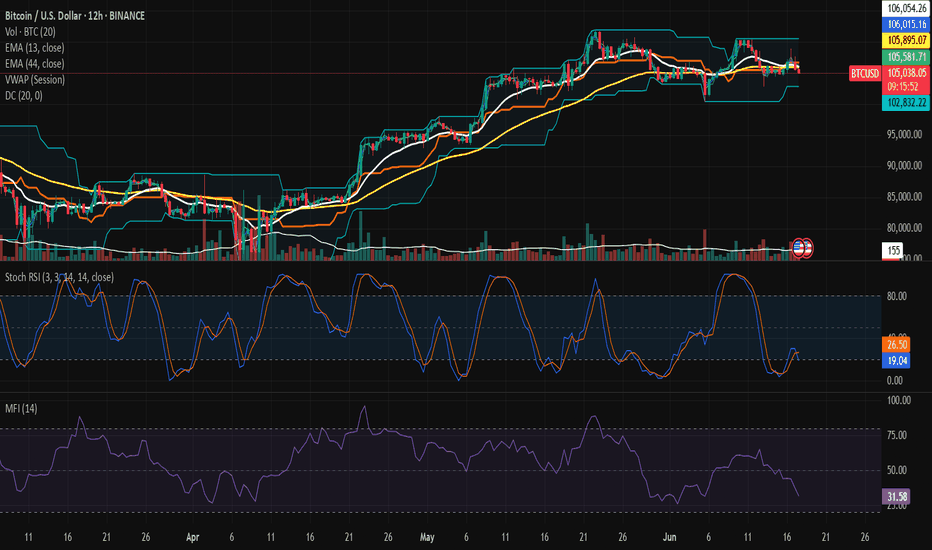
⟁ BTC/USD - Binance - (CHART: 12H) - (June 17, 2025).
⟐ Analysis Price: $105,324.51.
⊢
⨀ I. Temporal Axis – Strategic Interval – (12H):
▦ EMA13 – ($106,094.47):
∴ The arcane speed line was briefly reclaimed but lost again in the latest candle close;
∴ Price has consistently failed to close above EMA13 since June 13th, indicating weakening momentum;
∴ It now acts as primary dynamic resistance in the 12H structure.
✴️ Conclusion: EMA13 has been rejected. Bearish pressure remains in control.
⊢
▦ EMA44 – ($105,907.07):
∴ Price is currently below EMA44, though recent candles show no strong bearish conviction;
∴ This level functions as a neutral battleground - a true trend emerges only with decisive close above or below;
∴ The slope remains positive, preventing immediate breakdown.
✴️ Conclusion: EMA44 is the structural balance line. Below it, weakness persists.
⊢
▦ VWAP (Session) – ($106,117.67):
∴ VWAP sits above current price, reflecting rejection of institutional value;
∴ All recent attempts to reclaim VWAP failed, signaling lack of dominant buy-side volume;
∴ Confluence with EMA13 and Donchian upper band creates a unified technical ceiling.
✴️ Conclusion: Institutional control remains absent. Value zone denied.
⊢
▦ Donchian Channel (20) – ($106,690.95 / $102,854.49):
∴ Bands remain narrow, and price consolidates between mid-channel and the lower range;
∴ Upper band has been precisely respected for multiple sessions;
∴ This signals imminent volatility release from compression.
✴️ Conclusion: Volatility is fully compressed. Expansion is near.
⊢
▦ Volume - (MA20: 154):
∴ Volume remains below the 20-period moving average;
∴ No strong buying or selling pressure confirms indecision;
∴ Market stands in strategic silence.
✴️ Conclusion: Low activity zone. Observation mode prevails.
⊢
▦ Stoch RSI (3,3,14,14) – (21.38 / 27.27):
∴ Oscillator is crossing upward from oversold, but with weak momentum;
∴ Attempt to recover above 40 still incomplete;
∴ Risk of fakeout unless next candle confirms with bullish volume.
✴️ Conclusion: Reversal signal is weak. Watch for trap conditions.
⊢
▦ MFI (14) – (31.86):
∴ Money flow index stays in low liquidity zone - no signs of accumulation from large players;
∴ No clear bullish divergence, yet no panic selloff either;
∴ The flat trajectory since June 10 confirms institutional disengagement.
✴️ Conclusion: Capital remains cautious. No inflow to trigger reversal.
⊢
🜎 Strategic Insight — Technical Oracle:
∴ Indicators show compression, rejection at $106K and lack of institutional momentum;
∴ Price structure is neutral-bearish with volume confirming indecision;
∴ A breakout would only be valid with strong candle body and +180 BTC/12H volume.
✴️ Conclusion: Tactical patience advised. Await true breakout with confirmation.
⊢
∫ III. On-Chain Intelligence – (Source: CryptoQuant):
▦ Exchange Inflow Total – (All Exchanges):
∴ Total BTC inflows remain below 10K/day, well beneath panic thresholds;
∴ No spikes above 50K BTC since early April - aligns with neutral market conditions;
∴ This reflects dormant whale behavior and no visible distribution phase.
✴️ Conclusion: The market is in structural silence. No signs of capitulation.
⊢
▦ Exchange Inflow Mean = (MA7) – (All Exchanges):
∴ The 7-day moving average of inflow size dropped to ~0.4 BTC - a historic low;
∴ Indicates retail-dominant transactions, not whales;
∴ Precedents show this pattern often occurs before breakout events.
✴️ Conclusion: Institutional wallets remain inactive. Momentum awaits external ignition.
⊢
▦ Spot Taker CVD - (Cumulative Volume Delta, 90-day):
∴ Buyers still hold slight dominance, but the curve is flattening;
∴ This signals demand exhaustion and growing equilibrium;
∴ Historically precedes redistribution or longer sideways action.
✴️ Conclusion: Spot market is neutralizing. Demand fades. No clear strength.
⊢
🜎 Strategic Insight - On-Chain Oracle:
∴ All on-chain indicators confirm weak momentum, low inflows, and diminishing spot demand;
∴ There’s no signal of heavy sell pressure - but also no engine for rally;
∴ This is the seal of silence: light flows, thin volume, no imbalance.
✴️ Conclusion: Market waits for external driver. Watch for catalyst.
⊢
⧉ IV. Contextvs Macro–Geopoliticvs – Interflux Economicus:
▦ Middle East Tensions – Israel / Iran:
∴ Dow and S&P futures drop as evacuation alerts from Tehran raise global concern - (InfoMoney);
∴ Crude oil rises up to +2% - markets brace for supply disruption via Hormuz - (CryptoSlate);
∴ Global capital flows to Treasuries and gold, reducing liquidity in risk-on assets like BTC.
✴️ Conclusion: Geopolitical risk increases macro fear. Bitcoin faces risk-off inertia.
⊢
▦ ETF Activity vs Macro Outlook:
∴ Despite $1.7B ETF inflows last week, price failed to hold key resistances - (CryptoSlate);
∴ This divergence reflects growing fear and fragile confidence in crypto exposure amid global tension;
∴ Institutional demand is present, but impact is diluted by macro noise.
✴️ Conclusion: ETF flows bring no clear edge under macro instability.
⊢
▦ Fed Chair Powell (Upcoming):
∴ Jerome Powell will speak on June 19 - expected to comment on rate pause and forward guidance - (Cointelegraph);
∴ Retail data weakens U.S. outlook, but Fed’s stance remains cautious - (FXStreet);
∴ The speech will likely reset volatility across all assets.
✴️ Conclusion: Powell’s message is the next global pivot point. Market waits.
⊢
⚜️ 𝟙⟠ Magister Arcanvm – Vox Primordialis!
⚖️ Wisdom begins in silence. Precision unfolds in strategy.
⊢
⊢
⌘ Codicillus Silentii – Strategic Note:
The current bias is neutral with a bearish weight;
No validated entry present at this time;
Volume must confirm any breakout attempt;
The Seal of Silence remains active - we watch, not react.
⊢
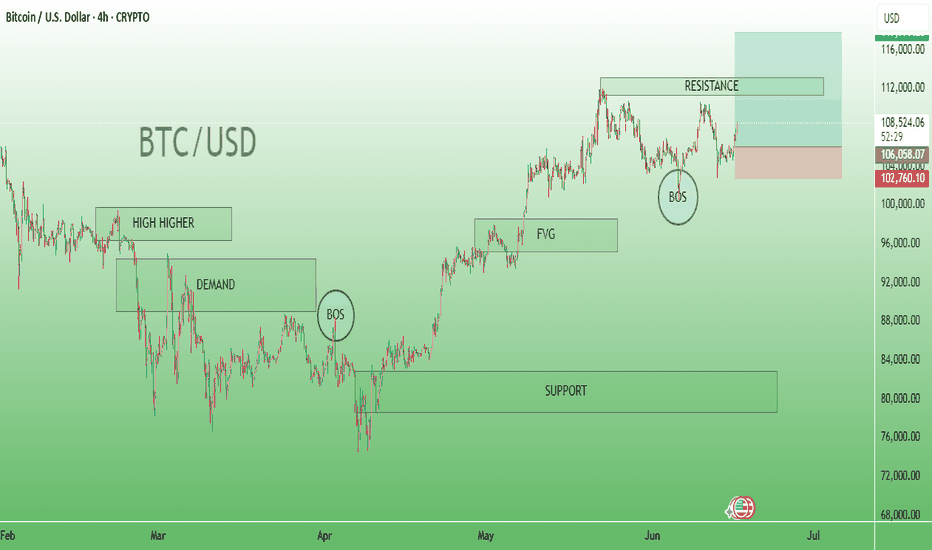
BTC/USD Likely a bullish order block or accumulation zone.Price Action: The market is in a downward correction after hitting a resistance area.
---
📊 Key Marked Zones and Concepts
1. High Higher (Left Side):
Indicates previous higher high formed in an uptrend structure.
2. Demand Zone (Below High):
Area where buyers previously stepped in strongly.
Likely a bullish order block or accumulation zone.
3. BOS (Break of Structure):
Two BOS points are marked, confirming market structure breaks:
Left BOS: Marks transition from uptrend to a possible downtrend.
Right BOS: Confirms shift again or continuation of downward correction.
4. FVG (Fair Value Gap):
Indicates an imbalance in price action.
Price may revisit this zone to "fill the gap."
5. Resistance (Top Right):
Price reached this level and is rejecting downward.
Could be a short-entry zone, as indicated by the red-to-green risk box (risk-to-reward trade setup).
6. Support (Bottom):
A larger green support block exists far below current price (~$91,000–$82,000).
Possibly a target area for longer-term bears.
---
🎯 Trade Setup Visible
Short Position Active:
Entry near resistance zone (~108K–110K).
Stop-loss above resistance (~115K).
Take-profit near $102,760 or lower, aligned with BOS and demand area.
---
🧠 Interpretation
This analysis shows that:
The trader expects BTC to drop from the resistance zone.
The bearish BOS and FVG support a retracement or reversal.
Targeting a deeper correction toward support or earlier demand zones.
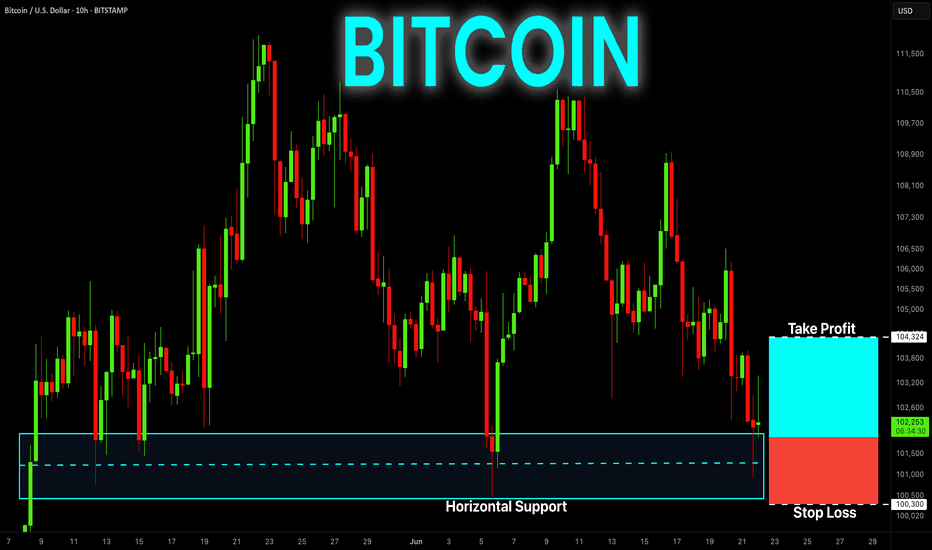
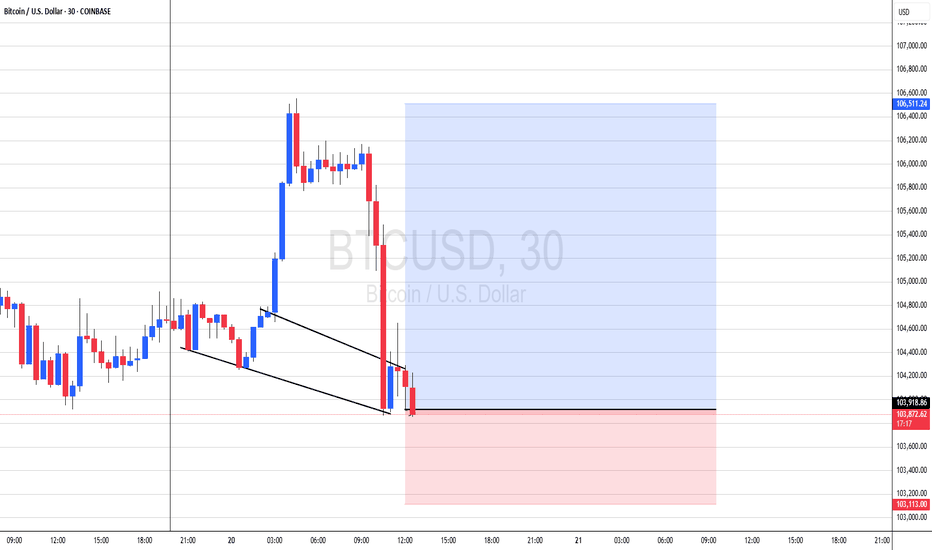
BITCOIN Free Signal! Buy!
Hello,Traders!
BITCOIN is retesting a
Horizontal support level
Around 101,288$ from
Where we will be expecting
A local rebound so we can
Go long with the Take Profit
Of 104,324$ and the Stop
Loss of 100,300$
Buy!
Comment and subscribe to help us grow!
Check out other forecasts below too!
Disclosure: I am part of Trade Nation's Influencer program and receive a monthly fee for using their TradingView charts in my analysis.
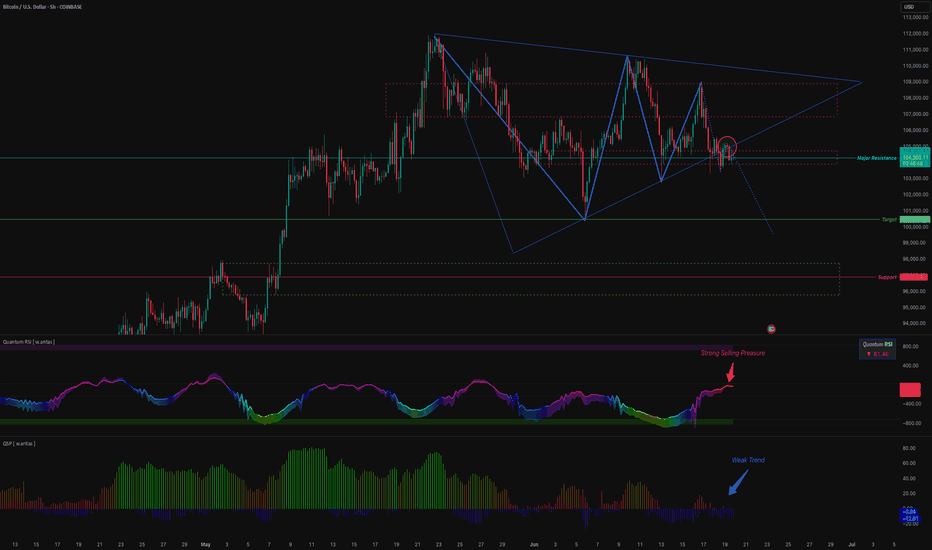
BTC Triangle Squeezing Toward $100 K — Sellers Press🎯 TL;DR
A four-week contracting triangle is coiling price just under $105 K.
Measured move ⇒ $100 506
Both W.ARITAS Quantum RSI flash strong selling pressure while QSP shows a weak trend.
On-chain: miners dumped ≈30 000 BTC since late May, yet spot-ETF inflows have stayed positive eight days straight.
Base case: price breaks lower into $100 K-97 K, where I expect a sharp bounce.
🗺️ Chart at a Glance
Element Detail
Pattern Symmetrical / contracting triangle (late-Apr → present)
Immediate pivot $104 800 – reclaimed as resistance (red circle)
Target 1 $100 506 – triangle measured move
Demand block $96 900 – $95 000 – weekly support & June VWAP
Invalidation 6-h close > $106 000
🔧 Technical Internals
Momentum 🟣
Quantum RSI: −23 / −41 and falling → sellers dominate.
QSP: muted blue histogram sub-zero → trend itself is still weak, so expect whipsaws near support.
Structure 🔵
Three successive lower-highs (113 K → 110 K → 109 K) tighten the squeeze.
Price is riding the underside of the triangle, a common “kiss-of-death” before resolution.
🔍 Fundamental / Flow Backdrop
Miners on the offer – Wallet balances down ~30 000 BTC over 20 days (≈ $3.1 B)
Source: IntoTheBlock via CoinDesk, 19 Jun 2025
ETF demand refuses to quit – U.S. spot ETFs pulled $388.3 M on 18 Jun, marking 8 consecutive inflow days
Source: CoinTelegraph, Cryptonomist, 19 Jun 2025
Regulatory clarity incoming – U.S. Senate passed a bipartisan stablecoin bill on 17 Jun; House vote next
Source: Reuters, 17 Jun 2025
Net: structural sellers (miners, profit-takers) vs. structural buyers (ETFs).
Right now, technicals side with the sellers.
📈 Trade Map (3-8 Week Horizon)
106 000 – 104 800 Triangle top & failed breakout zone Bias flips bullish only on sustained reclaim
100 506 Measured-move target + psychological $100 K Primary TP / bounce watch
96 900 – 95 000 Weekly demand, June VWAP Secondary TP if 100 K gives way
110 000 + Pattern invalidation Opens road to 113 K-115 K ATH cluster
🛠️ Execution Idea (Not Financial Advice)
Trigger: 6-hour close < $103 500 confirms breakdown.
Entry Bias: Short retest of 104.8 K-105.5 K.
Targets:
TP1 – $100 500
TP2 – $97 000 (only if momentum stays bearish)
Stop / Invalidation: 6-hour close > $106 000 and Quantum RSI flips back to green.
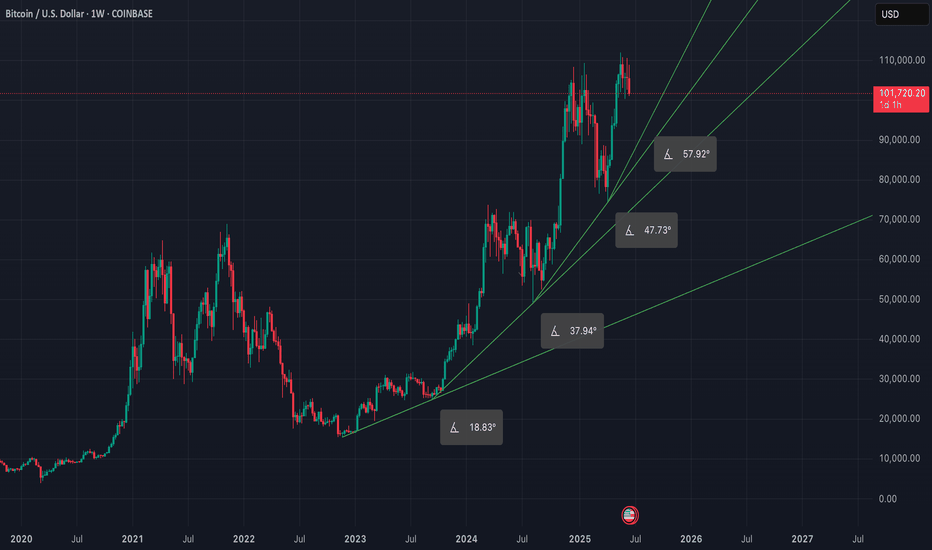
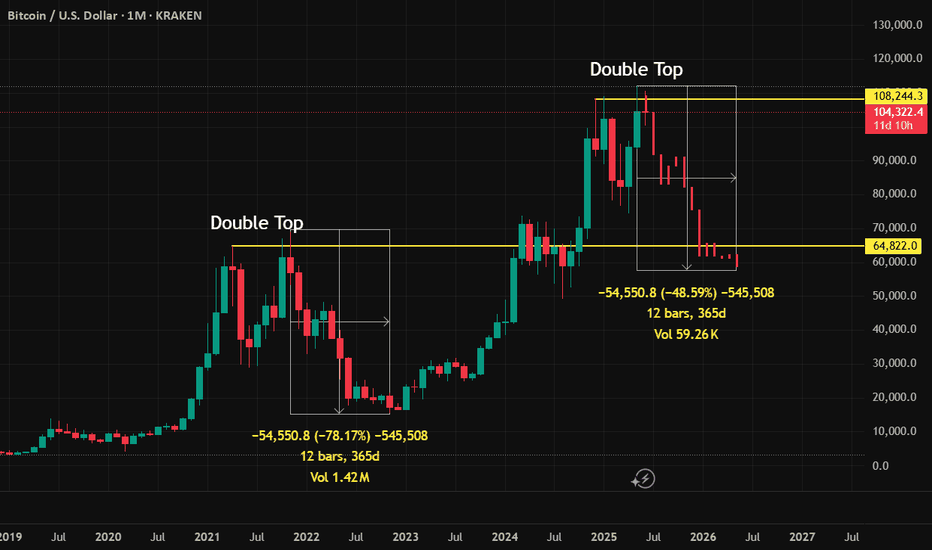
Long term parabola setting up on weeklyJust a reminder to zoom out and observe the weekly trend. Even though on a daily basis it may seem we are grinding sideways, if we look at the weekly the trend is getting steeper and steeper, if this holds up we're not far away from starting a huge parabolic move.
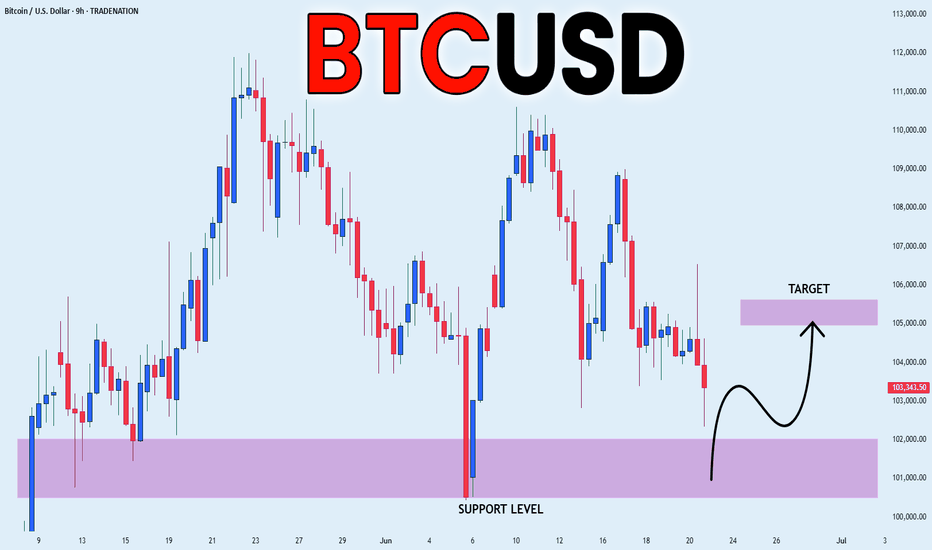
BITCOIN SUPPORT AHEAD|LONG|
✅BITCOIN is set to retest a
Strong support level below at 101,000$
After trading in a local downtrend for some time
Which makes a bullish rebound a likely scenario
With the target being a local resistance above at 105,000$
LONG🚀
✅Like and subscribe to never miss a new idea!✅
Disclosure: I am part of Trade Nation's Influencer program and receive a monthly fee for using their TradingView charts in my analysis.
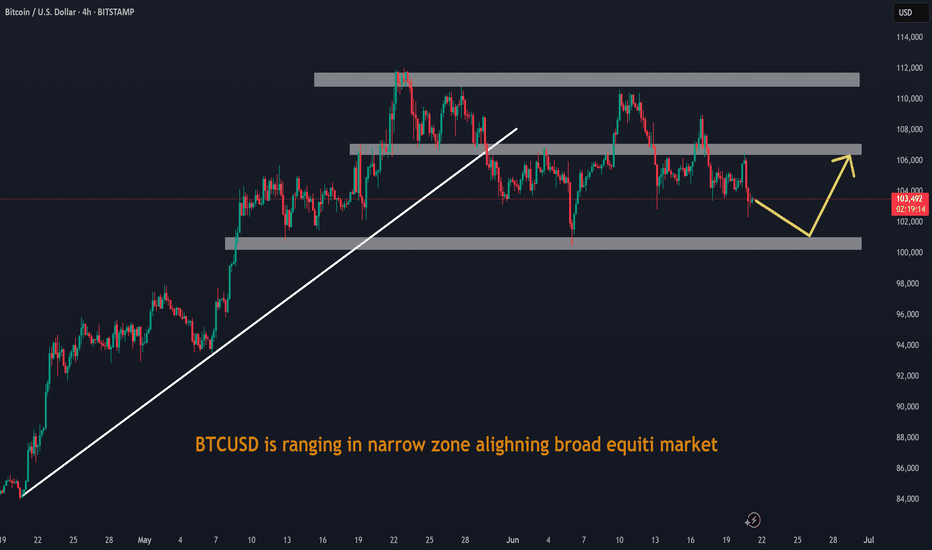
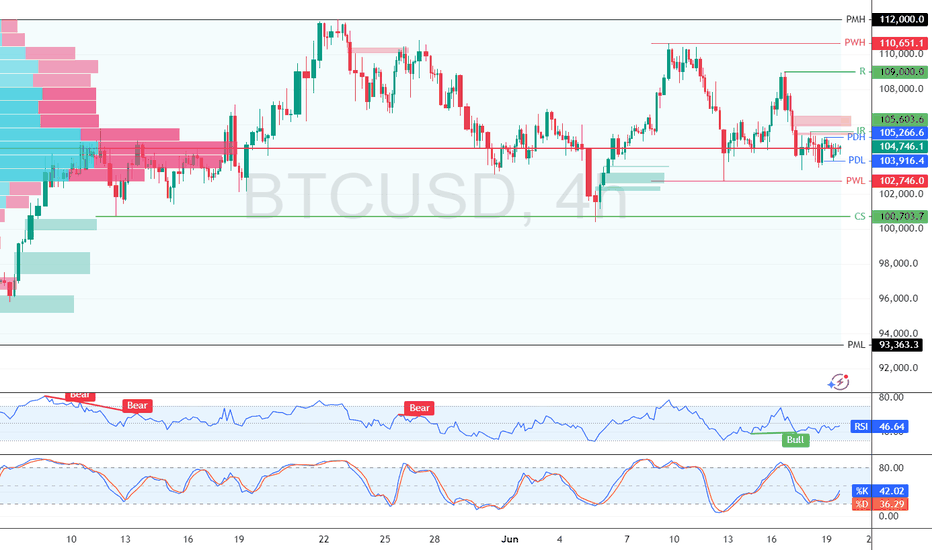
Bitcoin Consolidates Liquidity Around $105,000FenzoFx—Bitcoin is trading sideways near $104,650 after a sharp drop from $109,000, forming a high-liquidity zone with potential for a breakout.
The $102,746–105,266 range shows strong accumulation, offering support. BTC remains bullish above the previous week's low, but must close above the previous day's high to resume its uptrend.
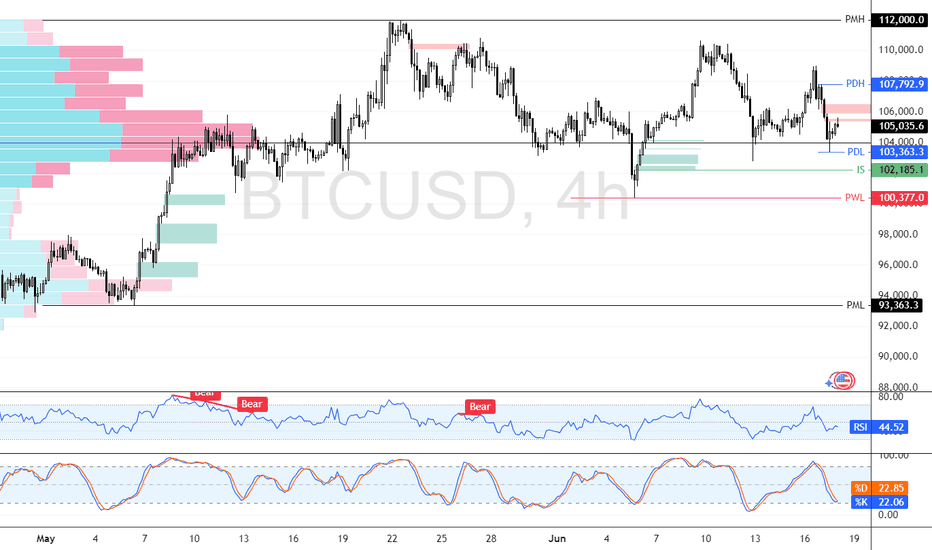
Bitcoin Bounced from a High-Volume Area at the 103,363 Support.FenzoFx—Bitcoin dipped to $105,175, creating a bearish fair value gap that highlights selling pressure. Immediate support is at $103,463, backed by high volume, while resistance stands at $107,792. If support holds, BTC/USD could rise toward $112,000.
A drop below $102,185 may accelerate the downtrend toward $93,363, the previous monthly low.
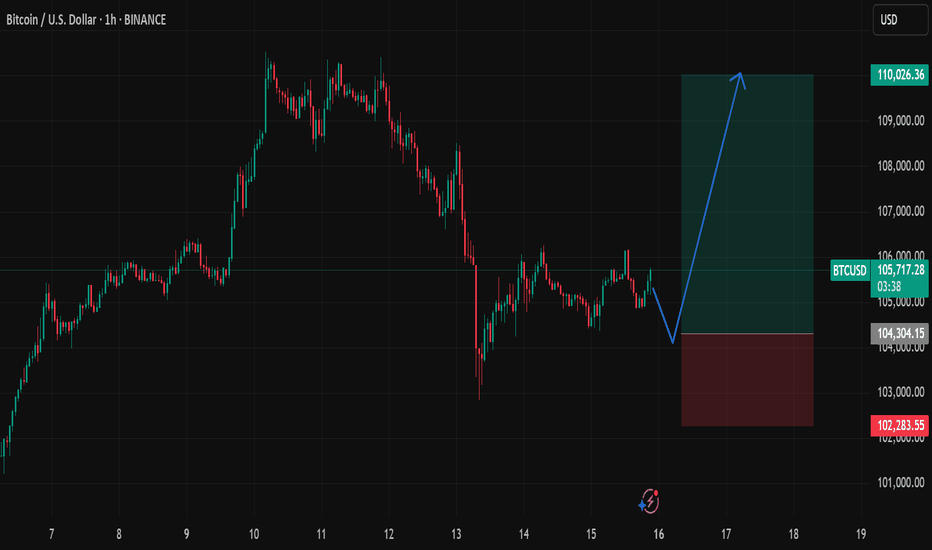
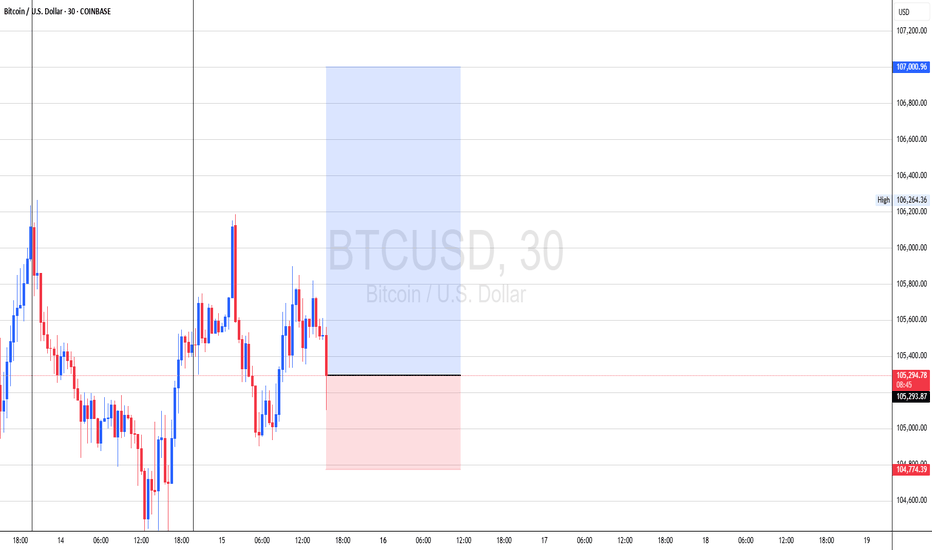
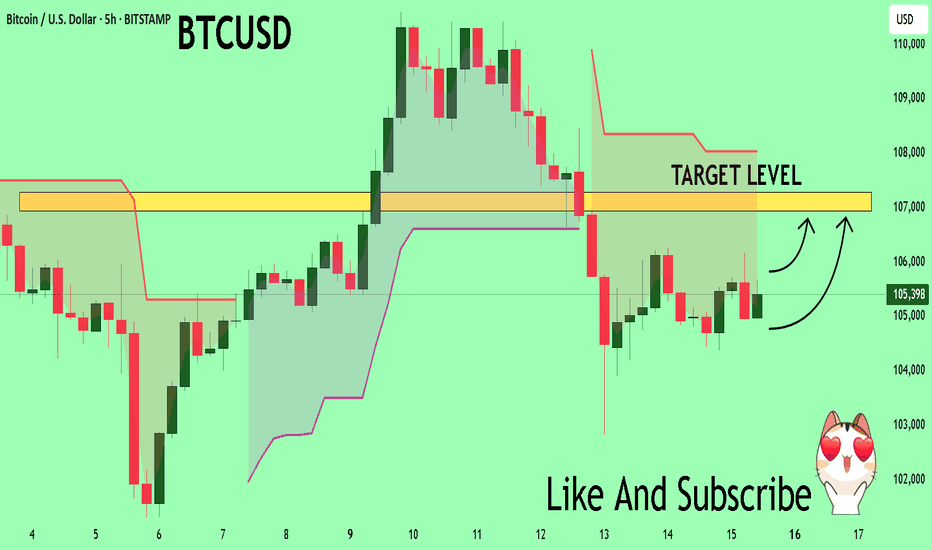
BTCUSD Expected Growth! BUY!
My dear friends,
Please, find my technical outlook for BTCUSD below:
The price is coiling around a solid key level - 10537
Bias - Bullish
Technical Indicators: Pivot Points Low anticipates a potential price reversal.
Super trend shows a clear buy, giving a perfect indicators' convergence.
Goal - 10693
About Used Indicators:
The pivot point itself is simply the average of the high, low and closing prices from the previous trading day.
Disclosure: I am part of Trade Nation's Influencer program and receive a monthly fee for using their TradingView charts in my analysis.
———————————
WISH YOU ALL LUCK
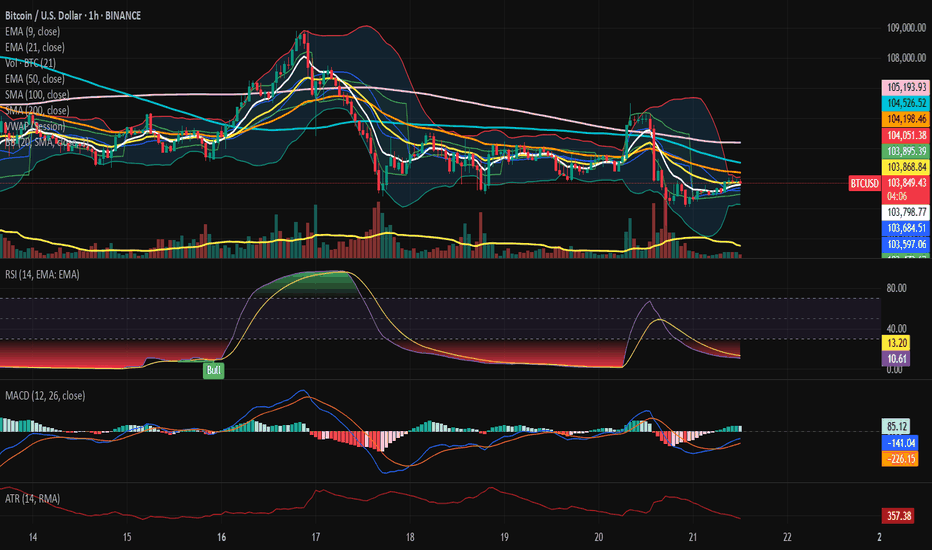
Bitcoin – Ritual Latency & Tactical Tension.⊢
⟁ BTC/USD – Binance – (CHART: 1H) – (June 21, 2025).
⟐ Analysis Price: $103,909.52.
⊢
⨀ I. Temporal Axis – Strategic Interval – (H1):
▦ EMA9 – ($103,783.82):
∴ The price oscillates around EMA9 with marginal bullish slope;
∴ Two candle rejections confirmed the EMA9 as a reactive short-term axis;
∴ Current close is above, but lacking directional follow-through.
✴️ Conclusion: Momentum attempt, yet unsupported – fragility persists.
⊢
▦ EMA21 – ($103,869.74):
∴ Flattened trajectory overlapping EMA9;
∴ Indicates tactical compression – a latency band rather than trendline;
∴ No breakout confirmation.
✴️ Conclusion: Equilibrium zone – direction undecided.
⊢
▦ EMA50 – ($104,212.18):
∴ Serves as immediate dynamic resistance;
∴ Price has not closed above since June 20, 13:00 UTC;
∴ Requires sustained move to invalidate micro-downtrend.
✴️ Conclusion: Key reversal barrier – price remains below structural trigger.
⊢
▦ SMA100 – ($104,552.65):
∴ Downsloping, acting as mid-term ceiling;
∴ No candle engagement in recent sessions;
∴ Confluence zone with EMA50 adds density.
✴️ Conclusion: Inertial resistance zone – trend continuity until breach.
⊢
▦ SMA200 – ($105,197.18):
∴ Highest structural ceiling on H1;
∴ Remains untouched, reinforcing broader tactical bearish bias.
✴️ Conclusion: SMA200 maintains bearish structure – trend remains capped.
⊢
▦ Bollinger Bands - (20,2):
∴ Bands tightened – low volatility configuration;
∴ Upper band slightly expands – minor opening signal;
∴ Price contacts upper range without strength.
✴️ Conclusion: Potential breakout pattern – requires volume ignition.
⊢
▦ RSI (14, smoothed by EMA9) – (11.00 | Avg: 13.85):
∴ RSI at historical low – indicative of exhaustion rather than momentum;
∴ EMA of RSI confirms suppressed structure;
∴ Hidden divergence plausible but not confirmed.
✴️ Conclusion: Latent reversal conditions – needs confirmation from RSI reclaim.
⊢
▦ MACD (12,26,9) – (MACD: 88.35 | Signal: -159.25 | Histogram: -247.60):
∴ Histogram remains negative but is narrowing;
∴ MACD line curling upward, approaching signal;
∴ No crossover yet – early recovery signal under surveillance.
✴️ Conclusion: Bullish divergence forming – reversal not validated.
⊢
▦ ATR (14, RMA) – (372.44):
∴ Volatility decreasing after a local spike;
∴ Range-bound structure indicates compression, not impulse.
✴️ Conclusion: Tactical latency – volatility may reawaken post-volume.
⊢
▦ Volume (21):
∴ Faint increase in last bullish candle – still below strategic threshold;
∴ Lacks institutional confirmation.
✴️ Conclusion: Spot activity insufficient – neutral, vulnerable structure.
⊢
🜎 Strategic Insight – Technical Oracle:
∴ H1 presents structural compression between EMA9/21/50, confirming tactical latency;
∴ RSI at deep oversold – signal of exhaustion, not yet momentum;
∴ Bollinger and MACD show early signs of kinetic preparation;
∴ The market is postured, not reactive – awaiting a directional event.
✴️ Tactical View: Structurally Neutral – Momentum Suspended, entry only upon RSI/Volume confirmation and MACD validation.
⊢
∫ II. On-Chain Intelligence – (Source: CryptoQuant):
∴ Update as of June 21, 2025 – Synchronized to H1 Structural Reading.
▦ Exchange Netflow Total – (All Exchanges) – (+692 BTC):
∴ Positive net inflow detected over 24h;
∴ Suggests moderate sell-side liquidity entering exchanges;
∴ Reflects defensive posturing, not panic-driven behavior.
✴️ Conclusion: Mild bearish pressure – not sufficient to invalidate structural base.
⊢
▦ Spot Taker CVD - (Cumulative Volume Delta, 90-day):
∴ Dominance of Taker Sell Volume confirmed – aggressive sellers remain in control;
∴ Pattern consistent over the last 6 sessions;
∴ No divergence between volume behavior and price structure.
✴️ Conclusion: Market remains tactically sell-biased – momentum driven by taker aggression.
⊢
▦ Spent Output Profit Ratio (SOPR) – (1.009):
∴ Marginally above 1.00 – coins being spent in mild profit;
∴ Absence of capitulation, but also no sign of deep conviction among holders;
∴ Stable rotation, not breakout-driven.
✴️ Conclusion: Structural neutrality – market is churning without direction.
⊢
▦ Adjusted SOPR (aSOPR) – (≈1.00):
∴ Flat – confirms lack of distribution or panic;
∴ Historically aligns with consolidation regimes.
✴️ Conclusion: Supply behavior is balanced – trend-neutral reading.
⊢
▦ Open Interest – All Exchanges – ($34.01B):
∴ Remains elevated – indicative of speculative leverage;
∴ Elevated risk of liquidation cascade on directional volatility;
∴ OI rising faster than spot volume = synthetic exposure dominating.
✴️ Conclusion: Market structurally exposed – fragile to external triggers.
⊢
▦ Funding Rate – All Exchanges – (-0.003):
∴ Slightly negative – shorts funding longs;
∴ Suggests bearish bias among leveraged participants;
∴ Conditions ripe for short squeeze if spot demand increases.
✴️ Conclusion: Contrarian setup building – tactical upside risk exists.
⊢
🜎 Strategic Insight – On-Chain Oracle:
∴ Metrics reflect a market under cautious speculative tension;
∴ No broad liquidation, no long-term holder exit – base intact;
∴ Taker dominance and leverage build-up suggest reactive positioning;
∴ System is neutral-leaning fragile – vulnerable to both triggers and traps.
✴️ Tactical Note: "Structurally Stable – Tactically Unsettled"
⊢
⧉ III. Contextvs Macro–Geopoliticvs – Interflux Economicus:
∴ Macro Landscape Reference – June 21, 2025.
▦ United States – Federal Policy & Risk Layer:
∴ Treasury Yield Curve remains slightly positive (+0.44%), removing short-term recession signal;
∴ 10Y yield elevated at 4.42% – reflects sustained inflation resistance and risk demand;
∴ Fed maintains QT stance – no rate cuts expected before September;
∴ Tension with Iran intensifying – military rhetoric entering fiscal discourse.
✴️ Conclusion: U.S. macro acts as compression catalyst – neutral on surface, volatile underneath.
⊢
▦ Strategic Bitcoin Reserve – (Executive Order – Trump):
∴ Recent Executive Order establishes BTC as sovereign asset class;
∴ Adds policy-level legitimacy to institutional accumulation;
∴ Reflects shift from “hedge” to “strategic reserve logic”.
✴️ Conclusion: Structural bull signal – narrative transition confirmed.
⊢
▦ China – Internal Stimulus & Soft Deflation:
∴ PPI negative at -3.3%, Retail Sales up 6.4% – stimulus-driven divergence;
∴ Fiscal revenue declining YTD – systemic drag despite easing;
∴ Not a current volatility driver.
✴️ Conclusion: China is neutral to crypto – reactive, not directive.
⊢
▦ European Union – Disinflation & Monetary Drift:
∴ HICP falls to 1.9%, ECB cuts deposit rate to 2.00%;
∴ PMI Composite < 50 – economic contraction quietly progressing;
∴ Forward guidance hesitant.
✴️ Conclusion: EU remains marginal – supportive for risk, but not catalytic.
⊢
▦ Global Fragmentation & SWIFT Erosion:
∴ Geopolitical blocs continue diverging – dollar-reliant systems weakening;
∴ Bitcoin seen increasingly as transactional hedge in sanctioned environments;
∴ De-dollarization dynamic accelerating.
✴️ Conclusion: Bitcoin positioned as neutral monetary rail – volatility shield and escape valve.
⊢
🜎 Strategic Insight – Interflux Macro Oracle:
∴ U.S. remains the dominant macro variable – its monetary and geopolitical stance defines volatility posture;
∴ Bitcoin structurally benefits from institutional legitimacy, but tactically suspended by risk-off layers;
∴ The system is internally calm, externally tense – volatility is downstream of Powell and geopolitical shock.
⊢
⌘ Codicillus Silentii – Strategic Note:
∴ Temporal structure remains compressed, yet technically reactive;
∴ On-chain behavior supports latent structural integrity, but reveals synthetic tension;
∴ Macro axis introduces dual asymmetry – stability in policy, instability in conflict;
∴ The system is in latency – not due to certainty, but due to mutual hesitation.
⊢
𓂀 Stoic-Structural Interpretation:
▦ Structurally Bullish.
∴ The underlying structure - long-term moving averages, exchange reserves, macro narrative, and holder behavior - remains intact and upward-biased;
∴ There is no technical breakdown or structural disassembly;
∴ It is the silent foundation - the “floor” of the chart remains elevated.
⊢
▦ Tactically Suspended.
∴ Although the structure points to strength, the present moment neither demands nor validates action;
∴ There is no volume, no ignition signal, no confirmation flow;
∴ Thus, the tactic is suspended - the trader (or observer) is in a disciplined state of observation, not execution.
⊢
⧉
⚜️ Magister Arcanvm (𝟙⟠) – Vox Primordialis!
𓂀 Wisdom begins in silence. Precision unfolds in strategy.
⧉
⊢

