BTCUSD.PM trade ideas
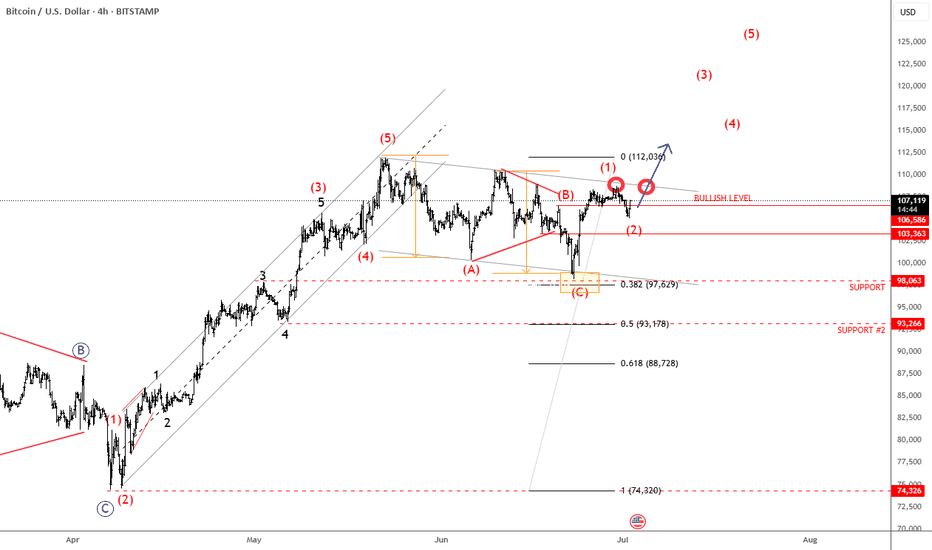
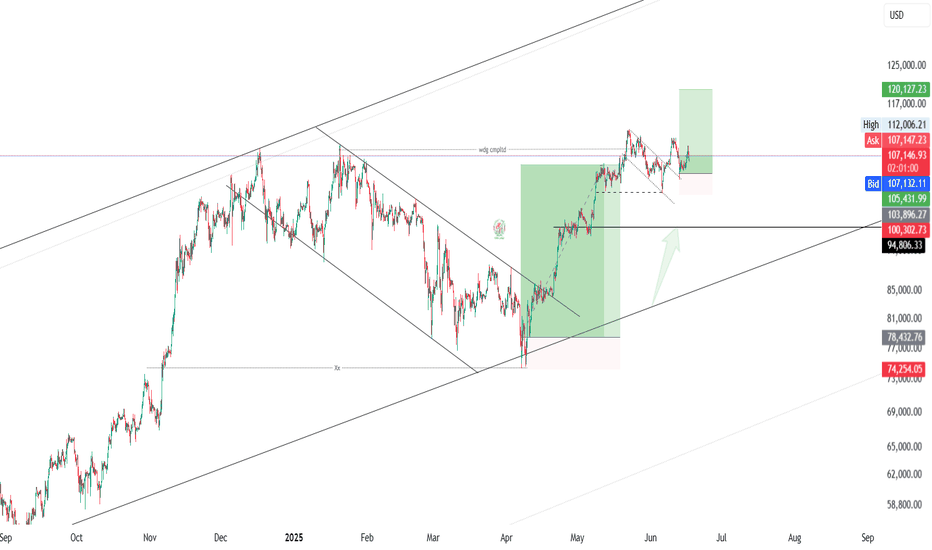
Bitcoin Is Looking For A Bullish ContinuationMorning all! Bitcoin has impulsive characteristics on 4h time frame, and we can clearly see five waves up that can send the price even higher after recent projected ABC correction. With the current impulsive recovery back above 106k area, it confirms that bulls are still here and we should be aware of further rally in July, especially if breaks above channel resistance line near 110k area. Seems like it's in wave (1) of a new five-wave bullish impulse, so after current wave (2) pullback, we can expect more gains within wave (3).
BTC intra?
Hi
Do you know?
www.investopedia.com
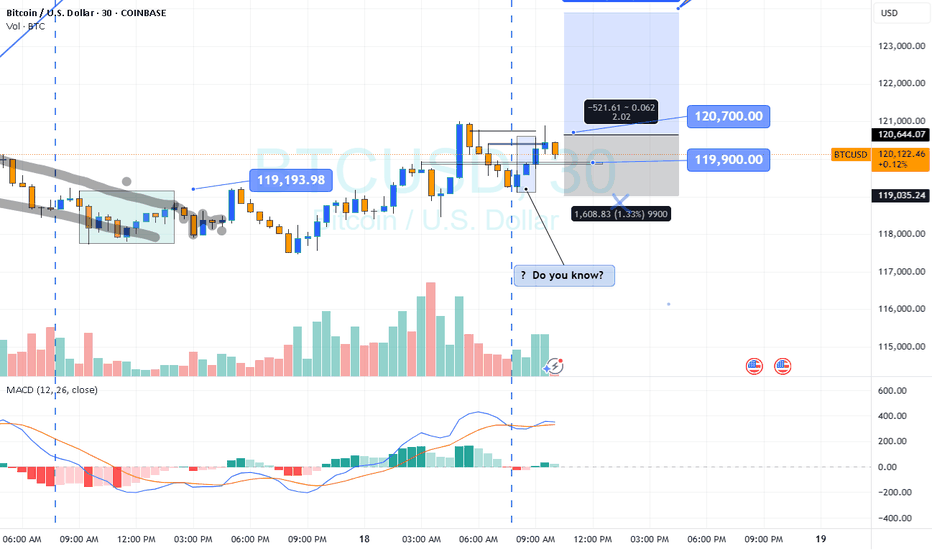
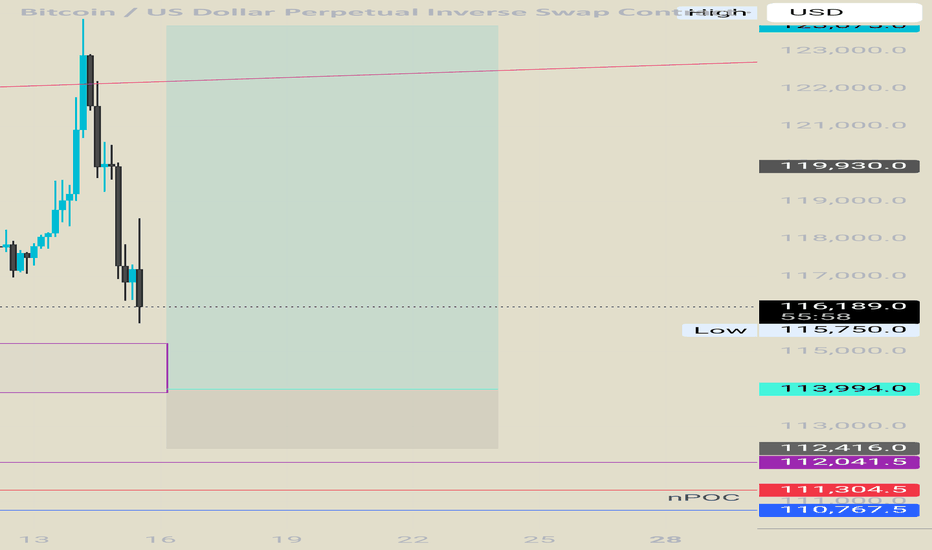
If your initial plan is BUY.. whatever reasons: Fundamental/ outlook buy
We'll take this trade; reason
Two Yeses : Outlook BUY Pattern BUY
How will it react?
Answer: I don't know
High probability : Yes
Where do you enter? Your preference
wait retrace or now... just
If you wait.. might not get the ticket
If calculate between entry and stop loss: pips
And divide by what you re risking in $ to pips
All the best
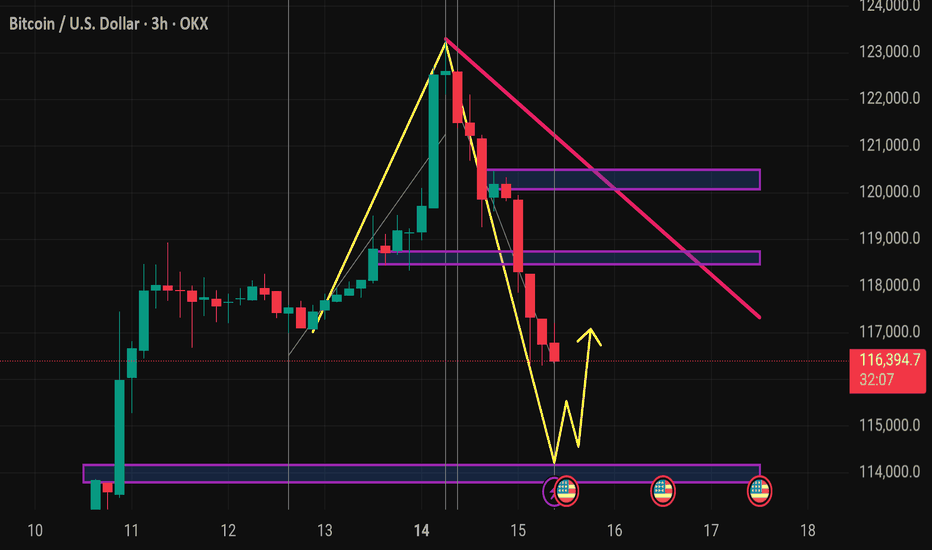
Btcusd techinical analysis.This chart displays the Bitcoin (BTC/USD) 3-hour price action with several technical indicators and patterns annotated. Here's a breakdown of what it shows:
Key Observations:
1. Price Action:
BTC is currently priced around $116,386, showing a -2.93% drop.
A strong downtrend has formed after a significant upward move, possibly forming a bearish ABCD pattern.
2. Harmonic Pattern:
The chart appears to reflect a completed harmonic retracement, with a deep retracement (near 0.88 Fibonacci level).
This suggests a potential reversal or bounce zone.
3. Support & Resistance Zones:
Several purple horizontal boxes indicate key support and resistance zones.
The current price is approaching a major support zone near $114,000–$115,000, which has been tested previously (visible on the left side).
4. Trend Lines:
A pink downward trend line suggests ongoing bearish momentum.
Price may need to break above this line to confirm a reversal.
5. Yellow Zig-Zag Path:
Indicates a possible bullish reversal scenario, predicting a bounce off the lower support zone followed by a move upward.
6. Event Markers:
Red circular icons (with flags) near the support zone hint at upcoming fundamental news/events that may influence price action.
---
Interpretation:
Short-term bias: Bearish until strong support holds (~$114,000–$115,000).
Possible trade setup: Watch for bullish reversal signals at support (candlestick patterns, RSI divergence, etc.) before entering long.
**Risk
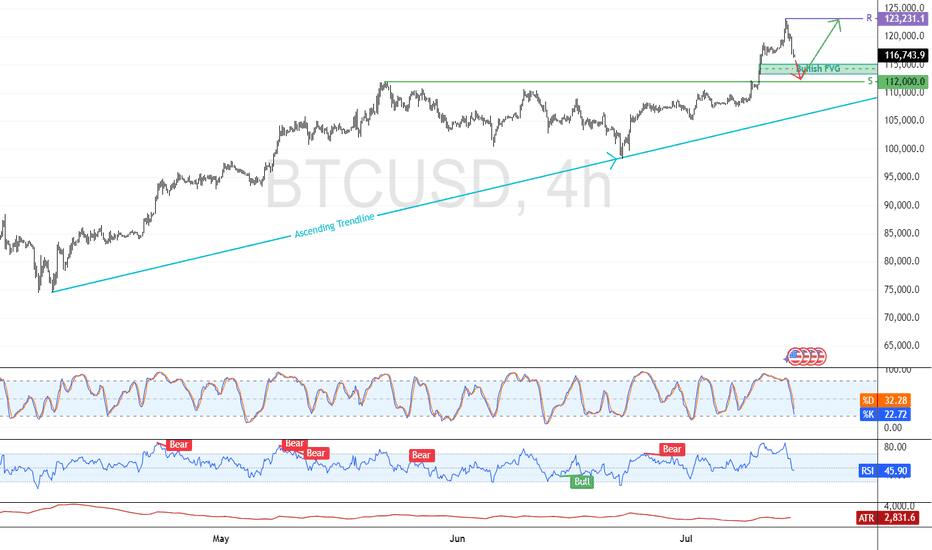
Bitcoin: Support at $112K Holds Key to Bullish ContinuationFenzoFx—Bitcoin is bullish, trading above $112,000.0 after forming a new all-time high at $123,231.0. The current dip may offer a strong reentry if $112,000.0 holds as support, aligning with a bullish fair value gap.
Price remains above the ascending trendline, reinforcing the bullish outlook. If momentum continues and BTC breaks past $123,231.0, the next target could be $130,000.0.
A fall below the trendline would invalidate the bullish setup.
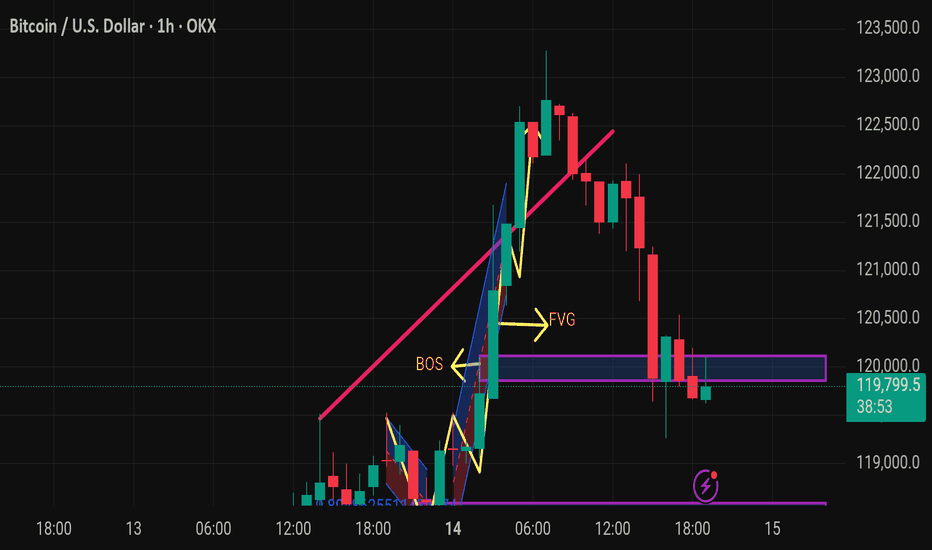
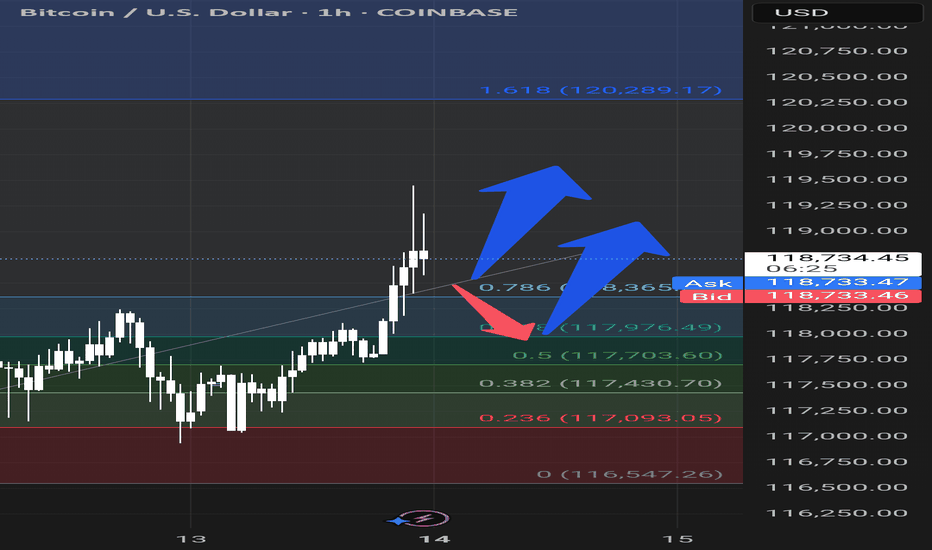
Bitcoin H1 | Potential bounce off a pullback supportBitcoin (BTC/USD) is falling towards a pullback support and could potentially bounce off this level to climb higher.
Buy entry is at 116,469.00 which is a pullback support that aligns closely with the 38.2% Fibonacci retracement.
Stop loss is at 114,600.00 which is a level that lies underneath a swing-low support and the 127.2% Fibonacci extension.
Take profit is at 119,650.00 which is a pullback resistance that aligns with the 50% Fibonacci retracement.
High Risk Investment Warning
Trading Forex/CFDs on margin carries a high level of risk and may not be suitable for all investors. Leverage can work against you.
Stratos Markets Limited (tradu.com ):
CFDs are complex instruments and come with a high risk of losing money rapidly due to leverage. 63% of retail investor accounts lose money when trading CFDs with this provider. You should consider whether you understand how CFDs work and whether you can afford to take the high risk of losing your money.
Stratos Europe Ltd (tradu.com ):
CFDs are complex instruments and come with a high risk of losing money rapidly due to leverage. 63% of retail investor accounts lose money when trading CFDs with this provider. You should consider whether you understand how CFDs work and whether you can afford to take the high risk of losing your money.
Stratos Global LLC (tradu.com ):
Losses can exceed deposits.
Please be advised that the information presented on TradingView is provided to Tradu (‘Company’, ‘we’) by a third-party provider (‘TFA Global Pte Ltd’). Please be reminded that you are solely responsible for the trading decisions on your account. There is a very high degree of risk involved in trading. Any information and/or content is intended entirely for research, educational and informational purposes only and does not constitute investment or consultation advice or investment strategy. The information is not tailored to the investment needs of any specific person and therefore does not involve a consideration of any of the investment objectives, financial situation or needs of any viewer that may receive it. Kindly also note that past performance is not a reliable indicator of future results. Actual results may differ materially from those anticipated in forward-looking or past performance statements. We assume no liability as to the accuracy or completeness of any of the information and/or content provided herein and the Company cannot be held responsible for any omission, mistake nor for any loss or damage including without limitation to any loss of profit which may arise from reliance on any information supplied by TFA Global Pte Ltd.
The speaker(s) is neither an employee, agent nor representative of Tradu and is therefore acting independently. The opinions given are their own, constitute general market commentary, and do not constitute the opinion or advice of Tradu or any form of personal or investment advice. Tradu neither endorses nor guarantees offerings of third-party speakers, nor is Tradu responsible for the content, veracity or opinions of third-party speakers, presenters or participants.
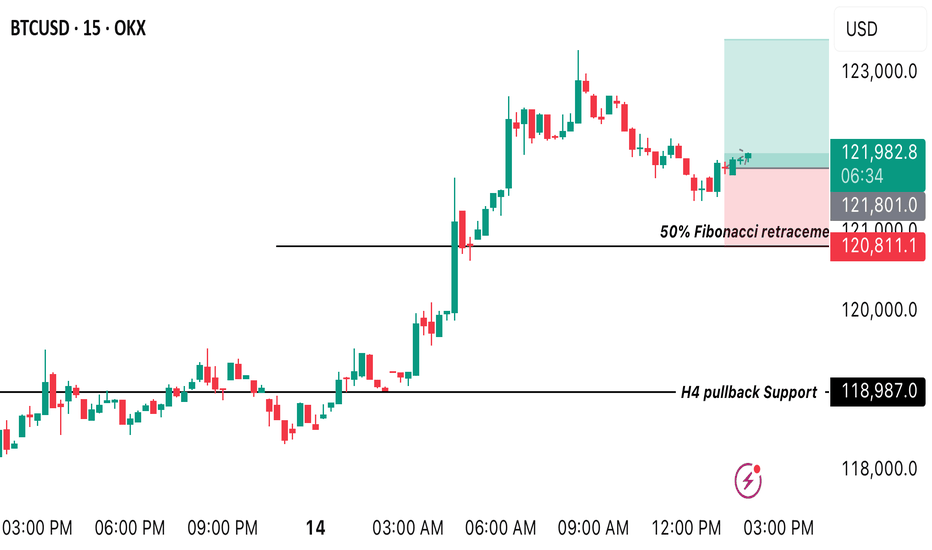
BTC/USD BUY OPPORTUNITY We’re looking at the market structures BTC is making from the M15 timeframe and we can spot a nice buy opportunity around the 38.2% fibo retracement of the recent impulse like pattern created in H4 I still believe price is going to trade bullish up onto $123419 A buy opportunity is envisaged from the current market price.
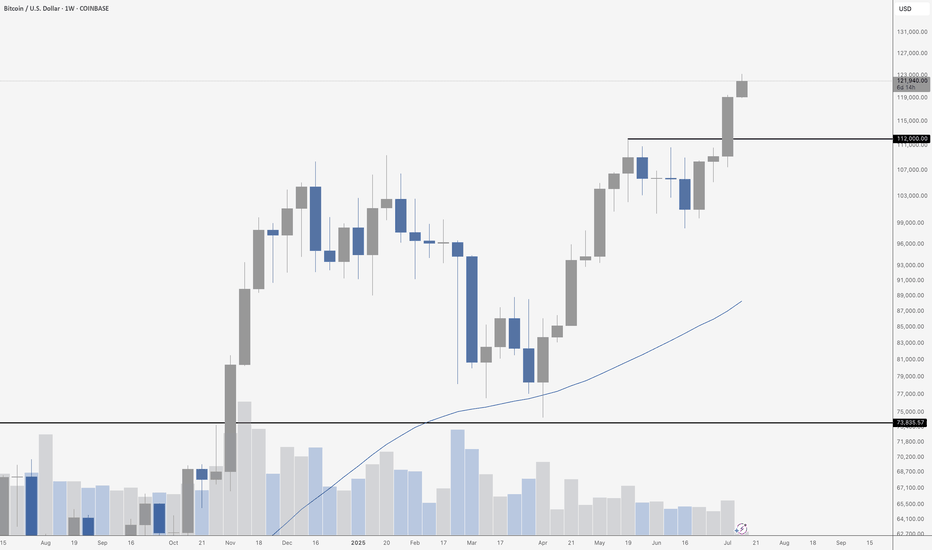
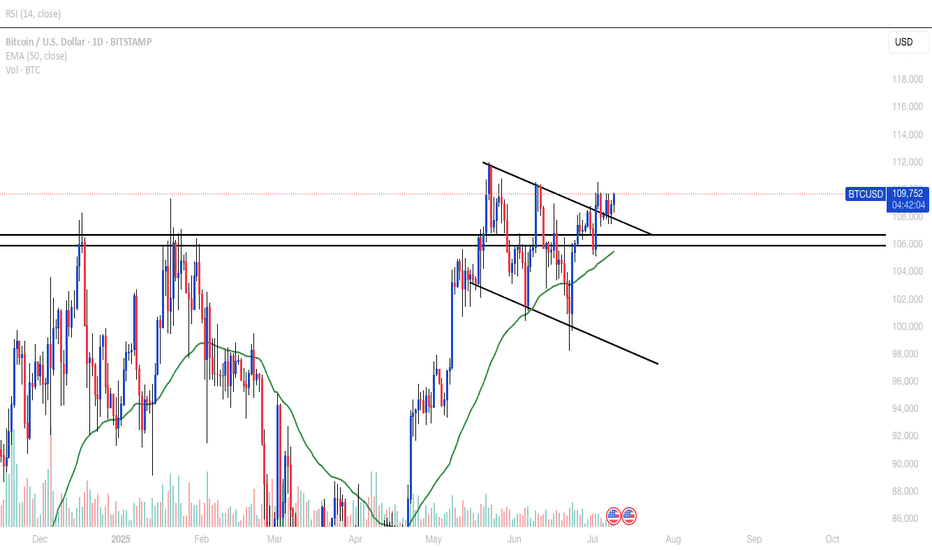
Bitcoin's Blue SkyBitcoin just closed another weekly candle near its highs – and this one confirmed what the last few were hinting at: the bulls are fully in charge. Price exploded through the \$112,000 resistance level, turned it into support, and barely looked back. The move wasn’t subtle either – it was loud, confident, and backed by a strong candle with virtually no upper wick. That tells you all you need to know: there’s no hesitation here, just buyers pushing price higher. If this were a poker game, Bitcoin just went all-in on momentum, and no one at the table seems brave enough to call its bluff.
Even more impressive is how clean the breakout structure looks. After consolidating under \$112K for weeks, BTC finally made its move, leaving behind a textbook support/resistance flip. As long as that zone holds, the path of least resistance is clearly up. There’s no major historical resistance overhead, which means we’re officially in price discovery – that magical place where technicals matter less and raw sentiment takes the wheel. The music is playing, and Bitcoin’s dancing like no one’s watching.
Volume has been quietly rising, even if it’s not screaming just yet. That’s a sign of real interest – not a frenzy, but sustained institutional nibbling and long-term conviction. The 50-week moving average is lagging far behind (hovering somewhere in the \$80K range), which tells you how strong this trend really is. That line’s not catching up anytime soon – it’s gasping for air while price is sprinting ahead.
Could we get a pullback? Sure. That’s always on the table. But unless BTC fumbles back below \$112K, the bulls aren’t just in control – they’re rewriting the rules. Next major psychological zones are \$125K, \$130K, and \$135K, and with each passing week, they’re looking less like distant targets and more like stepping stones. Buckle up.
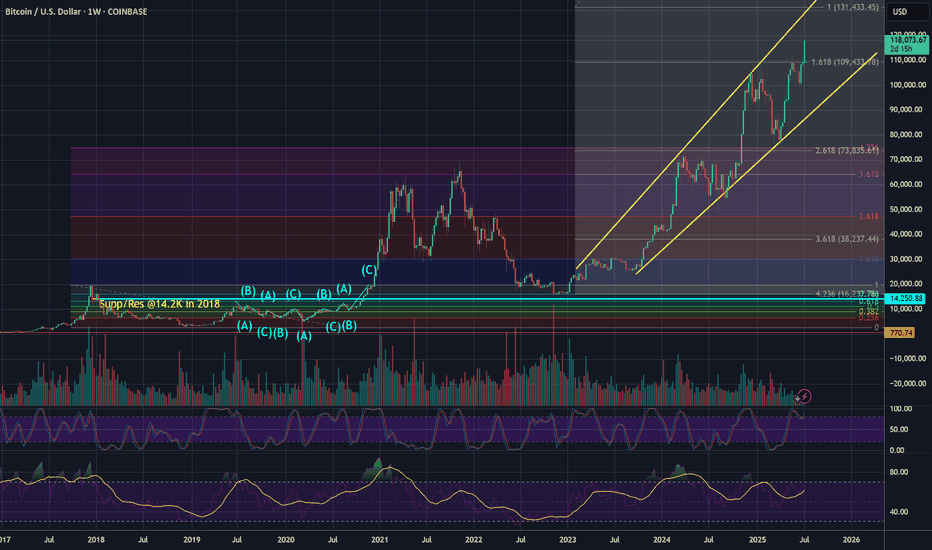
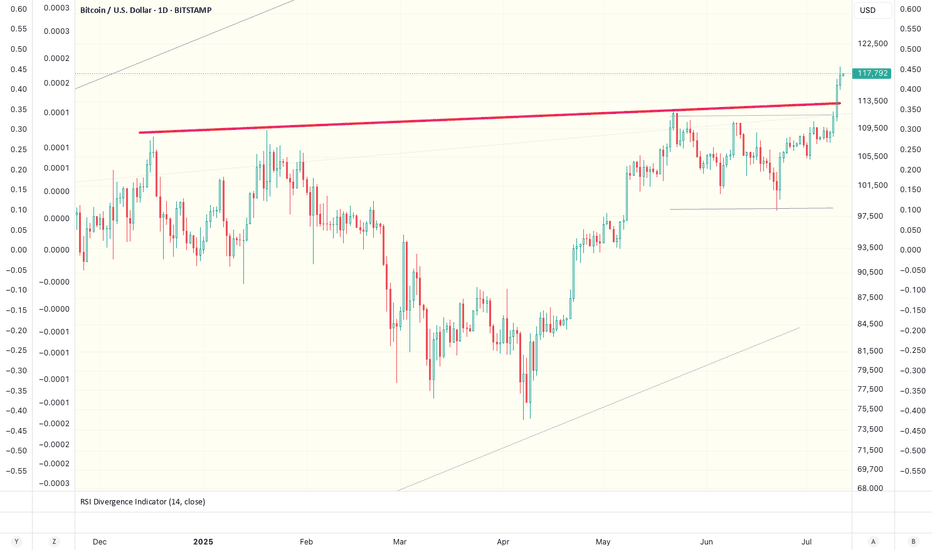
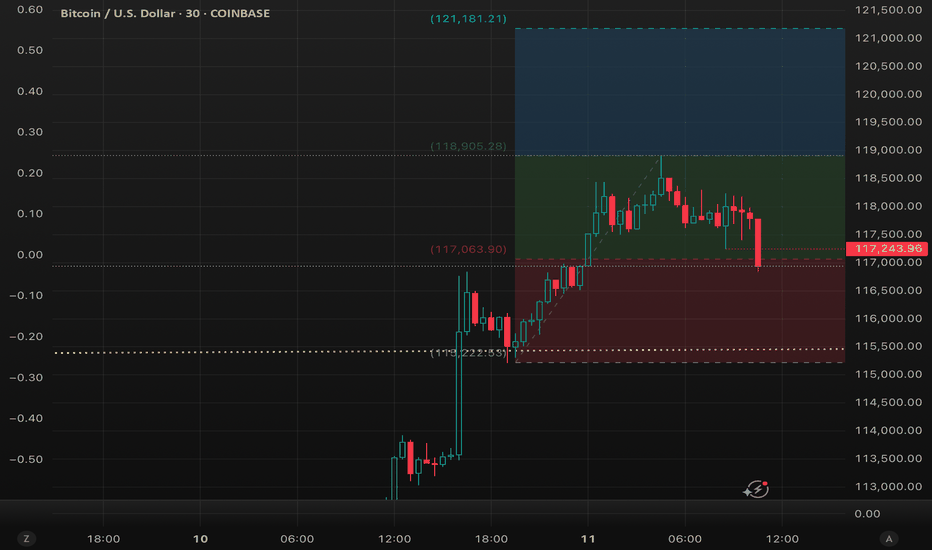
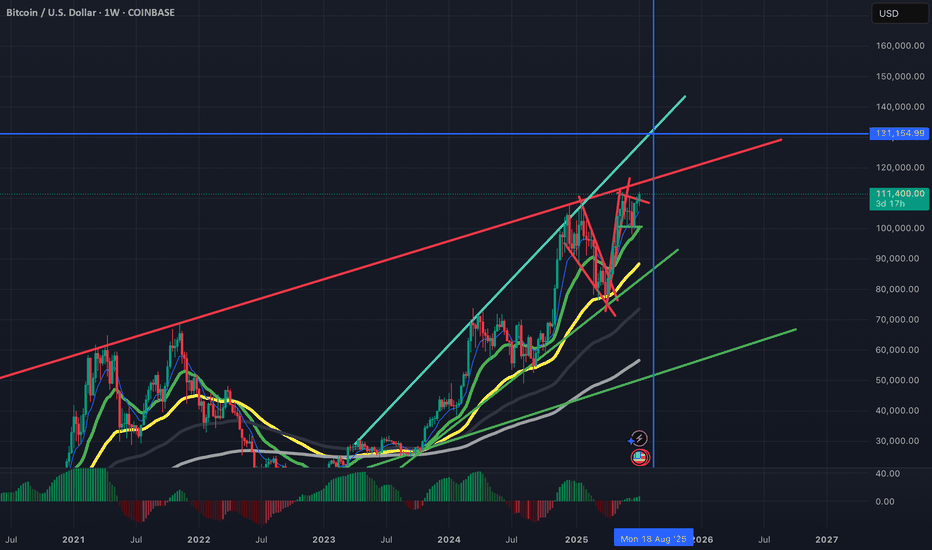
Keep an eye on 117k as the level to stay above.This is the first time in 7 years that Bitcoin has been able to push up through a long trendline originating in 2018. And this is the longest time we have been above this level, with April 2021 spending one day above it.
Yes, all those shorts calling for a deep retracement got rekt, but a clock is right once a day - so there is always that possibility that we will see some profit taking and consolidation here.
We want to stay above the low in this latest move at 117,250 USD. And we are trying to close the day above the 50% of this latest move, which comes in at 117k USD. Anything less increases the risk of a pullback to digest these latest gains.
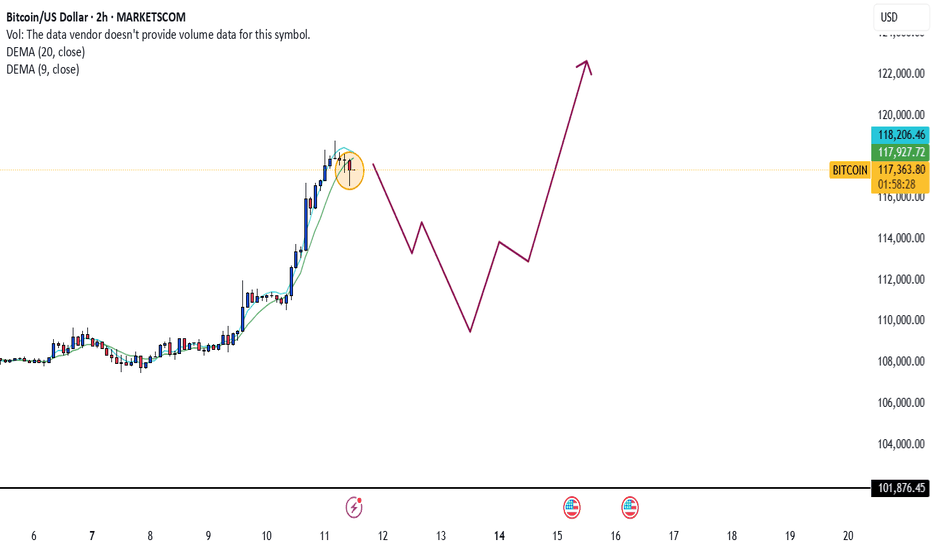
BTC BULLS IS IN CONTROL Bitcoin holds strong in its bullish sentiment, securing a fresh high at 111K.
With momentum on its side, a new projection toward 120K is now firmly in play — the bullish trajectory stays intact. 📈
Momentum traders, stay alert. This leg might just be getting started. follow for more insights , comment and boost idea .
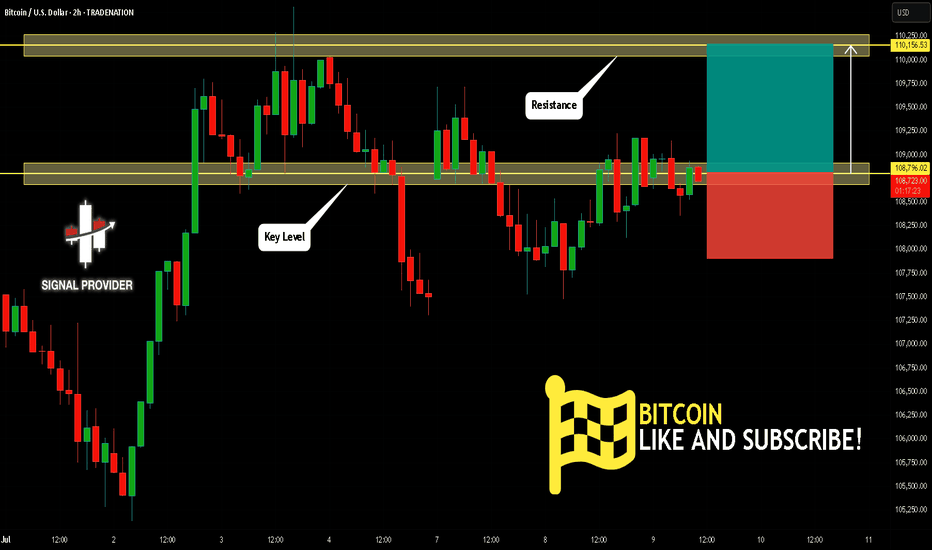
BITCOIN Will Go Up From Support! Buy!
Take a look at our analysis for BITCOIN.
Time Frame: 2h
Current Trend: Bullish
Sentiment: Oversold (based on 7-period RSI)
Forecast: Bullish
The market is testing a major horizontal structure 108,796.02.
Taking into consideration the structure & trend analysis, I believe that the market will reach 110,156.53 level soon.
P.S
Please, note that an oversold/overbought condition can last for a long time, and therefore being oversold/overbought doesn't mean a price rally will come soon, or at all.
Disclosure: I am part of Trade Nation's Influencer program and receive a monthly fee for using their TradingView charts in my analysis.
Like and subscribe and comment my ideas if you enjoy them!
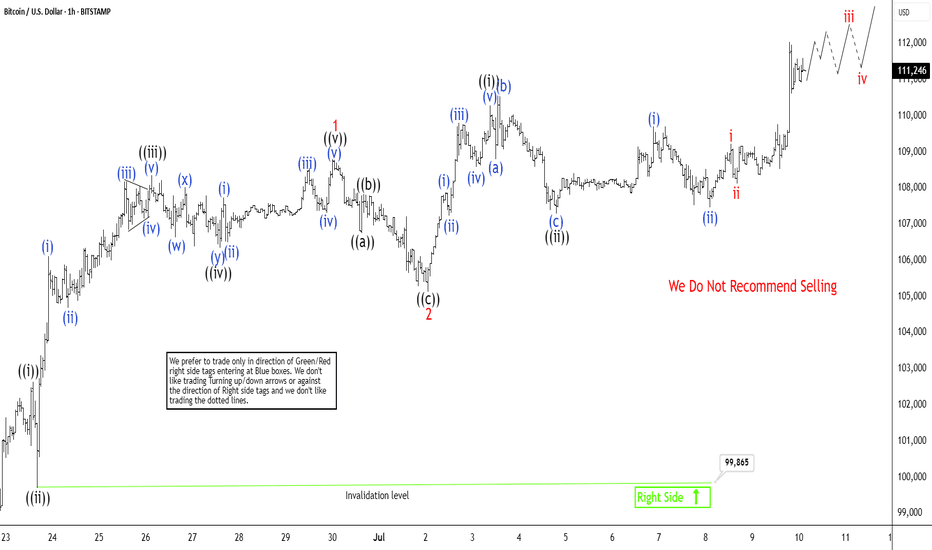
Bitcoin (BTCUSD) Breaking to New All Time HighBitcoin (BTCUSD) has recently achieved a new all-time high, signaling the onset of the next upward phase in its price trajectory. From the significant low recorded on June 22, 2025, at $98,240, Bitcoin has exhibited a robust five-wave advance, reinforcing the bullish outlook. This rally aligns with a classic five-wave impulse structure per Elliott Wave theory, a framework often used to forecast market trends. Starting from the June 22 low, wave ((i)) peaked at $102,647. It was then followed by a corrective pullback in wave ((ii)) to $99,865. The cryptocurrency then surged in wave ((iii)) to $108,358. Wave ((iv)) concluded at $106,351 after a brief dip. The final leg, wave ((v)), culminated at $108,800, completing wave 1 of a higher-degree impulse.
Subsequently, Bitcoin experienced a wave 2 correction, retreating to $105,130. From this level, it has begun nesting higher in wave 3. This is a phase often associated with strong momentum. Within this structure, wave ((i)) reached $110,292. Wave ((ii)) pullback followed to $107,303, forming an expanded flat pattern. Further subdividing, wave (i) peaked at $109,717, with wave (ii) dips concluding at $107,471. In the near term, as long as the pivotal low at $99,865 remains intact, any pullbacks are likely to attract buyers in a 3, 7, or 11-swing sequence, supporting further upside. This technical setup suggests Bitcoin’s bullish momentum is far from exhausted, with higher levels anticipated as the wave structure continues to unfold.
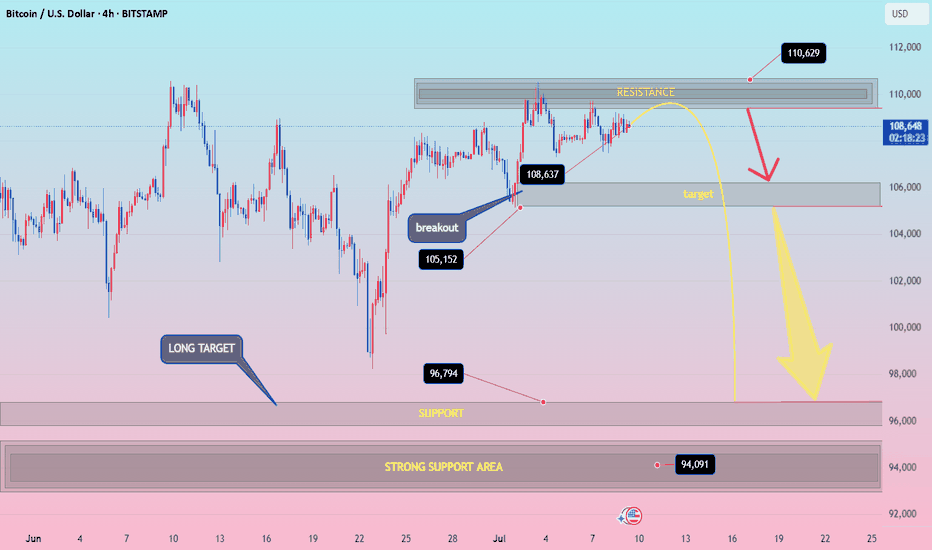
BTCUSD h4 down surelybtcusd down idia Resistance Zone: Around 110,000–111,000
Price Action Expectation:
→ Short-term push to 110,629
→ Then rejection toward 105,000, and potentially all the way down to 96,794 or even 94,091
Bearish bias after resistance is hit
⚡ Disruption Analysis (Contrarian View)
✅ 1. Resistance Flip Possibility
What if the 110,000 resistance breaks cleanly with strong volume?
Invalidates the bearish rejection arrow
Could trigger FOMO buying → Acceleration toward 112,500+
Bullish scenario: formation of a bull flag above resistance = continuation setup
✅ 2. Bear Trap Theory at 105,000 Zone
That “target” zone near 105k could be a fake breakdown zone
Market might dip there briefly, lure shorts, then reverse violently
This creates liquidity for a rapid long squeeze breakout
✅ 3. Market Structure Still Bullish on HTF
Higher lows from June 24 to July 6
Clean breakout at 105,152
Still respecting ascending structure — which is not bearish yet
🚨 Disruption Summary Chart Moves
🔼 Alternate Path 1 (Bullish Disruption):
Price consolidates under resistance → breaks above 110,629 → targets 112,500–115,000
🔄 Alternate Path 2 (Fake Breakdown Disruption):
Drops to 105,000, triggers sell-off → sharp reversal → back above 108,637
🔽 Original Path (Rejection-Based Bearish):
Still possible — but not the only high-probability path anymore
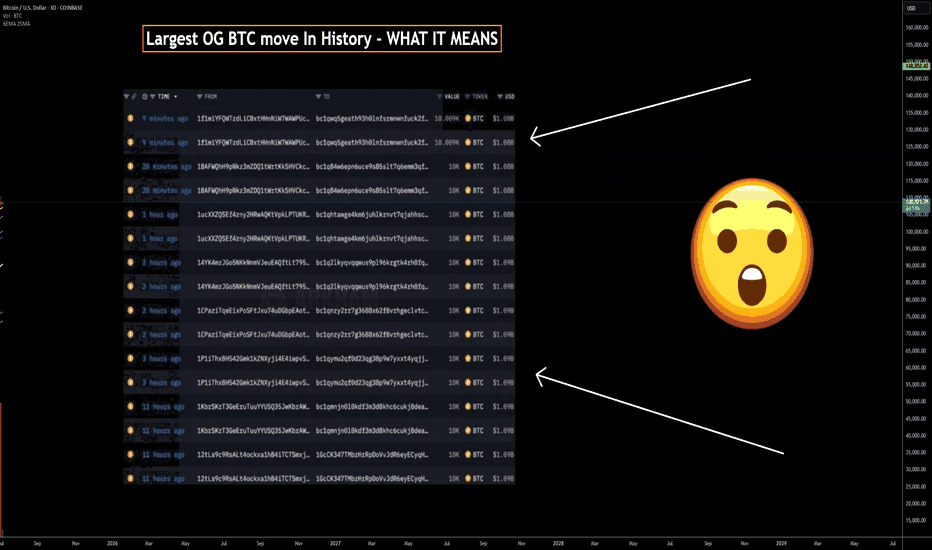
80k BTC On The Move - WHAT It Means 80,000 BTC Wallet Movement (2011 Miner)
• Source: 8 wallets containing 10,000 BTC each — mined in 2011, dormant for 14 years
• Total Value: Over $8.6 billion USD
• Timing: Moved on July 4, 2025 — largest dormant BTC transfer in history
• New Addresses: Funds moved to modern SegWit wallets
• Probable Owner: Likely a single early miner with 200k+ BTC history
Possible Reasons for the Move
• Key Rotation: Upgrading to modern wallets for better security
• Recovered Access: Private keys may have been recently recovered
• Market Strategy: Positioning for profit-taking or major sell-off
• Yield Farming: Preparing COINBASE:BTCUSD for use in DeFi/lending platforms
• Collateral Use: Possibly for loans, stablecoin leverage, or RWAs
• Estate Planning: Legal restructuring or generational wealth setup
• OTC Transfer: Could be prepping for off-exchange institutional sale
• Psychological Warfare: Could be intended to spook or manipulate the market
• Regulatory Response: Aligning with new compliance or tax jurisdiction
Market Reaction
• COINBASE:BTCUSD Price Dip: Price briefly fell below $108,000 post-move
• ETF Context: Movement occurred despite record ETF inflows
Key Note: These wallets had not been touched since COINBASE:BTCUSD was worth ~$0.78. Their reactivation adds uncertainty and opportunity in a fragile macro environment.
• What to do????: Watch the orderbook to find these large bitcoin moves in case of exchange selling
Near term support & resistance
$106000 support
$109500 first resistance
👍 If this breakdown helped your trading, smash that Like and drop a comment below—let me know what you think will happen with the 80k COINBASE:BTCUSD . 👍
Best Reguards
MartyBoots, 17-year market trader
