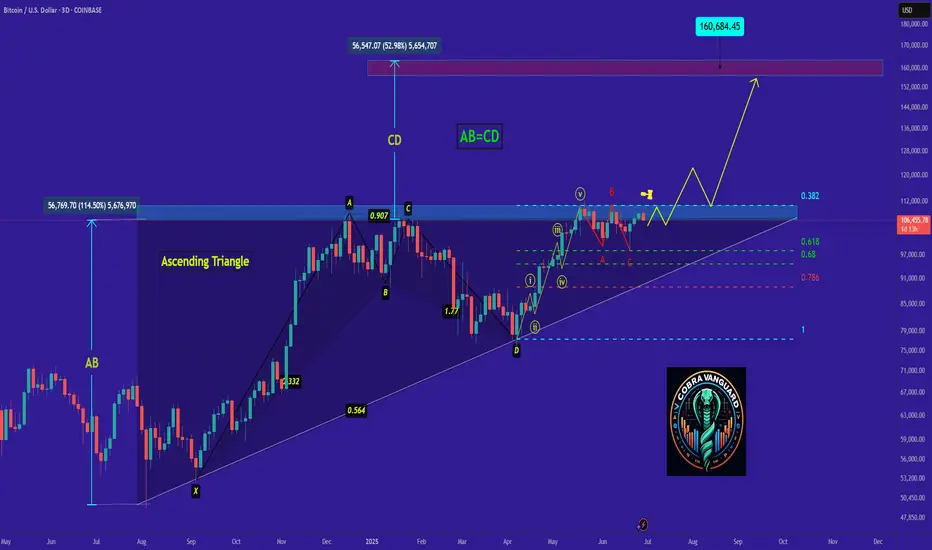
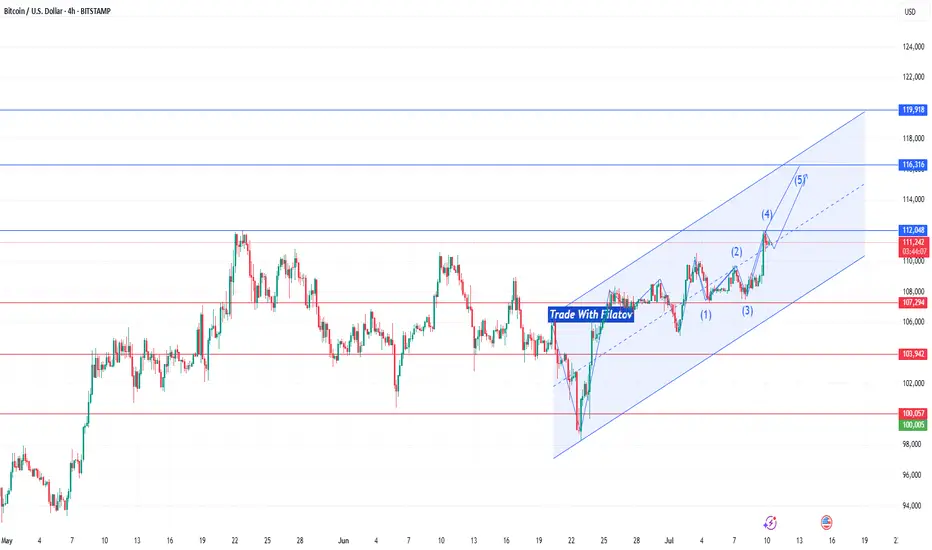
"BTC - Time to buy again!" (Update)Bitcoin is now at a point where it cannot be ignored! In my view, the bullish wave has started after the corrective wave ended. This wave could continue until it breaks the ascending triangle, then with a slight correction, push the price upward again. The current period and the coming days could be crucial in determining the market's trend.
Best regards CobraVanguard.💚
BTCUSD.PM trade ideas
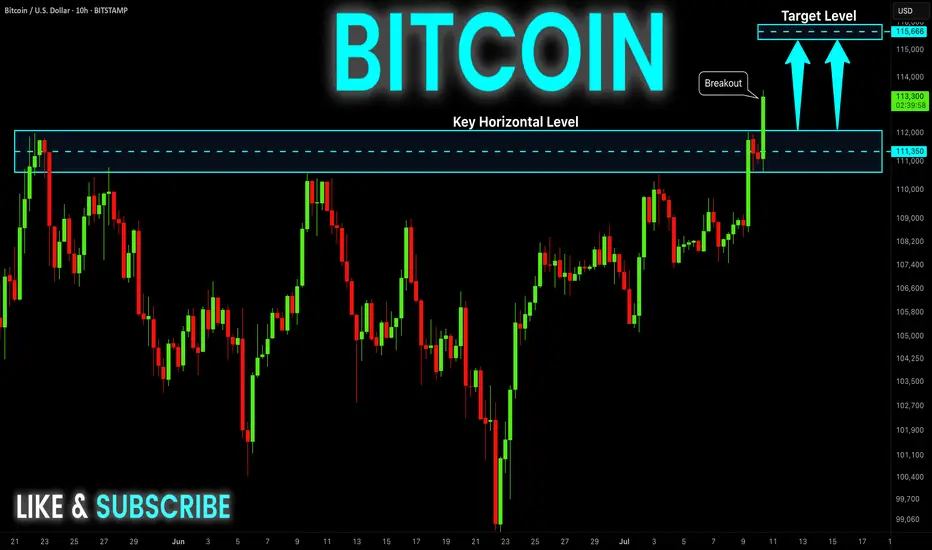
BITCOIN Epic Breakout! Buy!
Hello,Traders!
BITCOIN is trading in an
Uptrend and the coin made
An epic bullish breakout
Of an ATH level of 112k$
Which reinforces our bullish
Bias and we will be expecting
A further bullish move up
Buy!
Comment and subscribe to help us grow!
Check out other forecasts below too!
Disclosure: I am part of Trade Nation's Influencer program and receive a monthly fee for using their TradingView charts in my analysis.
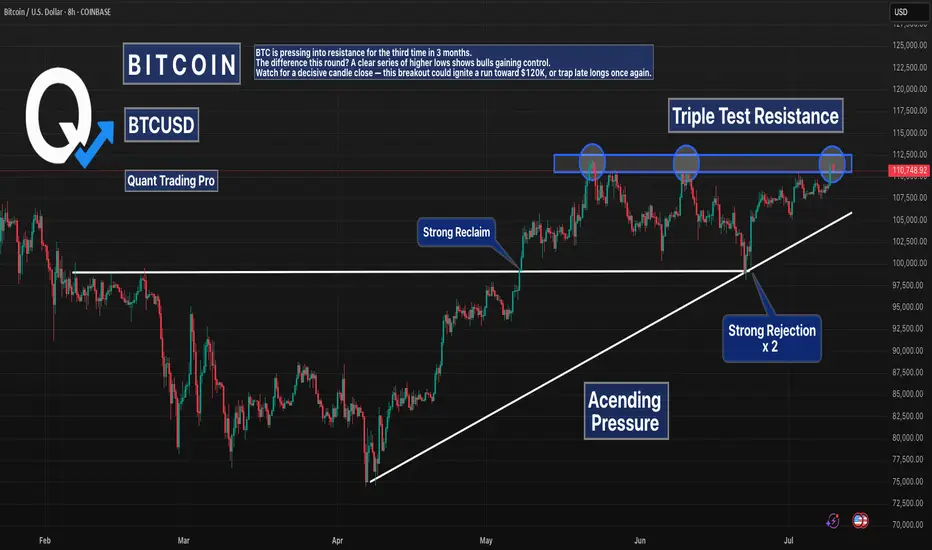
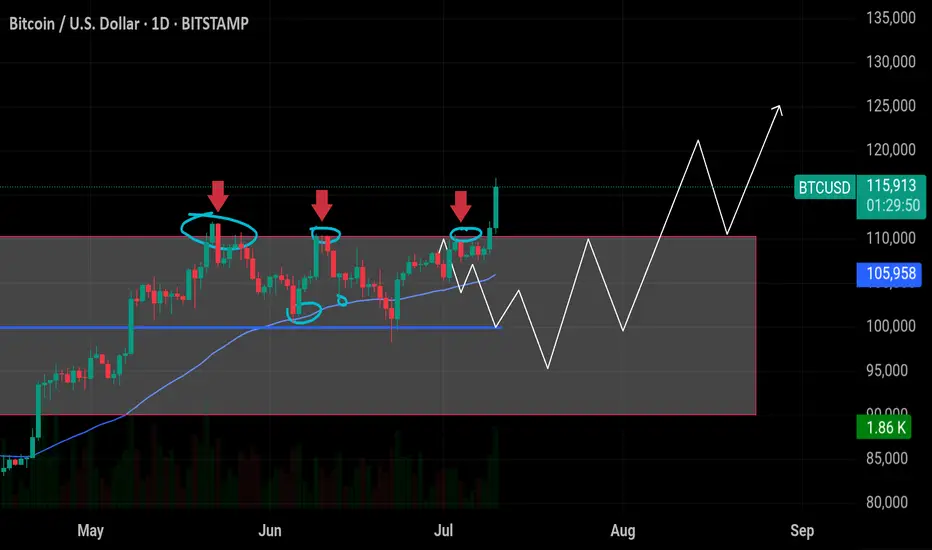
Bitcoin at Triple Resistance – Will the Third Time Break It?BTC/USD is pressing against a key resistance zone near $112,500 for the third time in recent months.
This time, the breakout attempt is backed by a clear ascending trendline, showing sustained bullish pressure from the lows.
Highlights:
Triple top formation? Or ascending triangle breakout?
$112.5K has rejected BTC twice already
Higher lows = buyers stepping in more aggressively
Watch for volume surge and daily close confirmation
Break above = $118K–$120K likely in play.
Reject = revisit of trendline support near $106K.
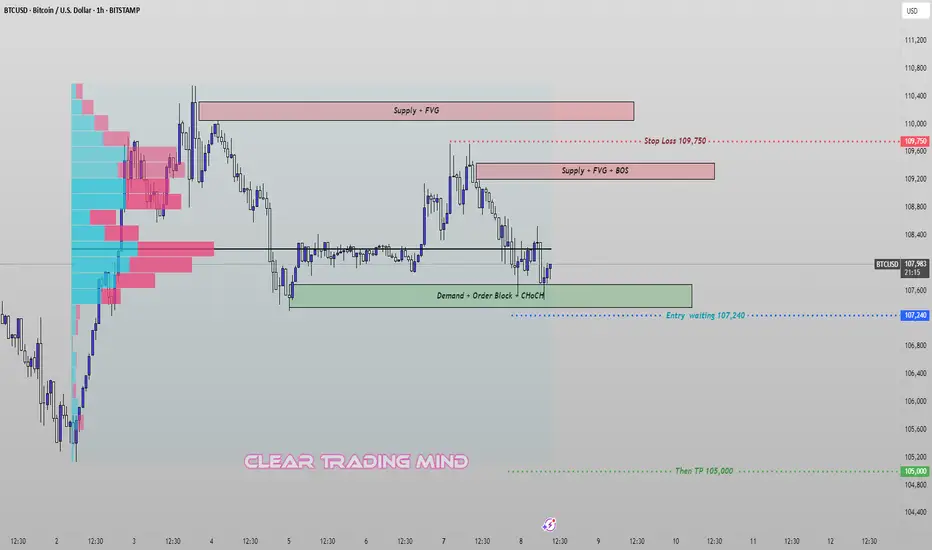
BTCUSD – Breakout Plan from Demand Zone (CHoCH + OB Setup)🔹 Current View:
I'm closely watching the 107,240 zone, where we have a strong Demand + Order Block + CHoCH (Change of Character) setup. This is a key support area that could trigger a fresh bearish move if broken.
🔹 My Plan:
I'm waiting for a clear breakout below 107,240 to enter a short position.
➡️ Entry: 107,240 (after confirmed breakout)
➡️ Stop Loss: 109,750 (above supply + BOS zone)
➡️ Target: 105,000 (previous inefficiency zone)
🔹 Supply Zones Noted:
- 109,250–109,500: Supply + FVG + BOS
- 110,000–110,500: Strong Supply + FVG
This trade is based on price breaking demand structure and retesting key supply areas above. Volume profile also shows heavy activity above, indicating possible resistance on any pullbacks.
symmetrical triangle in progressBitcoin has been consolidating at this level for several weeks, easing some of the pressure in order to push above 120K. As of today, we have a clear formation—a large symmetrical triangle—which confirms the continuation of the upward trend and rules out any possibility of returning to lower levels.
BTC/USDI've been calling for a crash for a while.
The closer to the top you are, the more hatred that you'll get for calling one.
It's a difficult position being contrary to the crowd. I think that's why Peter denied Jesus.
In any case, positive sentiment must end and as overdue as it is, I'm expecting a bang, after a final wave of FOMO.

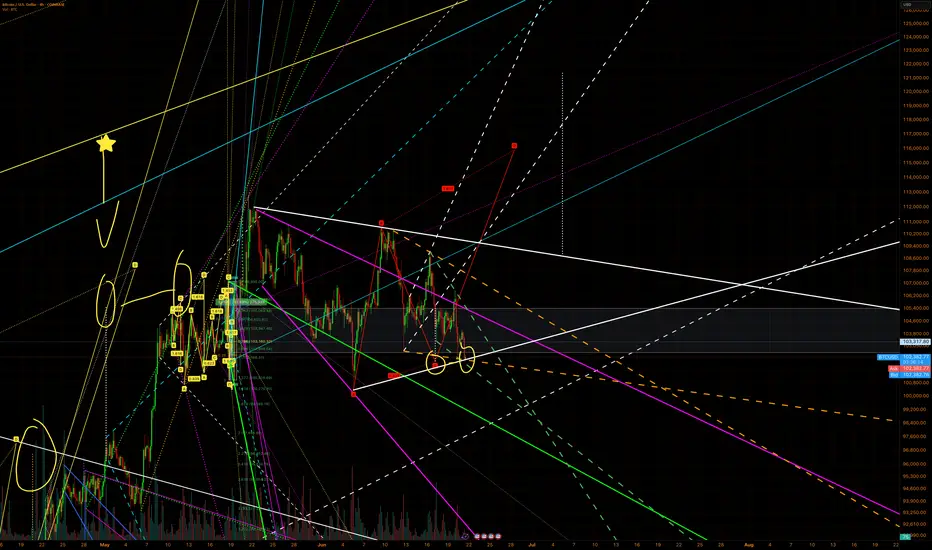
Old but accessible price targetIt was around the end of 2024 that I had an interesting price target for BTC, but the entry points only looked attractive in the green box area.
This green box was obtained solely based on my personal strategy, and the final and near target was obtained based on the trend lines and channel, from which I personally draw appropriate conclusions with price targets!
The excellent return from BTC, although time-consuming, was very attractive for spot traders!
Good luck!
MJ.REZAEI
$BTC Breakout Confirmed – Next Stop: $120K? CRYPTOCAP:BTC Breakout Confirmed – Next Stop: $120K?
I told you — if BTC closes above the box, a breakout was imminent… and it just confirmed!
Price has cleanly closed above the $110K resistance zone after multiple rejections — this breakout signals strong bullish momentum. 📈
Next stops: $120K and beyond
Breakout buyers are now in control — as long as BTC stays above $110K.
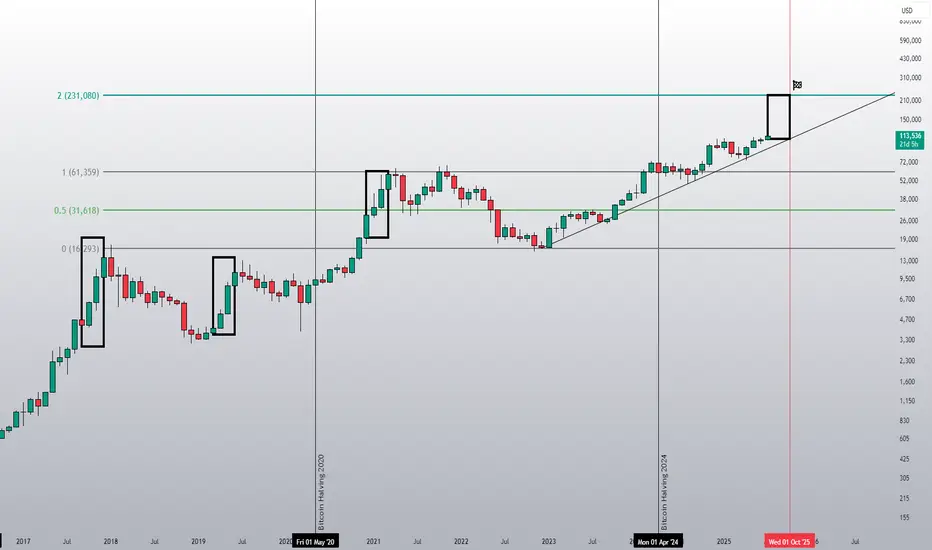
BTC is on track!This is what four month for Bitcoin can look like and you really think 230k in October 2025 is far-fetched?? You better rethink that.
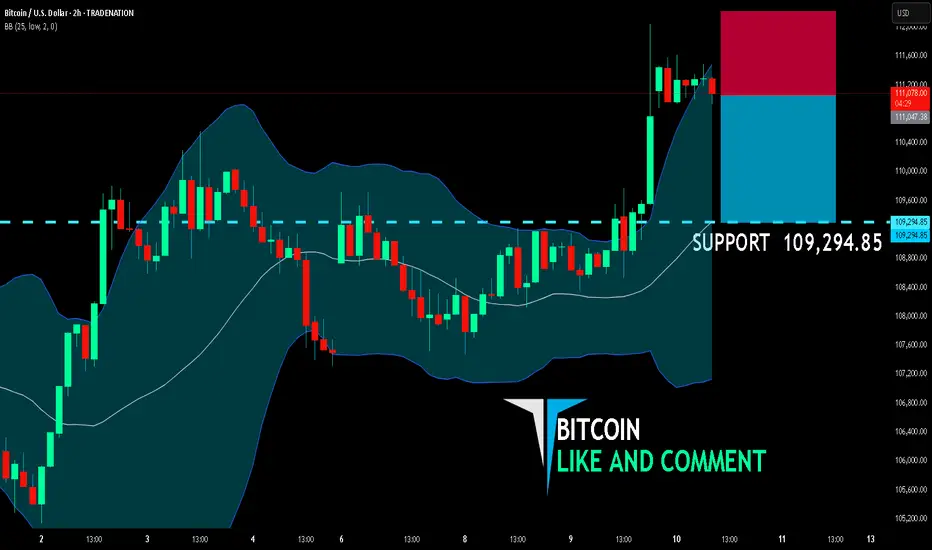
BITCOIN BEARS WILL DOMINATE THE MARKET|SHORT
BITCOIN SIGNAL
Trade Direction: short
Entry Level: 111,047.38
Target Level: 109,294.85
Stop Loss: 112,211.89
RISK PROFILE
Risk level: medium
Suggested risk: 1%
Timeframe: 2h
Disclosure: I am part of Trade Nation's Influencer program and receive a monthly fee for using their TradingView charts in my analysis.
✅LIKE AND COMMENT MY IDEAS✅
July 7 Bitcoin Bybit chart analysisHello
This is Bitcoin Guide.
If you "follow"
You can receive real-time movement paths and comment notifications on major sections.
If my analysis was helpful,
Please click the booster button at the bottom.
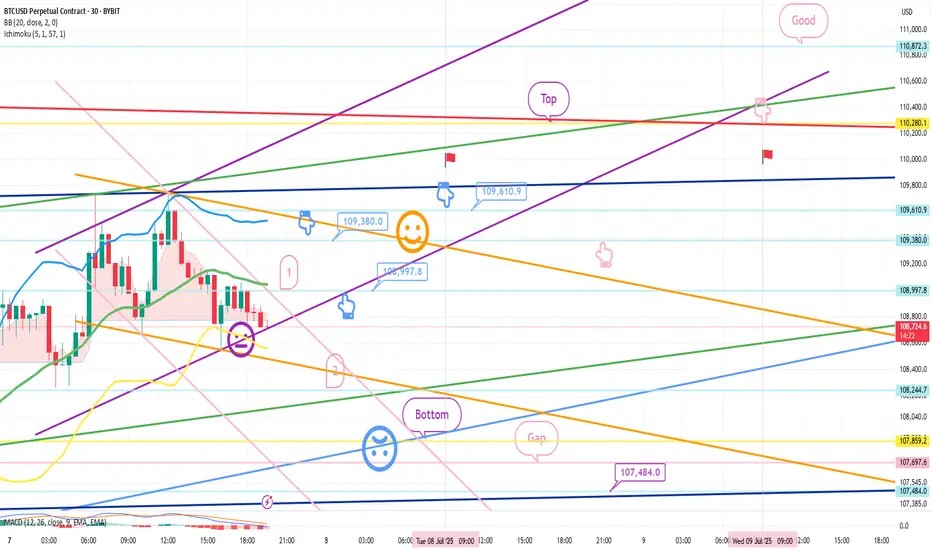
Here is the Bitcoin 30-minute chart.
There is no separate Nasdaq indicator announcement today.
I think the Nasdaq lower gap section retracement will be the focus.
Recently, sideways movement or adjustments have been coming out before the trend,
So I proceeded safely in preparation for variables.
*When the blue finger moves
Bidirectional neutral
Short->long switching or 2nd section long waiting strategy
1. $109,380 short position entry section / cut-off price when orange resistance line is broken
2. $108,997.8 long position switching / cut-off price when purple support line is broken
3. $109,610.9 long position 1st target -> Top 2nd target -> Good 3rd target
It seems important whether the purple support line is broken from the current position. If the first section at the top touches 108,997.8 dollars and comes down,
it may become a vertical decline section.
If it comes down right away, it is a long-waiting strategy in the final second section,
and if it deviates from the bottom section today
(6+12 pattern)
because it is a full candle when the gap section is touched,
it may fall to 107,484 dollars indicated at the very bottom.
I have important work to do tomorrow,
so I will take a day off and come back on Wednesday.
Please use my analysis so far for reference and
I hope you operate safely with principle trading and stop loss prices.
Thank you.
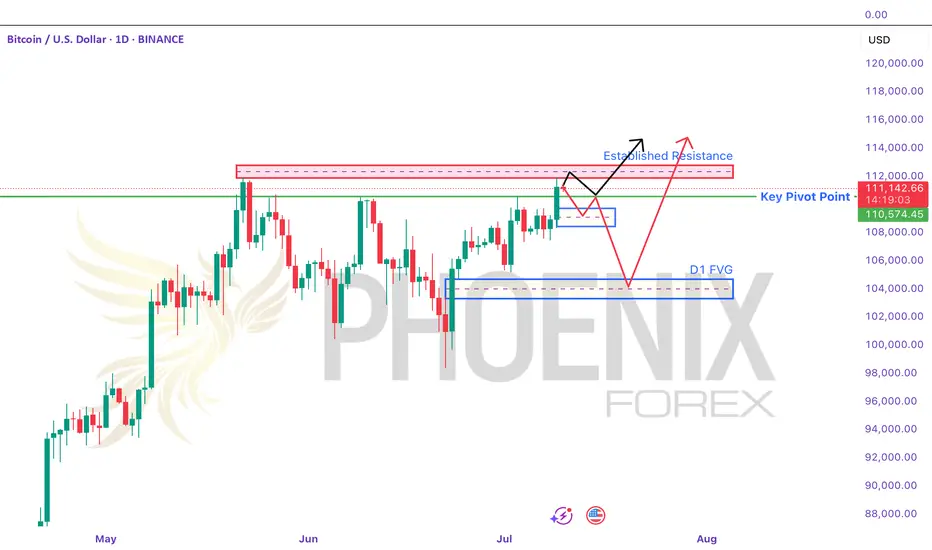
BTCUSD At Crucial Pivot Point. Is This The Ceiling? - PhoenixFX BTCUSD Price-Action Analysis & Scenarios
Below is an overview of the two possible paths for Bitcoin over the coming days, as sketched out by the black and red arrows on your chart. We’ll also highlight the key pivot level and resistance zone that will decide which scenario plays out.
🔵 Key Levels to Watch
Established Resistance (~$111,800–$112,500)
This zone marks multiple failed attempts to break higher in recent weeks. It’s where large stop-runs and sell-side limit orders tend to cluster. A decisive daily close above $112K is required to signal genuine bullish continuation.
Daily Pivot Point (~$110,600)
Acting as the “battle line” between bulls and bears, this pivot is the first level to confirm market bias.
Above $110.6K: Tends to favor buyers, suggesting strength and higher-high attempts.
Below $110.6K: Gives the bears the edge, increasing the odds of deeper retracements.
📈 Black-Arrow (“Bullish Continuation”) Scenario
Break & Hold Above Resistance
Price thrusts cleanly above $112K on strong volume.
Retest the H4 Order Block (~$111,000–$111,200)
A shallow pullback into the highlighted H4 demand zone (blue box) offers a lower-risk long entry.
New Highs
From there, Bitcoin resumes its uptrend, closing the week with fresh highs above the prior $113K peak.
Key Trigger: Sustained daily close above $112K, followed by a successful retest of that level.
📉 Red-Arrow (“Bearish Rejection & Dip”) Scenario
Rejection at Resistance
Price stalls and reverses somewhere between $111,800–$112,500, forming a bearish reversal candle.
Drop to Daily FVG Zone (~$104,000–$105,000)
This larger Daily Fair-Value Gap (blue box lower on the chart) coincides with strong weekly support—an ideal zone for dip buyers.
Recovery Rally
After absorbing selling pressure in the FVG, BTC bounces back toward the established resistance, setting up a second test of $112K.
Key Trigger: Clear bearish price action (e.g., engulfing or pin-bar) in the $111.8K–$112.5K zone, followed by a daily close below the pivot at $110.6K.
🎯 How to Trade These Setups
Bullish Entry:
Wait for daily close > $112K
Enter on pullback into $111K–$111.2K (H4 order block)
Stop below $110.6K pivot; target new highs above $113K+
Bearish Entry:
Look for bearish reversal signals in $111.8K–$112.5K
Enter on break & close below $110.6K pivot
Target $104K–$105K (Daily FVG); stop above $112.5K
Note: The pivot at $110.6K is your first “line in the sand” for bias—trade in the direction of the break, and use the major resistance zone to confirm strength or failure. Always manage your risk and adjust to how price actually unfolds!
Just a Heads-Up:
This is my take on the charts—not gospel, not financial advice, and definitely not a crystal ball 🔮. Trading is part skill, part patience, and part “what just happened?” 😅
We all see things a little differently, and that’s the beauty of it. So if you’ve got a hot take, wild theory, or just want to drop some chart wisdom—hit the comments!
Let’s grow, learn, and laugh through the madness together. 🚀📈
Each one, teach one.
— Phoenix FX Team 🔥🦅
Bitcoin Breakout Watch – BTC/USD UpdateBTCUSD is currently consolidating above the $112,000 level — a critical price zone that could mark the beginning of a new leg higher.
If this consolidation holds, it signals strong buyer interest and sets the stage for a potential breakout. The next major target lies at $120,000, aligning with the 161.8% Fibonacci extension, a key level often associated with explosive momentum moves.
💡 This setup reflects growing confidence in the crypto space and may attract institutional inflows if confirmed.
₿itcoin: ATHBitcoin recently marked a new all time high. Our primary expectation is for an even bigger breakout to the upside, allowing green wave B to reach its peak within the upper blue Target Zone between $117,553 and $130,891. After this corrective high, we anticipate a sharp sell-off during green wave C, which should drive Bitcoin down into the lower blue Target Zone between $62,395 and $51,323—where we also expect the low of the larger orange wave a. This move should, for now, signal the start of another corrective rally along orange wave b, with a retest of the freshly marked all-time high well within reach. Once this countertrend move concludes, another significant decline should follow as orange wave c develops, targeting the low of the higher-level blue wave (ii). Alternatively, there remains a 30% chance that the preceding wave alt.(i) is still in progress, which could result in a direct breakout above resistance at $130,891.
📈 Over 190 precise analyses, clear entry points, and defined Target Zones - that's what we do.

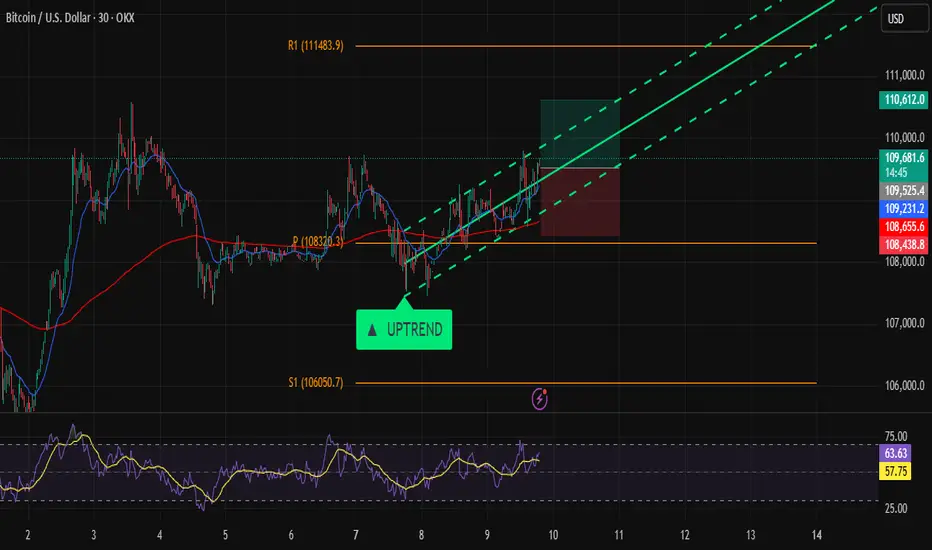
Bitcoin on Fire: Targeting $110K in Relentless Uptrend!Hi traders! , Analyzing BTC/USD on the 30 minute timeframe, price is currently respecting an upward channel and showing consistent higher highs and higher lows. The recent bounce from dynamic support suggests bullish continuation.
🔹 Entry: 109,545
🔹 Take Profit (TP): 110,612
🔹 Stop Loss (SL): 108,438
Price is trading above both the 50 and 200 EMA, confirming bullish momentum. The RSI remains above the midline, indicating buyers are still in control. This long setup offers a favorable risk-reward ratio within the context of the broader uptrend.
A confirmed breakout from the short-term resistance, combined with trendline support and channel structure, adds confluence to this idea. Watch for potential resistance near the 110,612 zone.
⚠️ DISCLAIMER: This is not financial advice. Every trader is responsible for their own decisions and risk management.
BITCOIN BREAKOUT IMMINENT (120K)The Trend is your Friend. Bitcoin’s current action is the kind of bull‐market digestion you want to see before the next big surge. We’ve powered up from roughly $50 K on the Trump‐election narrative to flirt with all‐time‐high territory around $112 K, and now we’re simply consolidating in a tight $100 K–$110 K range. What really grabs my attention is how volume has dried up inside that band: fewer sellers stepping up means less fuel for a deep pullback, and an ebb in liquidity often precedes the kind of compressed buildup that launches a sharp move. That liquidity squeeze tells me smart money is biding its time rather than panicking out, and that sets the stage for a clean breakout once a new catalyst arrives.
Technically, the setup could hardly be neater. The 10-, 21- and 50-period moving averages have converged, running almost in lockstep. When those averages come together like train tracks, it signals a market in “healthy pause” — neither exhausted by an overextended rally nor capitulating under bearish pressure. It’s the kind of feature you love to see: price has had its run, it’s caught its breath, and it’s ready to go again on fresh conviction. Meanwhile, the RSI sits squarely in the middle of its range, neither overbought nor oversold, meaning there’s plenty of room for buyers to step in without an immediate pullback risk from extreme readings. In other words, momentum indicators are calm, not frothy or fearful, which further supports the case for a measured upward thrust rather than a sudden crash.
On the macro side, fundamentals are lining up, too. Monthly passive inflows into Bitcoin ETPs and ETFs continue at a robust clip, with institutions quietly adding to their positions out of the spotlight. If the Fed pivots toward rate cuts later this year, capital that’s been chasing yield elsewhere could flow back into risk assets — and Bitcoin, with its “digital gold” narrative, stands to gain especially when you consider its roughly $2 trillion market cap versus gold’s $20 trillion. That leaves a lot of upside potential if institutional demand keeps accelerating. Even more compelling: real‐world use cases for blockchain—everything from proof‐of‐ownership to decentralized finance—continue to mature behind the scenes, reinforcing Bitcoin’s narrative as not just a speculative asset, but a foundational piece of tomorrow’s financial system.
Of course, we can’t ignore the risks. We’ve already seen Bitcoin price near $112 K once, and there’s always the chance it carves a frustrating double-top if it stalls again. External narratives—Middle‐East tensions, renewed Ukraine tensions, fresh tariff skirmishes—could throw cold water on the rally and trigger a quick sell-off. But given the current setup—low‐volume consolidation, converging moving averages, balanced RSI and steady capital flows—a 10 % push toward $120 K feels not just possible but probable. Keep your eye on $112 K as your breakout trigger, size your positions sensibly, and plan your stop-loss around the lower end of the range. If Bitcoin can clear that level on strong volume, we’re likely to see this bull market extend rather than roll over into a double-top scenario. Happy trading, stay disciplined, and let’s see where this market takes us next!
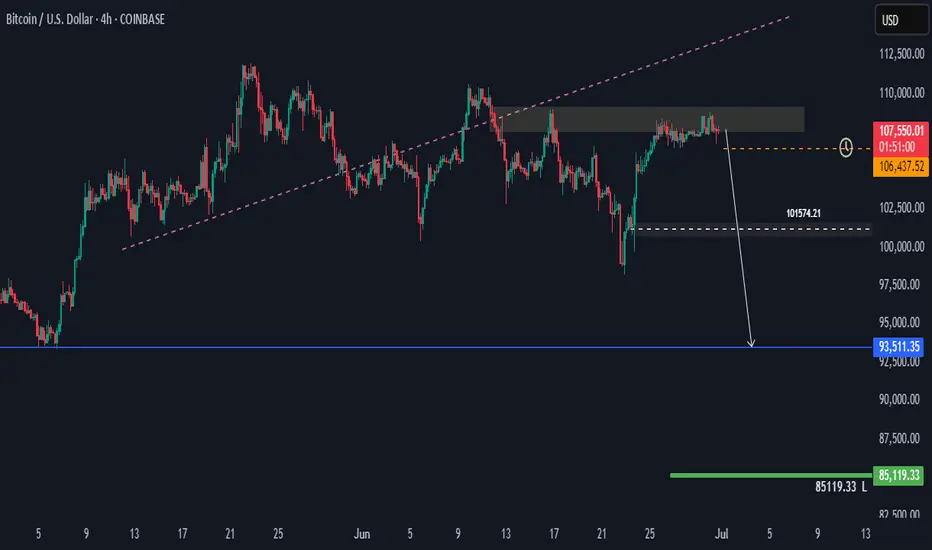
BTCUSD H4 Potential DropHi there,
BTCUSD H4: As long as the 85,119.33 level holds, the overall trend remains bullish in a larger scope.
Currently, the price is trading below the diagonal dotted trendline. The further it stays below this trendline, the stronger the bears' position.
The level of 101,574.21 is open for a bias towards 93,511.35.
Happy Trading,
K.
Not trading advice.
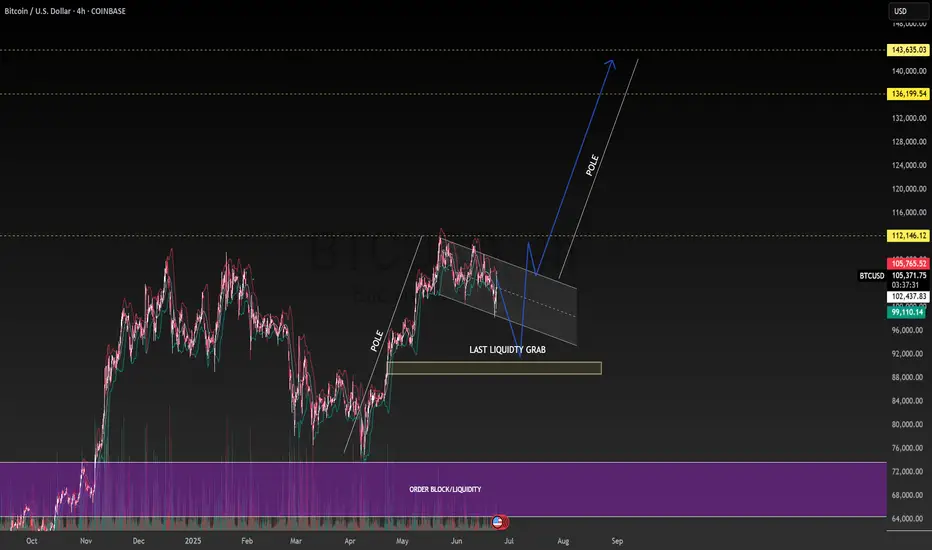
BTC BULLISH FLAG AND POLE PATTERN 135,000$ TARGETAs seen in the charts, BTC is currently forming a flag and pole pattern.
Expect price to cover one last liquidity sweep before pumping to the 135-140k price range.
ESH.
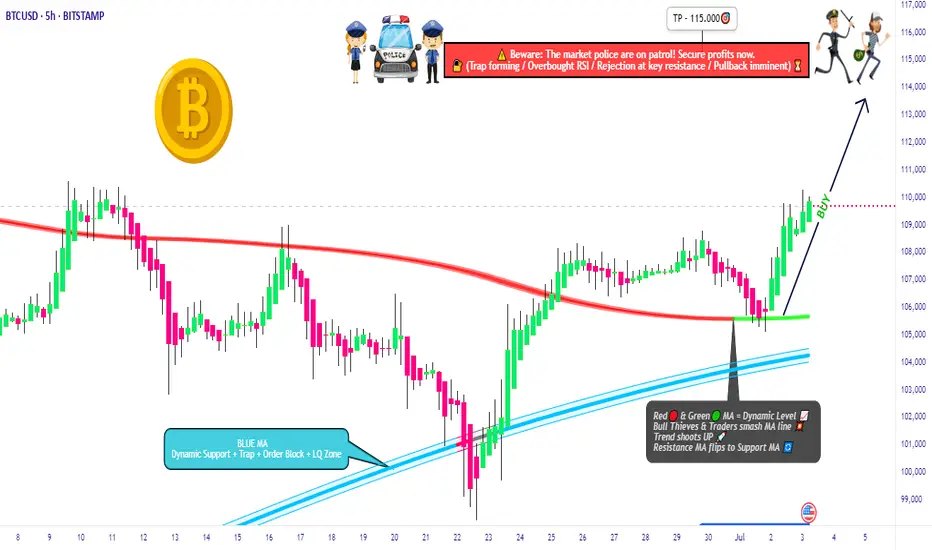
BTC/USD Heist Mode: Buy Low, Escape Rich🔓 BTC/USD Crypto Vault Breach: Thief Strategy for Long Entry Robbery (Swing/Day Setup) 🔓
🌟Hi! Hola! Ola! Bonjour! Hallo! Marhaba!🌟
Dear Money Makers & Robbers, 🤑💰💸✈️
🚨 Welcome to our next Thief Trading-style breakout mission — this time targeting the mighty BTC/USD vault. Using a fusion of technical precision and macro-level insight, we're charting a long entry blueprint for a profitable heist.
🔑 Entry Plan
"The vault is open!" 💥
Buy at current price or set Buy Limit near swing lows (15–30min timeframe pullback entries). We're timing the entry with stealth—precision over panic.
🛑 Stop Loss Setup
SL set near recent swing low (4H TF reference: ~104.000).
Adjust based on position sizing, risk appetite & multi-order tactics.
🎯 Take Profit Target
Targeting 115.000—or exit earlier if price action stalls. Get in, get out. Efficiency is the code.
👀 Scalpers' Notice
Only work the Long side. If your bag’s heavy, strike instantly. If light, ride with swing robbers. Use trailing SLs to protect your bag.
📈 Why We’re Bullish
Market momentum favors the bulls:
Overbought zones acting as lures
Bearish traps ready to flip
Key confluences from sentiment, COT, on-chain & macro analysis
➡️ Full supporting breakdown available 👉👉🔗🔗.
📢 Risk Note – Stay Sharp
Major news events = increased volatility ⚠️
Avoid entries during news. Trail stops to protect running profit. Rob smart.
💖 Boost the Crew
If this blueprint aligns with your mission, hit that Boost button. It fuels the team, and together, we profit like pros. One heist at a time. 💪🎉
🧠 Stay ready—next plan drops soon. Until then, rob safe, rob smart. 🐱👤
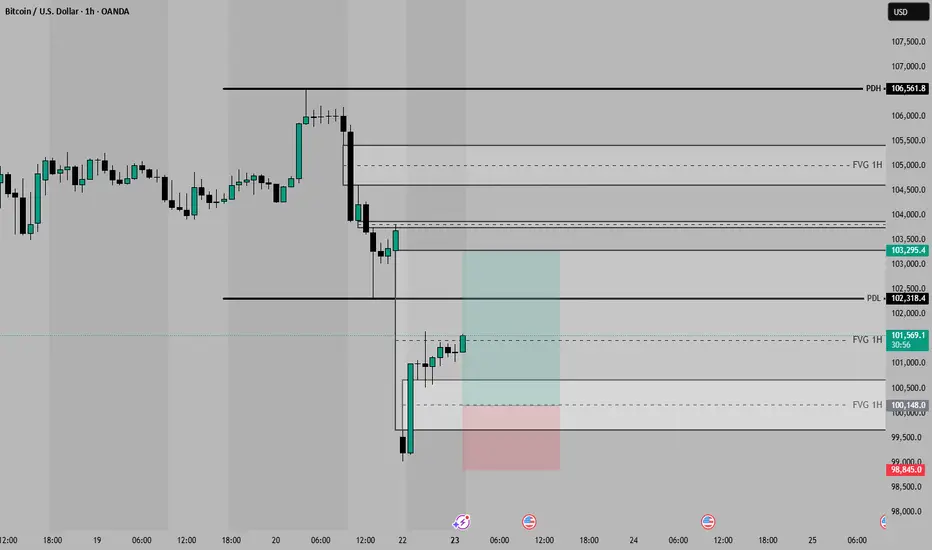
BTC TRADE IDEA 22/06/25There are some places where price needs to ATK
Wait for reversal before chase that gap
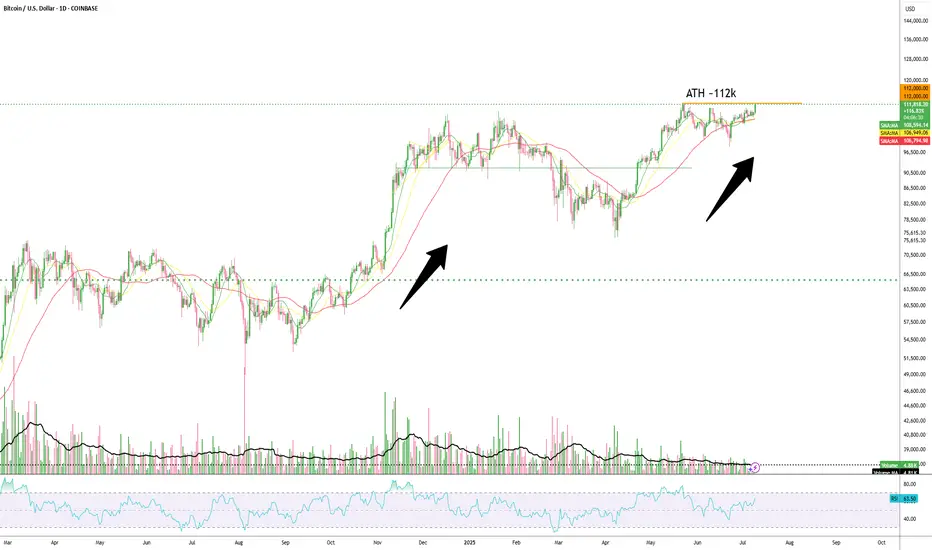
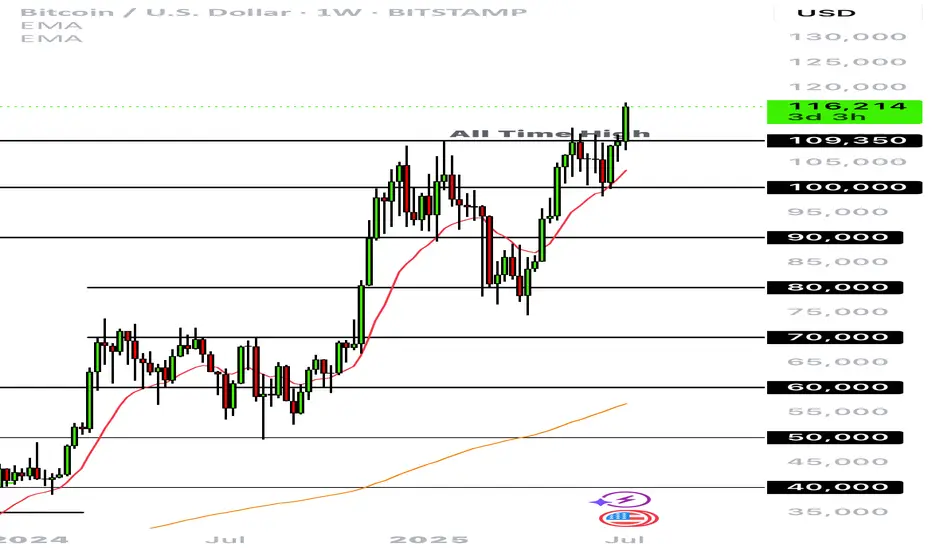
BTC All Time High All Time High
It’s mid year 2025. Let’s see what looks like bullish moment, will it continue ?
I anticipate the crypto bull run to be long term. I’m excited.
#BTCUSD #CRYPTOCURRENCY
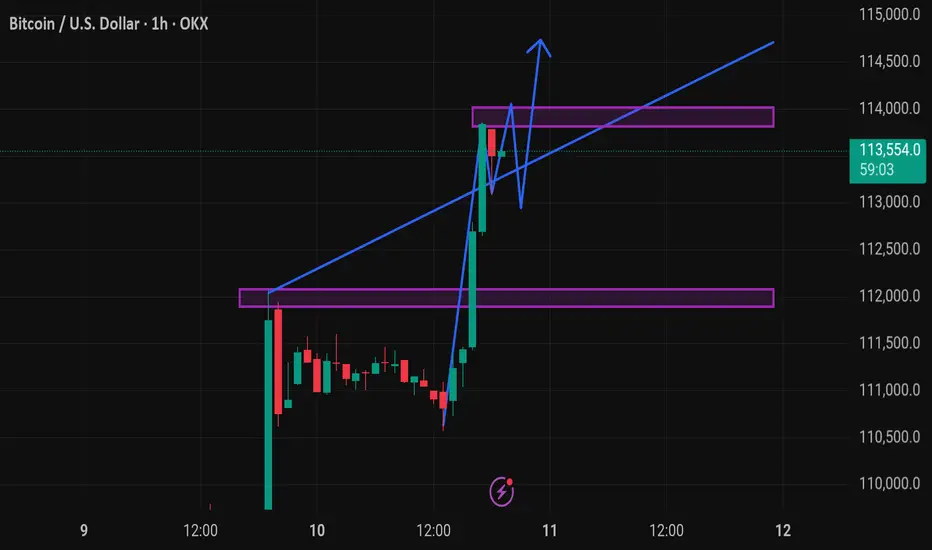
Btcusd techinical analysis.This chart represents the Bitcoin (BTC) / USD price action on a 1-hour timeframe, with technical analysis indicators suggesting a bullish outlook.
Key Elements in the Chart:
1. Current Price:
BTC is trading at $113,506.5, up +1.98% on the 1-hour chart.
2. Support and Resistance Zones:
Support Zone (purple box around ~$112,000): Recently tested and held, now acting as a potential base.
Resistance Zone (purple box around ~$113,800 to ~$114,000): Price is currently consolidating just below this zone.
3. Trendline:
A rising blue trendline is acting as dynamic support, showing upward momentum.
4. Projected Price Action (Blue Arrow Path):
The blue path suggests a potential bullish breakout from the resistance zone.
Implies consolidation, retest of support/trendline, and continuation upward—a common bullish flag or pennant pattern.
---
Interpretation:
The chart setup is bullish, expecting:
Retest of support near $113,200–$113,400
Break above the $114,000 resistance
Potential rally continuation beyond $114,000 (toward $115,000 or more)
Caution:
If BTC fails to hold the trendline or drops below the support zone (~$112,000), this bullish setup may be invalidated.
Would you like a trading strategy (e.g., entry/exit levels or risk management) based on this setup?
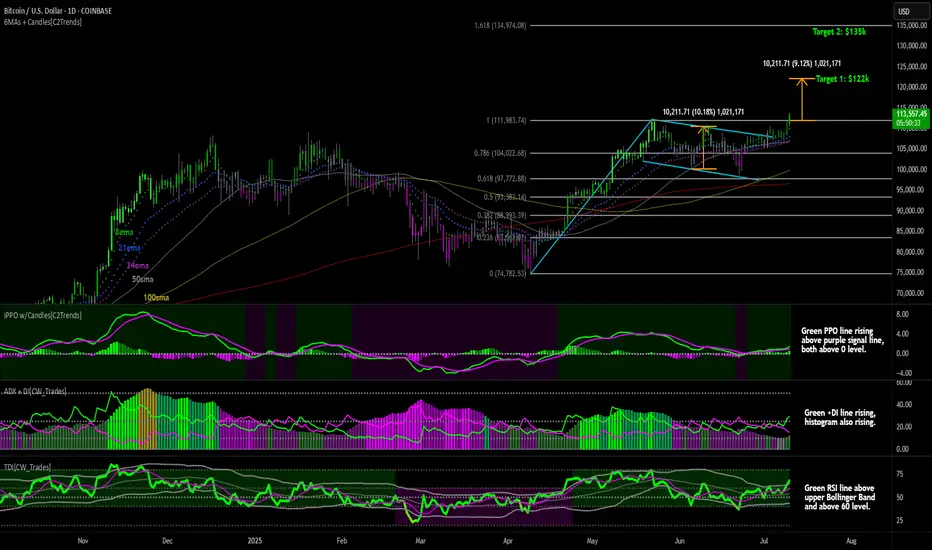
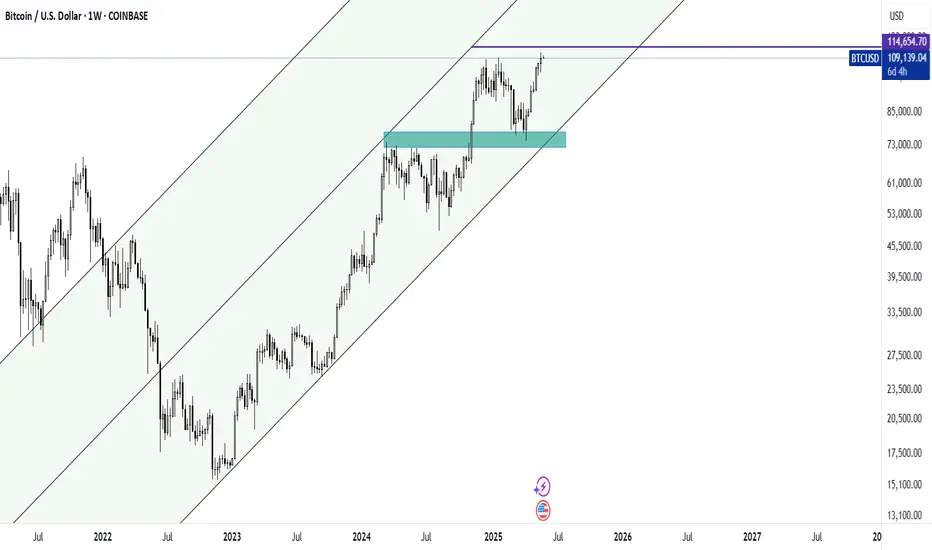
Bitcoin New All-Time HighNew all-time high for Bitcoin above $113k and is now in uncharted territory.
First price target I'm watching from here is $122k which is based on the range that we saw price make in the blue flag pattern that formed during the consolidation phase. I took the price difference between the high and low in the flag and projected it out from the previous resistance level at $112k which gives a target of $122k. Second price level I'm watching is $135k which is the 1.61 fibonacci extension level based on the April low to the recent resistance level at $112k made in May.
Lower price indicators are now all bullish:
The PPO indicator show the green PPO line rising above a rising purple signal line, with both lines having held above the 0 level during consolidation. This indicates intermediate to longterm bullish price momentum.
ADX indicator shows the green +DI line rising above a declining purple -DI line and the histogram bars are rising. This indicates increasing bull trend strength.
The TDI indicators shows the green RSI line above the upper Bollinger Band, and above the horizontal 60 level and is showing bullish trend strength.
New all-time highs generally attract more buyers looking to ride the strength.
Giddy Up.