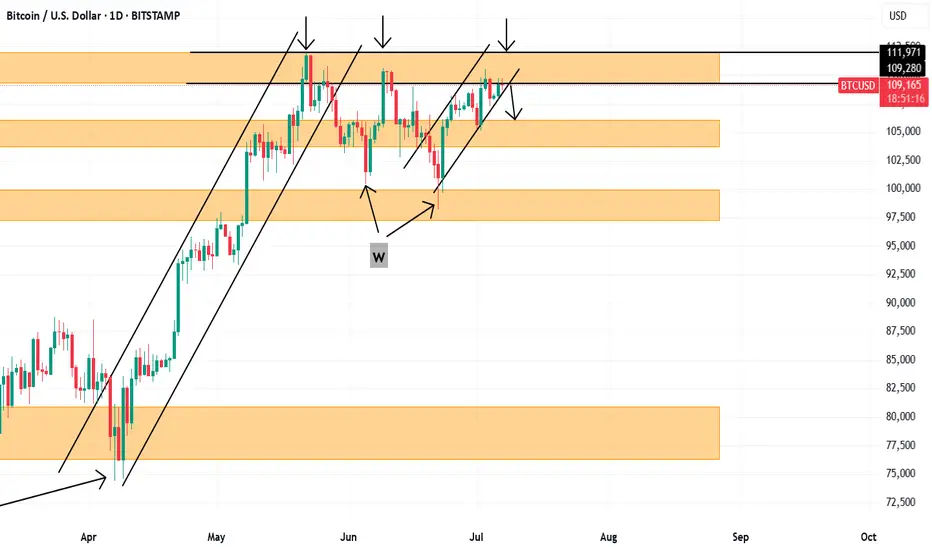
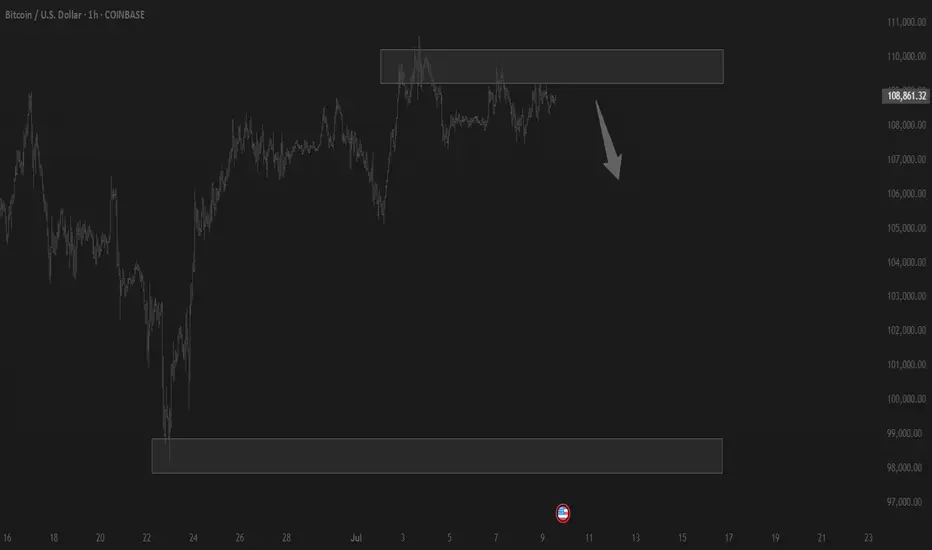
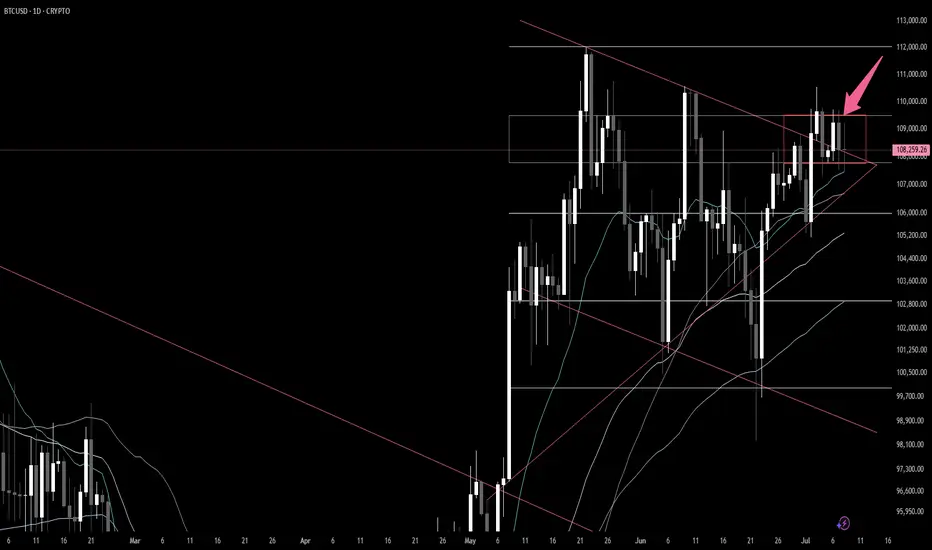
Bitcoin Movement UncertaintyThere have been powerful formations/patterns that one can always depend on when it comes to bitcoin. W formations,M formations and even triple top formations.
Current price has a W formation that is coming to a conclusion and has printed a triple top.
If you zoom in at 109160 you will see a small M formation more visible in smaller time frames and gives the hint of a short term SELL to 105446.
Alternatively, it can trade people into taking a sell and push upwards to 111971
BTCUSD.PM trade ideas
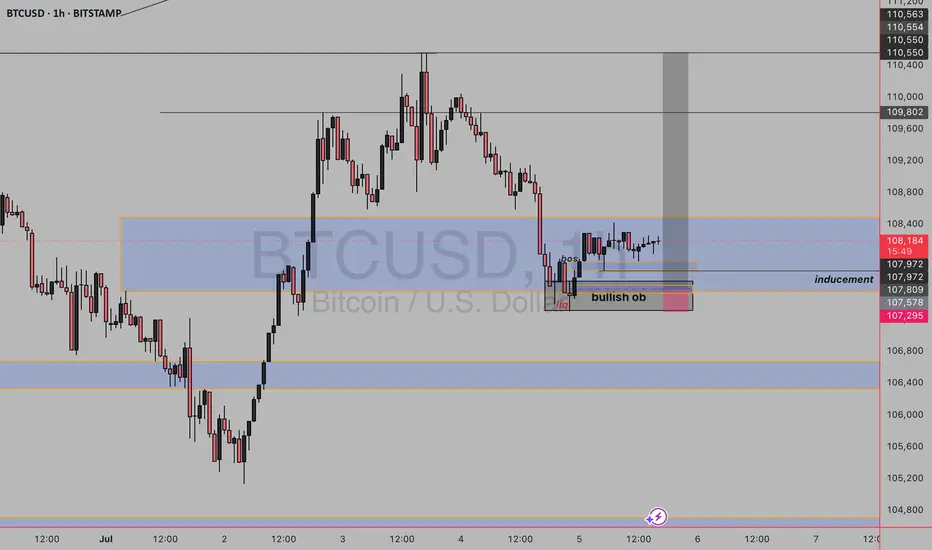
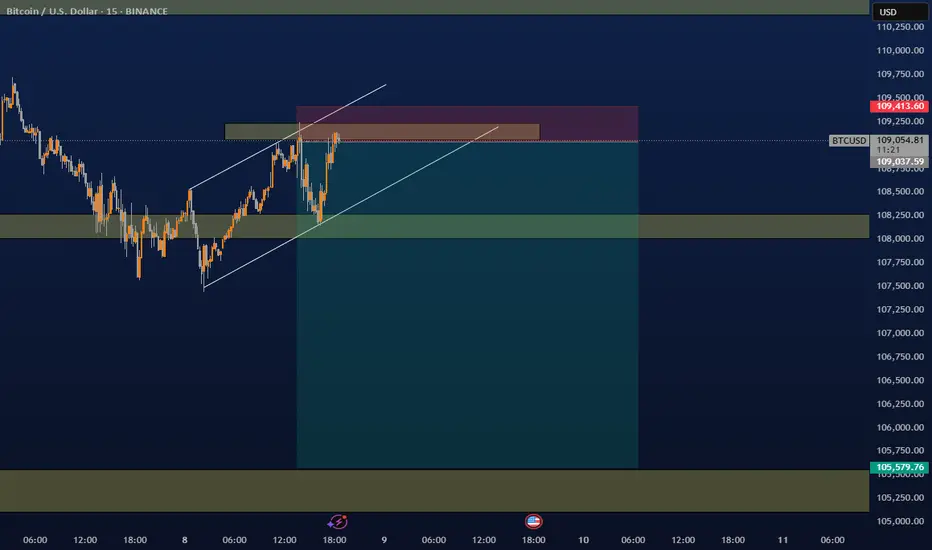
BULLISH BITCOINAs we can see we are currently on an uptrend on higher timeframe and price is in daily fvg and has mitigated the bullish order block on daily tf on lower timeframe we have seen liquidity sweep and break of structure and clear inducement provided so we wait for price to tap the ltf orderblock and buy
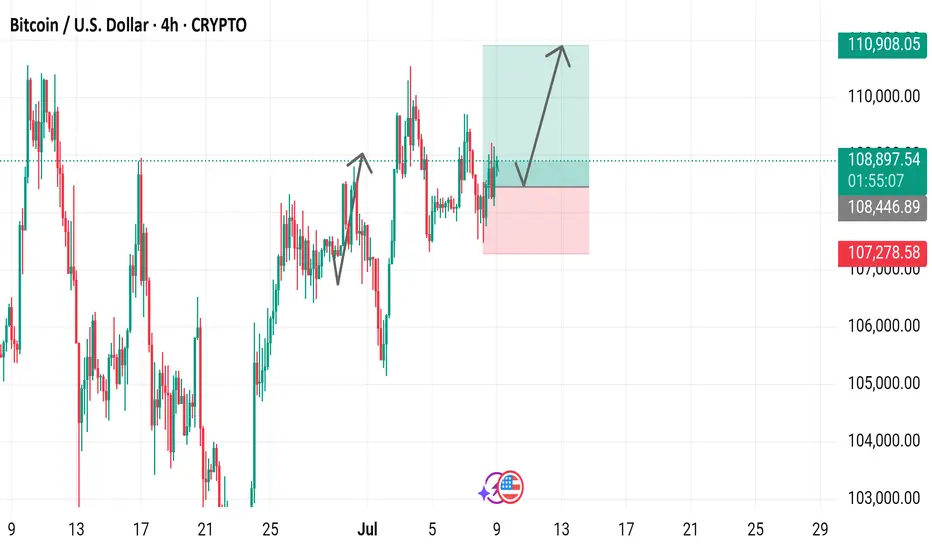
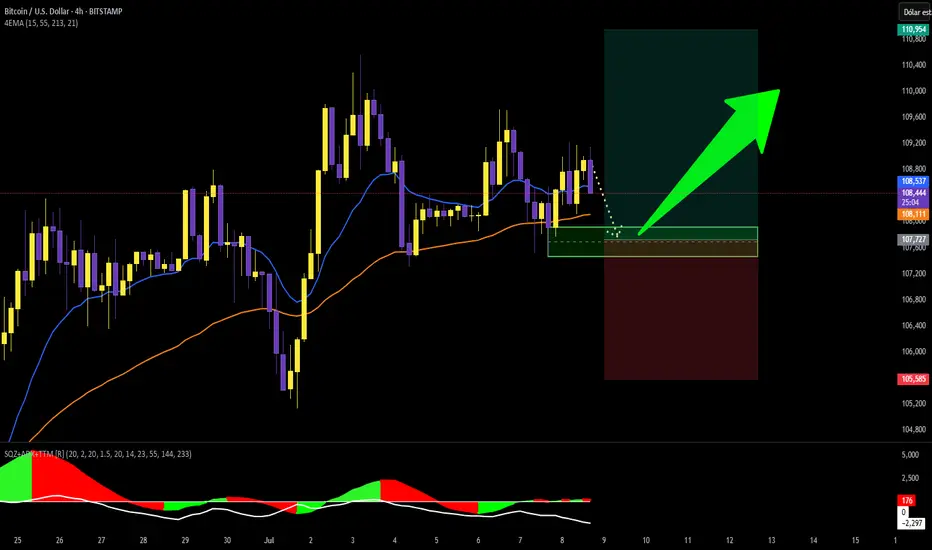
Bitcoin / U.S. Dollar 4-Hour Chart (BTCUSD)4-hour candlestick chart displays the price movement of Bitcoin (BTC) against the U.S. Dollar (USD) from late June to early July 2025. The current price is $108,895.04, with a 24-hour change of +$619.70 (+0.57%). Key levels include a support zone around $107,278.58 and a resistance near $110,908.05. The chart highlights recent price action, including a potential upward trend indicated by a green shaded area, with buy and sell signals marked at $108,895.04.
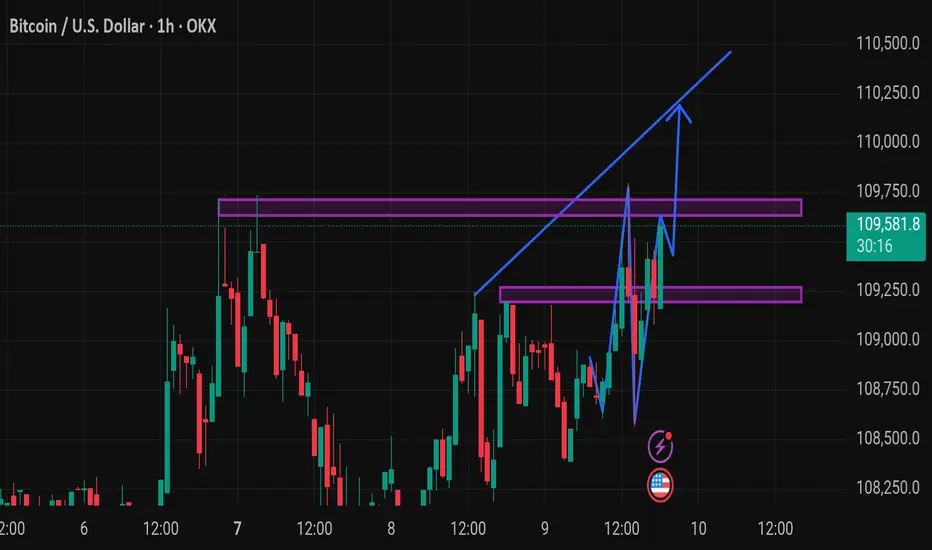
Btcusd techinical analysis.This BTC/USD 1-hour chart suggests a bullish breakout scenario. Here's a breakdown of key technical signals:
Key Observations:
1. Price Level: Current price is $109,582.1, with a recent rise of +0.59%.
2. Resistance Zones (Purple Boxes):
First resistance near $109,800 – $109,900.
Second (minor) resistance around $109,300 – $109,400.
Price is testing the upper resistance zone now.
3. Bullish W Pattern:
A sharp drop and recovery formed a “W” pattern—common before breakouts.
The neckline of this W is being challenged.
4. Trendline Breakout Projection (Blue Arrows):
The chart suggests a breakout projection towards $110,300 – $110,400.
This is based on the upward trajectory from the recent swing low.
5. Support Zone (Lower Purple Box):
Support established at $109,150 – $109,250.
If price
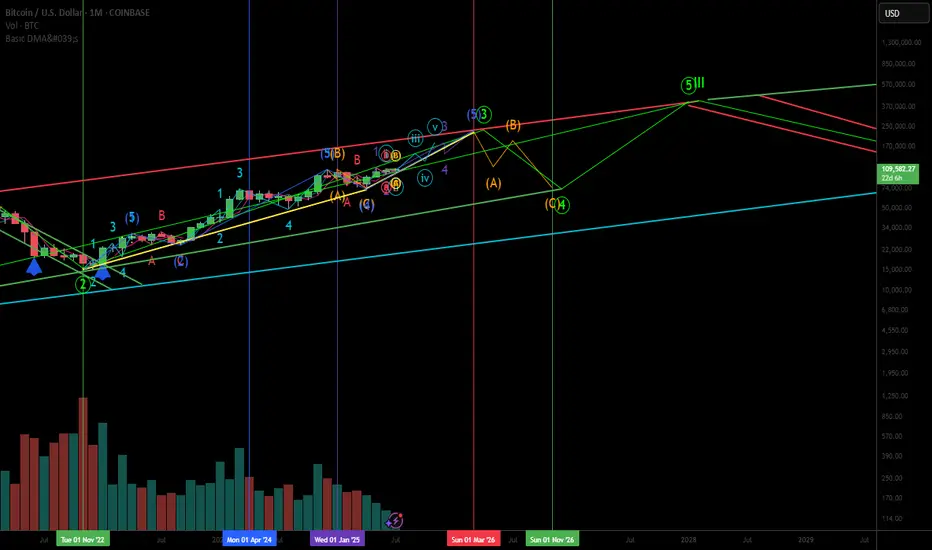
An Elliot Wave indicating a Bitcoin SupercyclePrimary cycle 3 ends approximately March 2026 at $225,000. Primary cycle 4 ends around Nov 2026 at $75,000. Primary cycle 5 and the end of cycle I ends near $400,000 in Jan 2028.
This illustrates Bob Loukas' latest thought toward an extended right translated bull Bitcoin cycle ending in early 2026 instead of the end of 2025. Then a shortened bear market that ends in Nov 2026, 4 years after the last bear cycle in Nov 2022.
Then a "left" translated cycle ending in Jan 2028 near $400,000 which completes Cycle I. It looks like a supercycle by combining the right translated current cycle with a left translated next cycle.
A good cycle strategy would be to take at least partial profit near $225,000, reaccumulate near $75,000 at the end of 2026 in anticipation of a big move up to near $400,000 by Jan 2028. A major sell at that point would be prudent. Loukas believes after a 12-16 month left translated cycle into early 2028 will be followed by a 2.5 year or more bear market to the end of 2030.
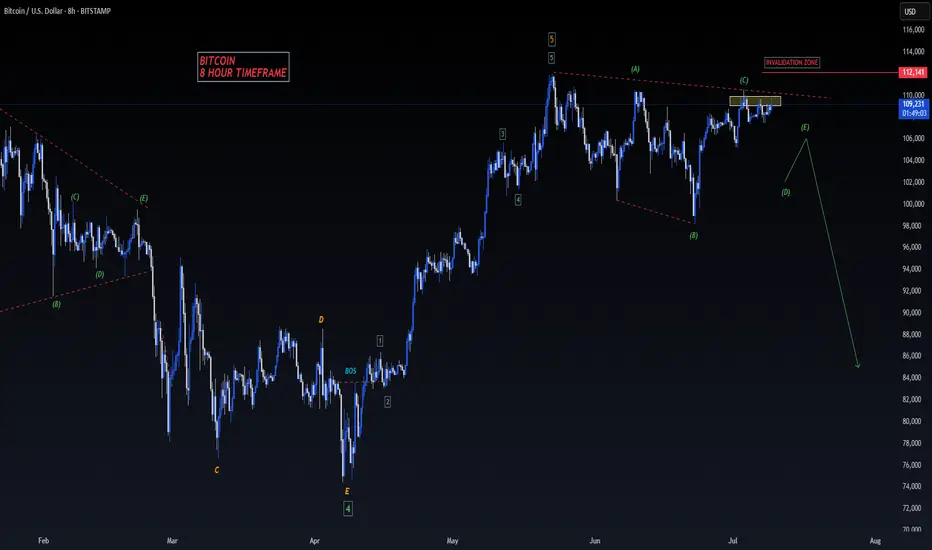
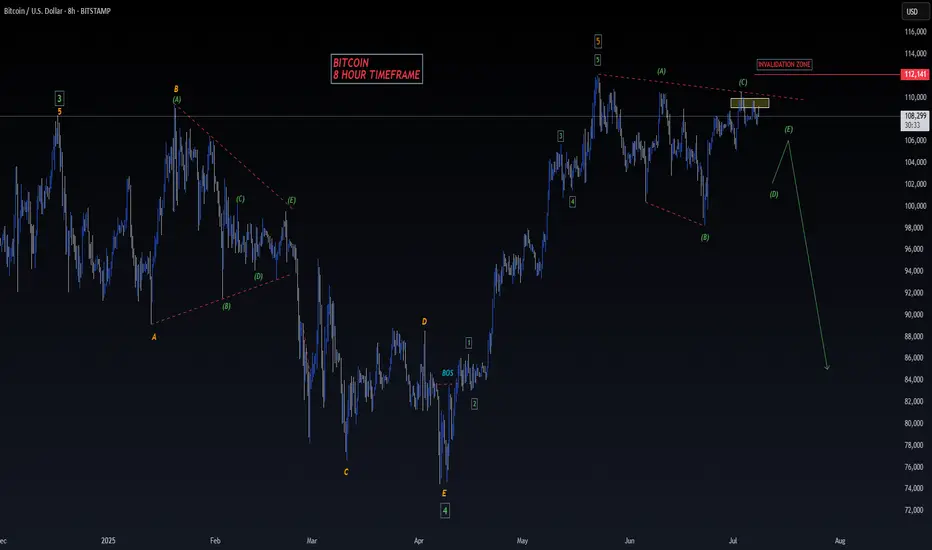
BITCOIN - SELL TO $86,000 (8H VIEW)I see selling opportunities right now for Bitcoin.
⭕️LQ Swiped Above Previous Wave 3 High ($109,000).
⭕️Wave 4 Complex Correction Complete (5 Sub-Waves).
⭕️(Wave 5 Impulse Bullish Move Complete (5 Sub-Waves of 1,2,3,4,5).
❌Invalidation Zone Above Wave 5 High ($112,140).
High risk trade as BTC could still head high for Wave 5 around $120- $130,000. Use strict risk management.
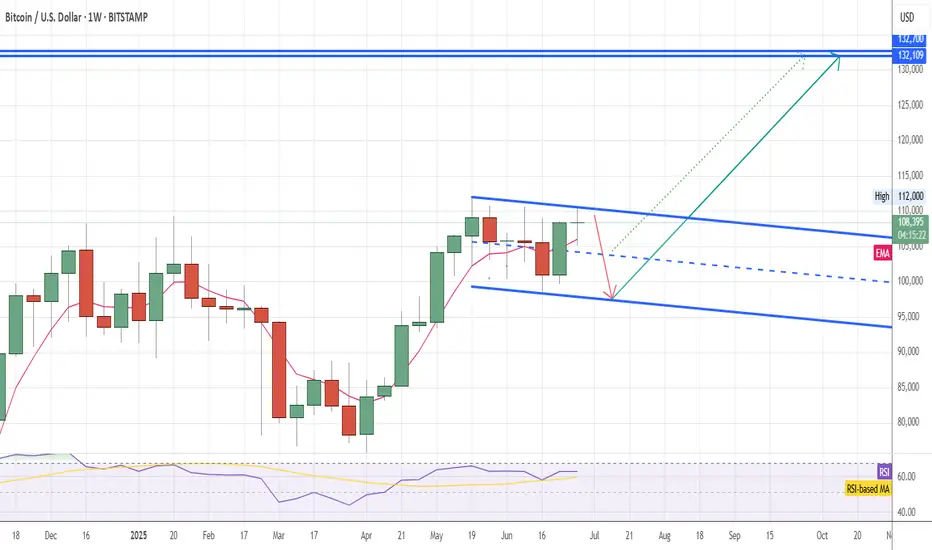
BTC waiting for channel breakBTC is compressing in a falling channel: in my view in the short term it could retrace at least to the channel mid line (around 104k) maybe to the channel lower trendline (around 97,5 - 97,8k).
Once the channel will be broken BTC will reach final bullish cycle target in the range
(132,109k - 132.700k) , then bearish cycle will start in autumn
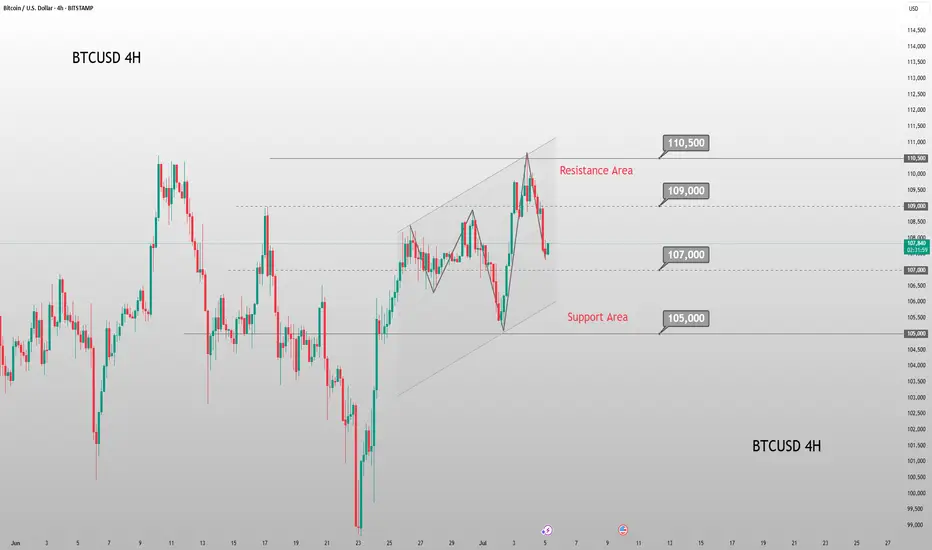
Trading balanceTrading balance The price of the asset has rebounded from the balance zone. With the prospect of growth into the resistance zone.
$BTC Elliot Wave Analysis - Weekend Update 7/9Hello fellow degenerates,
As we get ready for this new trading week, I am presenting to yall the 3 scenarios that I am looking for on Bitcoin.
- For scenario 1, we need a break above 110.4k to target the 126k-122k range.
- For scenario 2, we still need to complete our Wave 2, by retracing towards 103k. After that, we should see a reversal targeting 128k -123k
- The last scenario is based on the idea that we're failing to breakout from the parallel channel we currently have. We could see price traveling towards 98k - 90k range if we have a strong rejection of 110k and a break of our support levels.
- Levels to watch: 110.4k, 106.6k, 103.4k

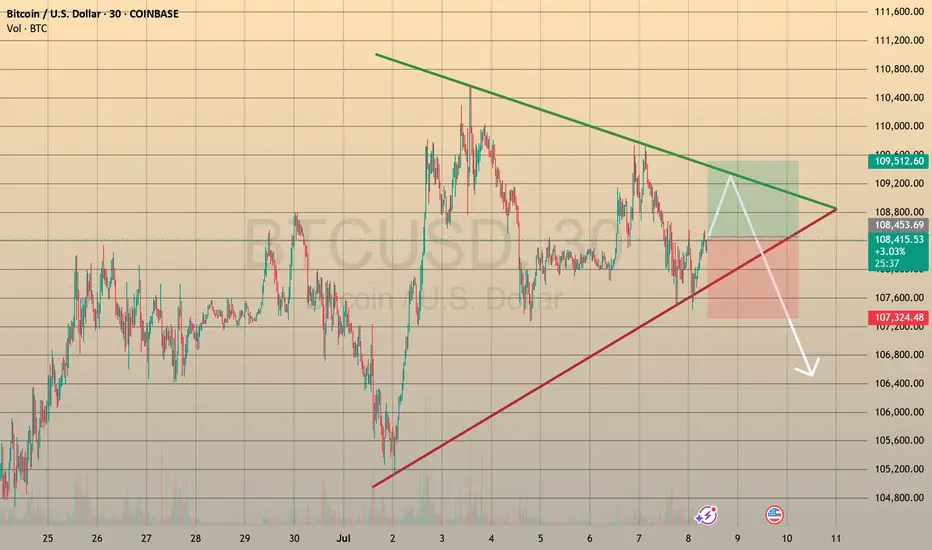
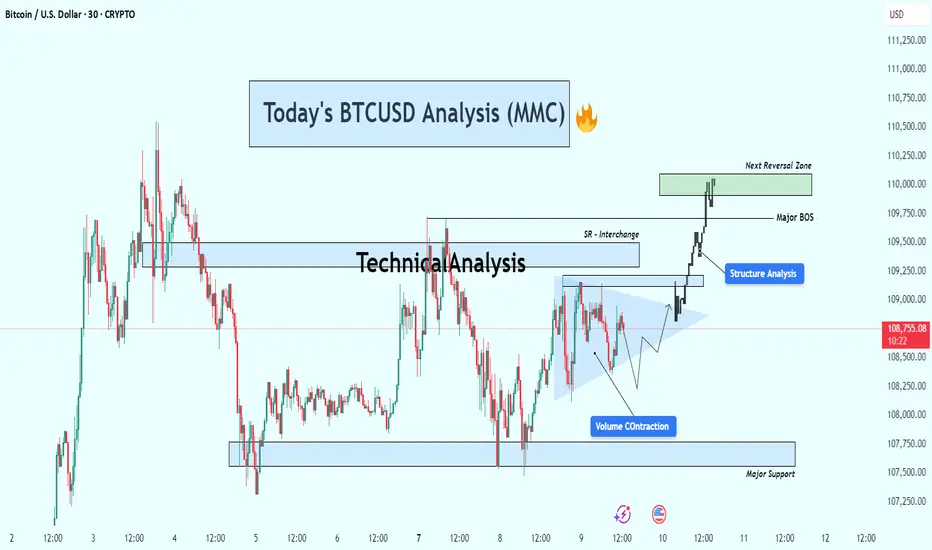
BTCUSD Breakout Confirmed – Targeting Next Reversal ZoneBitcoin (BTC/USD) is currently trading around $108,700, showing strong bullish momentum after breaking out of a consolidation structure. Price action has shifted significantly, with clear structural developments pointing toward continued upside — but not without caution around the next reversal zone.
🔍 Key Technical Insights:
🔹 1. Volume Contraction Triangle (Bullish Breakout)
The chart initially shows a volume contraction pattern forming a symmetrical triangle.
This pattern is often associated with market compression — a setup where smart money accumulates before a breakout.
BTC broke out of the triangle with strong bullish candles, confirming buyers have stepped in with conviction.
🔄 2. Structure Shift & Break of Structure (BOS)
A major BOS (Break of Structure) occurred as price broke previous swing highs, confirming a bullish market structure.
This BOS zone now acts as a potential support area if BTC pulls back.
A short-term SR interchange zone (Support becomes Resistance) was also respected and flipped again to support during the breakout — a clear sign of structural strength.
🧭 3. Next Reversal Zone – Supply in Sight
Price is approaching a major supply/reversal zone between $109,750 and $110,250.
This zone has previously shown strong selling interest.
Traders should watch for rejection or continuation patterns within this zone — such as bearish divergence, exhaustion candles, or confirmation of resistance.
🛡 4. Major Support Level
Below current price, a major support zone around $107,500–$107,800 remains intact.
This zone has provided a solid base during past consolidations and would be the first area of interest for buyers if a retracement occurs.
📌 Strategy Plan:
🔼 For Bullish Traders:
Those already in the breakout can hold with targets toward $110,000–$110,250.
If not in yet, wait for a retest of BOS/SR zone (~$109,000) for a safer re-entry.
Consider partial take-profits within the green reversal zone.
🔽 For Bearish Traders:
Watch for price exhaustion or a fake breakout in the reversal zone.
Potential short setups could form only if price fails to hold above the BOS zone and prints a lower high.
🔧 Technical Summary:
✅ Structure: Bullish Break of Structure confirmed
🔺 Momentum: Strong upside following volume contraction
📍 Next Key Resistance: $110,000–$110,250
📉 Major Support: $107,500–$107,800
⚠️ Caution Zone: Reversal area ahead – watch price action closely
Conclusion :
Bitcoin looks set to challenge the $110K psychological level as buyers remain in control. However, the reversal zone above is critical. A clean break and hold above it could open doors to further highs, while rejection here may trigger short-term pullbacks or range-bound conditions.
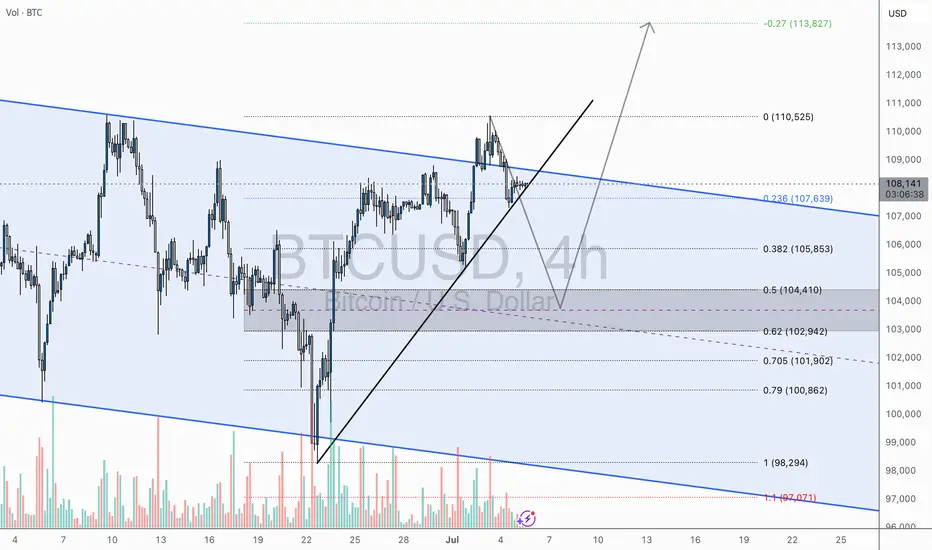
BTC/USD – Pullback Before Moonshot?4H Outlook by WrightWayInvestments
Bitcoin just delivered a textbook breakout from the descending channel and is currently consolidating above the breakout trendline. This is a critical zone where market participants are deciding between continuation or a retest.
🧠 Technical Breakdown:
🔹 Breakout Confirmation – Clean bullish breakout above channel resistance
🔹 Ascending Trendline Support – Currently being tested
🔹 Fibonacci Reload Zone – Between 0.382–0.618 (🟦 $105,853–$102,942)
🔹 Bullish Scenario – Potential higher low before aiming for major fib extension
🔹 Target Zones:
• TP1: $110,525
• TP2: $113,827
🧭 Game Plan:
A retracement into the fib support zone ($104K–$102.9K) offers the highest RR for long entries, ideally on bullish candlestick confirmation + volume spike. A break and close above $108.5K could negate pullback expectations and signal direct continuation.
🔔 Final Note:
Volume expansion on breakout + controlled retrace = power setup.
Let the market come to you — high-probability zones don’t chase.
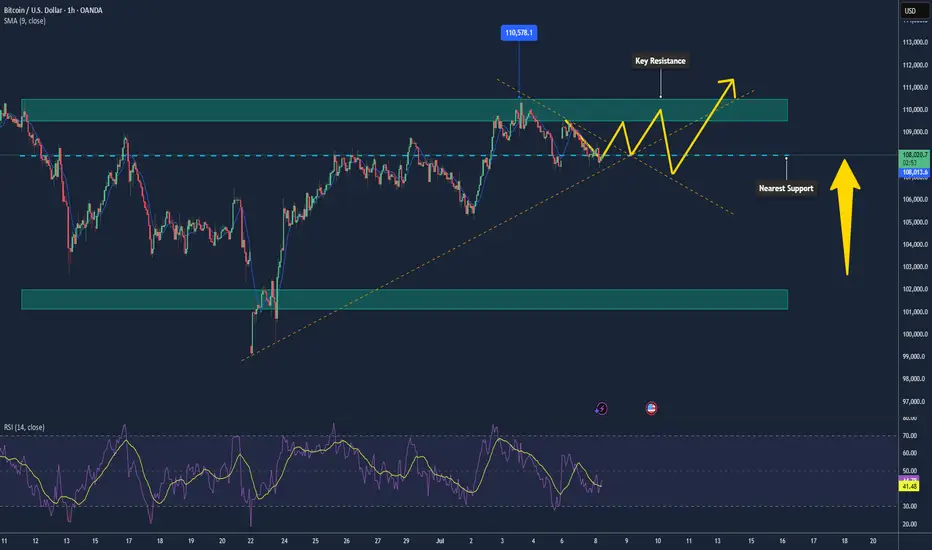
Bitcoin Ranging Below $110k – Poised for a Breakout📊 Market Overview:
Bitcoin is consolidating around $108–109k, reflecting indecision as investors await clearer signals. Institutional ETF inflows remain strong, and recent moves from 2011-era dormant wallets sparked concern but no major sell-off. Positive ETF news or supportive crypto policies could propel the next move upward.
📉 Technical Analysis:
• Major resistance: $109,500 – $110,500
• Nearest support: $108,000; secondary support at $102,000
• EMA09 (1 h): Price is above the 20 EMA and has reclaimed the 200 SMA on the 1 h chart, signaling a technical rebound
• Candlestick / Volume / Momentum: A mild bounce from $108k with low volume; Bollinger Bands show a mid-range price, hinting at sideways action .
📌 Outlook:
Bitcoin may remain range-bound between $108k and $110k. A breakout above $110.5k with strong volume could push toward $112k–115k. Conversely, a break below $108k might trigger a dip toward $102k.
Suggested Trading Strategy
SELL Bitcoin/USD at: 109,000 – 110,000
🎯 TP: 108,000 / 105,000
❌ SL: 110,800
BUY Bitcoin/USD at: 108,000 – 107,500
🎯 TP: 109,500 / 112,000
❌ SL: 107,000
BTC/USDT, 4H chart, Futures - Bullish projection.The price of BTC is reaching points where the most likely direction is upwards, looking for areas from 107,900 to 107,400 would be long entries in the 4H futures chart with a stop at 2%
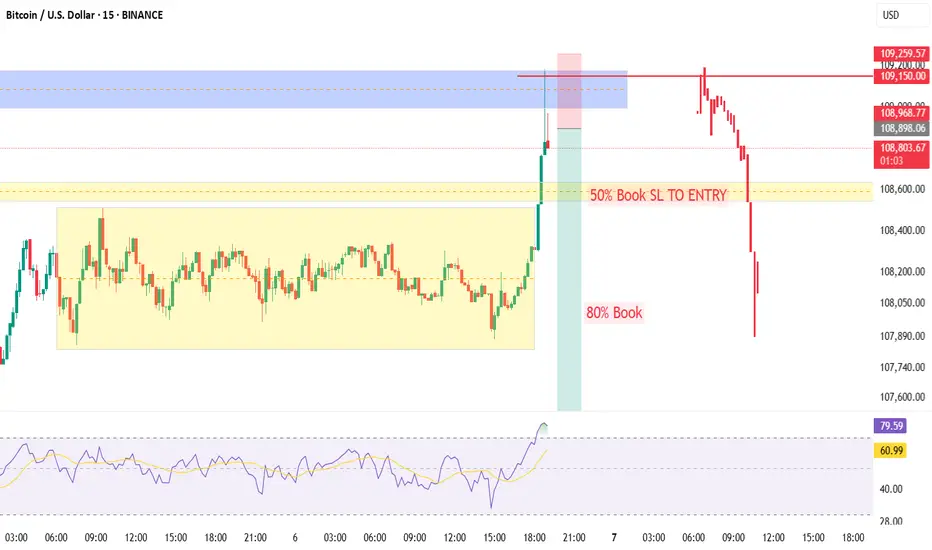
Weekend BTC Trend Analysis and Trading SuggestionsLet's review this afternoon's market performance. The BTC price, as we anticipated, rebounded to around 109,000 in the afternoon before plummeting sharply. Living up to "Black Friday", this violent drop was well within our expectations. In the afternoon's live trading, we also reminded everyone that as long as there was a rebound to the upper zone, it was a good opportunity to go short. This drop has created a space of nearly 1,500 points. Currently, the BTC price has pulled back to around 107,800.
From the current 4-hour K-line chart, after a strong upward surge, the market encountered significant resistance near the upper track of the Bollinger Bands. As bullish momentum gradually faded, the price started to come under pressure and decline, suggesting that the short-term upward trend may come to a temporary halt. At present, the market has recorded multiple consecutive candlesticks with large bearish bodies. The price has not only effectively broken below the key support level of the Bollinger Bands' middle track but also caused the Bollinger Bands channel to switch from expanding to narrowing, indicating that market volatility is decreasing. In terms of trading volume, it showed a moderate increase during the price pullback, which further confirms the authenticity of the bearish selling pressure.
BTCUSD
sell@108000-1085000
tp:107000-106000
Investment itself is not the source of risk; it is only when investment behavior escapes rational control that risks lie in wait. In the trading process, always bear in mind that restraining impulsiveness is the primary criterion for success. I share trading signals daily, and all signals have been accurate without error for a full month. Regardless of your past profits or losses, with my assistance, you have the hope to achieve a breakthrough in your investment.
SHORT in BTCUSDHello, fellow traders!
Yesterday I shared a short setup on GBP/USD. While it hasn’t reached the take-profit yet, the trade is still tracking as planned.
Today I’m opening a new short position in Bitcoin. Over the next few days, I’m anticipating a potential drop of $3 – 4 K in price.
Btc / UsdtBITSTAMP:BTCUSD
1. **Current Price Zone (\~108,000):**
* Price is consolidating just under a supply zone (red rectangle), showing potential rejection from the upside.
* The price briefly pushed above the rising trendline but failed to hold it.
2. **Bearish Structure Forming:**
* Price action suggests a **lower high** and potential **head-and-shoulders** pattern.
* Red squiggle indicates a likely **short-term bearish movement** — a drop to the **demand zone** around **105,700–106,900**.
3. **Demand Zone/Order Block:**
* Marked below near **105,741** with label **"Order"**, showing where potential buy orders may sit.
* This is the first major area where price might find support.
4. **Downside Levels:**
* **106,933** and **105,741**: Potential short-term supports.
* **98,332 (Weekly level)**: If the structure breaks fully, price could revisit this major demand zone.
5. **Upside Resistance:**
* **Red supply zone above 109,000** acts as strong resistance — if BTC breaks that with volume, bullish bias resumes.
---
### 📉 **Short-Term Bias:**
* **Bearish** unless BTC breaks and holds above **109,000**.
* Expecting a pullback toward **106.9k** or **105.7k**, which may offer **buy-the-dip** opportunities.
Disclaimer : Not Financial Advice

108-109.5 SupportIt appears as though BTC is attempting to create a level of support around 108-109.5 with 109.5 acting as a resistance level. Hopefully we see the price begin to break higher as a result of this support creation. Soon, very soon, we should know which direction things will go.
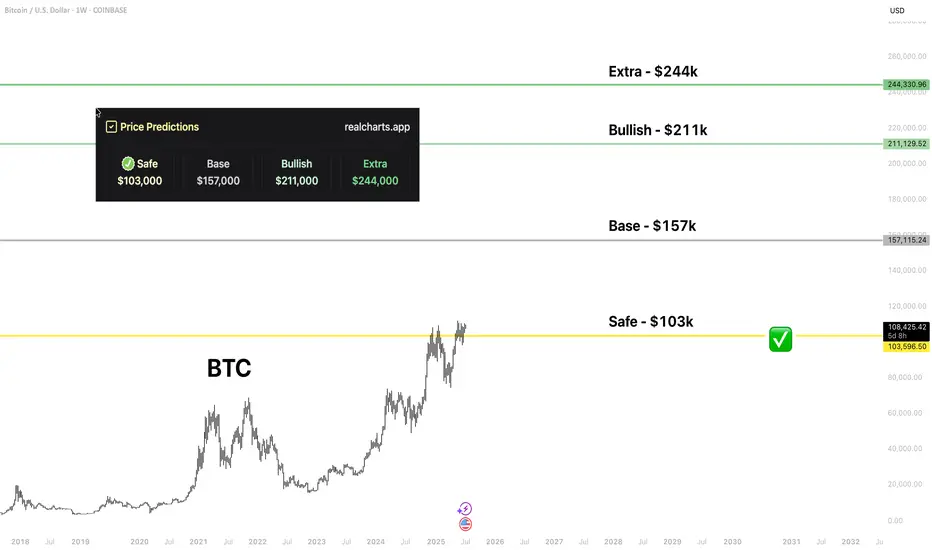
BTC | Price PredictionPrice prediction based on the target from my platform. Bitcoin is looking good with this "forever upside". The more money Bitcoin hits, the more money altcoins would get. This is the rule of crypto, because the same whales on altcoins are the same on Bitcoin.
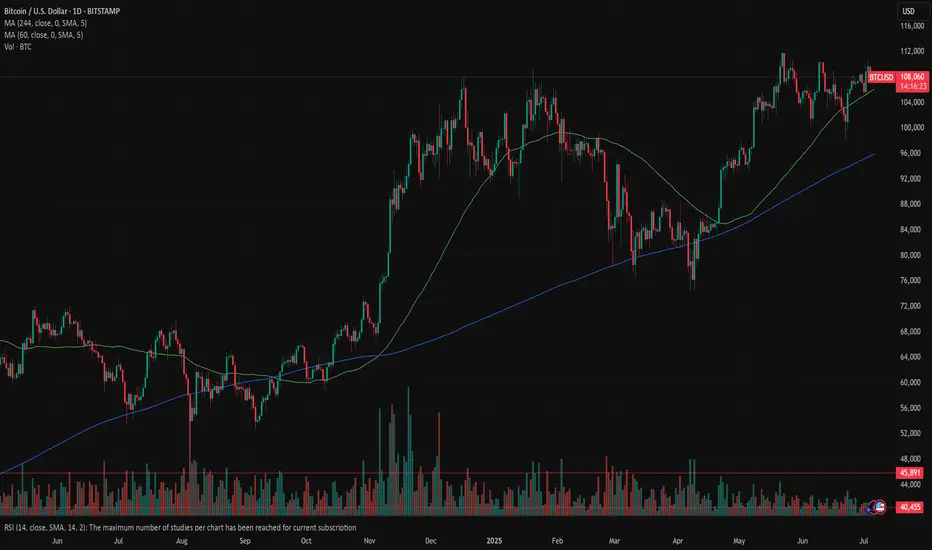
Bitcoin: higher for longer?The investors optimism supported by better than expected US jobs data was reflected mostly in the US equity market, but the crypto market was not left behind on this occasion. Although the week for crypto was quite volatile, it showed that investors are still strongly considering investments in crypto coins for diversification of portfolios, especially BTC. The BTC spent a week struggling around the level of $107K, while making its final breakthrough toward the upside, reaching the highest weekly level at $110K. It is ending the week around the level of $108K, with an equal level of buying and selling order during the weekend.
Although the price was pushed toward the $110K, the RSI did not reach the overbought market side. Actually, the indicator continued to move between levels of 50 and 60, indicating that the market is still not ready to finish the cycle and revert it toward the oversold market side. Although slowed down, the MA50 is still oriented toward the upside, same as MA200, without an indication that the cross might occur anytime soon.
Current charts are indicating the probability that the support line at $106K might be tested again in the coming period. This short reversal is necessary for BTC in order to collect enough interest for a further push toward the upside. Whether the BTC will have strength to try to reach old ATH, remains unclear from current charts, but some indication holds. However, there is some probability that the $110K might be tested for one more time.
BITCOIN - SELL TO $86,000 (8H VIEW)I see possible shorting opportunities right now for BTC.
⭕️LQ Swiped Above Previous Wave 3 High ($109,000).
⭕️Wave 4 Complex Correction Complete (5 Sub-Waves).
⭕️(Wave 5 Impulse Bullish Move Complete (5 Sub-Waves of 1,2,3,4,5).
❌Invalidation Zone Above Wave 5 High ($112,140).
High risk trade as BTC could still head high for Wave 5 around $120- $130,000. Use strict risk management.
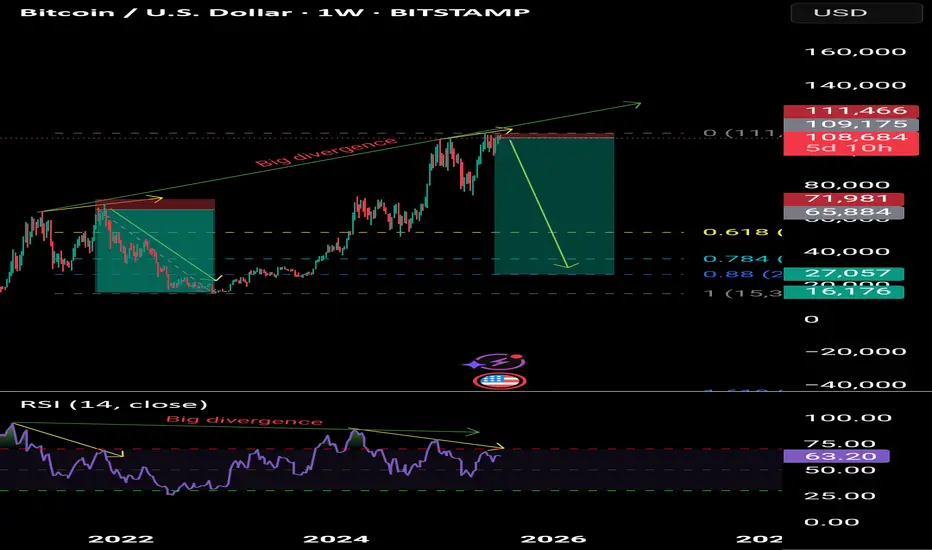
Bitcoin to the 30,000 levelBitcoin to the 30,000 level
On the weekly time frame, there is a negative divergence of Masoud and the winner is the one who keeps her sell trade below 30,000.
BTCUSD TRADES SIDEWAYS DUE TO A LACK OF DRIVING FACTORS
BTCUSD has been moving within sideways since the end of last week. This week there will be lack of news. The first significant will be FOMC minutes tomorrow, which will definitely affect the DXY index and bitcoin. So before that time I expect that the sideways dynamic of the asset will remain.
So, nothing to trade? Not really
We may consider entering long positions at a current price with a take profit nearby 0.786 Fibo and a stop loss just below the previous low:
🔼 a market buy order at 108078.50 with
❌a stop loss at 107389.50 and
🤑a take profit at 109176.65
After that I expect the price to rebound from the upper border of the triangle. Maybe will consider another long entry.