BTCUSD: Whales Move 80,000 BTC, Shaking the MarketBTCUSD on Alert: Whales Move 80,000 BTC, Shaking the Market
By Ion Jauregui – Analyst at ActivTrades
The cryptocurrency market witnessed one of the year’s most puzzling moves this week. Over 80,000 Bitcoins—worth more than $8.6 billion—were transferred from wallets that had been inactive since the early years of the crypto ecosystem. These transfers, originating from addresses linked to 2010 and 2011, sparked a wave of reactions among investors, analysts, and crypto enthusiasts.
Fundamental Analysis: Mass Sell-Off or Simple Restructuring?
The market's initial response was uncertainty. It’s unusual for wallets from the so-called “Satoshi era” to become active again. However, research led by Arkham Intelligence and other on-chain analysis firms indicates that this was not an immediate sale. The BTC was not sent to exchanges, but to new addresses—possibly with enhanced security (SegWit or multisig technologies)—suggesting an internal reorganization rather than a liquidation.
On a macro level, the environment remains favorable for Bitcoin:
– Institutional inflows via ETFs have already surpassed $14 billion in 2025.
– Broader adoption is expected, driven by proposals such as the creation of a strategic Bitcoin reserve in the U.S. and clearer regulations in advanced economies.
– The market has shown resilience in the face of similar events in the past, reducing the risk of a structural correction.
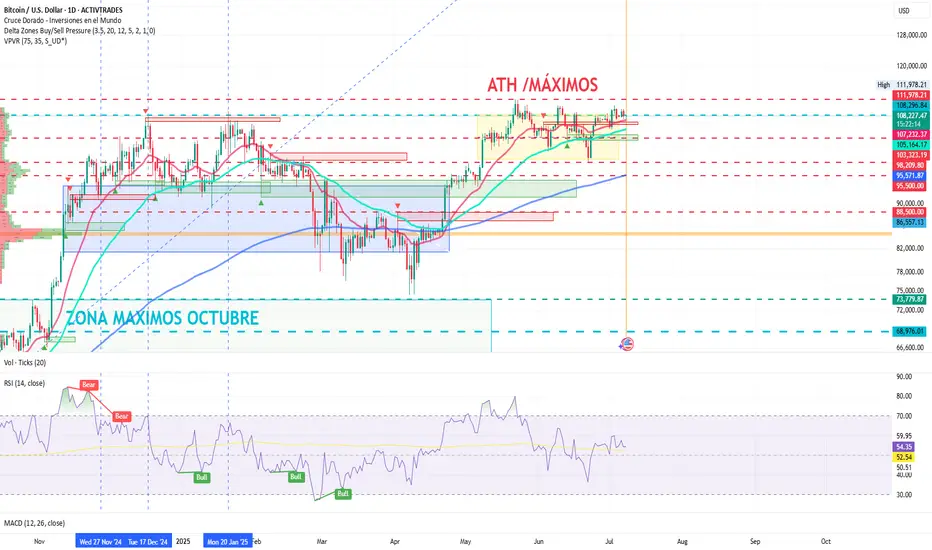
Technical Analysis: Consolidation Zone with Key Resistance at $112,000
From a technical perspective, Bitcoin has maintained a strong bullish structure in recent weeks but is currently in a consolidation phase near its all-time highs:
• Key support: $103,477, located mid-range of the current consolidation zone. The lower bound sits at $98,209, where the price has reacted positively following the whale movements. The delta pressure zone is positioned at the upper part of the range, near current price levels.
• Immediate resistance: $111,978.21, a breakout of which could open the door to a move toward $112,000–$115,000.
• Daily RSI: Neutral bias with slight overbought conditions at 54.11%.
• Moving averages: The 50- and 100-day EMAs show clear compression—typically a precursor to a breakout—while the 200-day EMA remains well expanded, appearing to support the current consolidation.
Volume remains elevated but without speculative spikes, and funding rates in the derivatives market are still positive, suggesting sustained buying interest.
Conclusion: A Symbolic Shake-Up Rather Than a Threat
Although the whale movements have made headlines and stirred speculation about a possible sell-off, the signs point to a technical update rather than a shift in trend. The market has remained stable over the past 48 hours, with technical indicators and macro fundamentals supporting a short-term neutral-to-bullish outlook.
The key will be whether these funds remain dormant or begin to disperse in smaller transactions. For now, the crypto ecosystem has weathered the shake-up without major consequences, reinforcing the growing maturity of an increasingly institutional market.
*******************************************************************************************
The information provided does not constitute investment research. The material has not been prepared in accordance with the legal requirements designed to promote the independence of investment research and such should be considered a marketing communication.
All information has been prepared by ActivTrades ("AT"). The information does not contain a record of AT's prices, or an offer of or solicitation for a transaction in any financial instrument. No representation or warranty is given as to the accuracy or completeness of this information.
Any material provided does not have regard to the specific investment objective and financial situation of any person who may receive it. Past performance is not reliable indicator of future performance. AT provides an execution-only service. Consequently, any person acting on the information provided does so at their own risk. Political risk is unpredictable. Central bank actions can vary. Platform tools do not guarantee success. Regulated status does not guarantee security.
BTCUSD.PM trade ideas
BTCUSDBased on NeoWave Analysis:
We should wait for the end of wave 5, getting ready for a Sell position.
BTC setup with a 3.9 risk-to-reward ratio.Is BTC beginning a bullish move toward 120K?
This setup offers a 3.9 R:R with an
Entry at 109,000
Stop loss at 106,355
Target 120,000
Not financial advice.
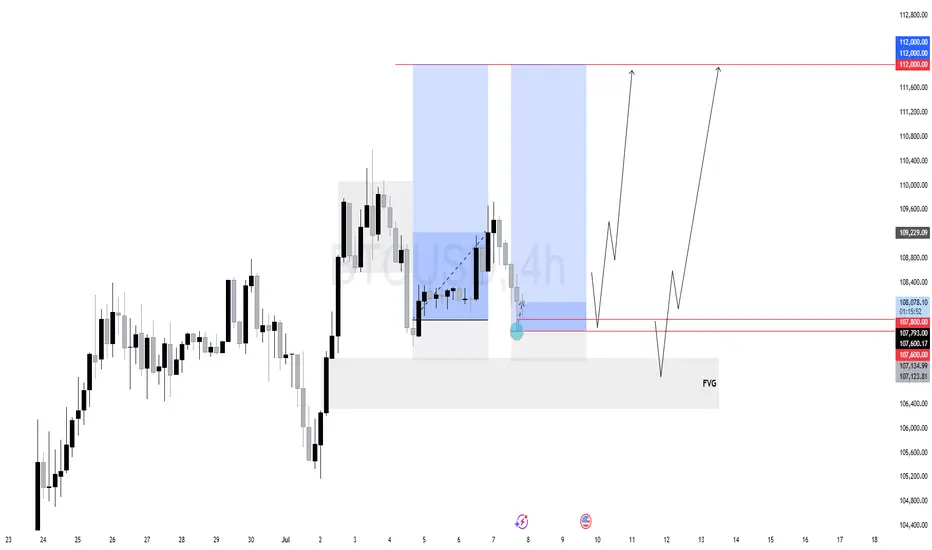
$BTC (BITCOIN) 4HPrice previously rallied strongly from a Fair Value Gap (FVG) at the bottom of the chart, forming a bullish market structure.
After a bullish displacement, BTC consolidated in a tight range (reaccumulation) and swept internal liquidity before breaking down.
Now, price has returned to a critical discount zone around 107800–107600
First Target: 109,229 — internal range high.
Main Objective: 112,000 — resting external liquidity above a clean high.
As long as BTC holds above 107600, we remain bullish. The current area is perfect for accumulation before a potential expansion phase toward external liquidity.
BTC flag with a pole to 140on a weekly BTC formed a flag, on Daily it's already bouncing off the flag treandline. the pole measured move is to 140. Just what my eye thinks it sees :)

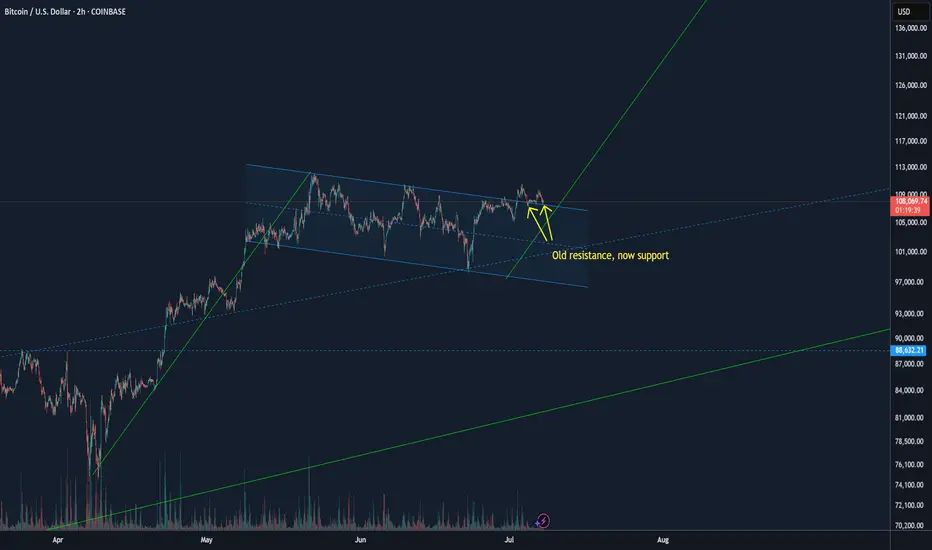
BTC moving higher, 140K not that crazyIf you're looking to short BTC around the 110K range thinking "oh yeah, this is the fourth or so time its been at 110, I'll make a quick buck".. don't. This is looking very different.
BTC has already broken out of its current resistance channel and its now acting as support. You can see its bounced off of support once and its hovering around there again.
All that BTC needs to do it do a small move up past its ATH and it's off to the races.
If the bull flag pattern holds true the move could go as high as $140k.
BTC Storm of Consolidation, New Money, and Macro-PoliticsBitcoin at the Precipice: A Perfect Storm of Consolidation, New Money, and Macro-Political Tailwinds
In the intricate and often tempestuous world of digital assets, there are moments of frantic volatility and periods of eerie calm. Bitcoin, the undisputed king of cryptocurrencies, currently finds itself in one of these fascinating lulls—a state of high-altitude consolidation that is anything but sleepy. Trading just a whisper away from its all-time high, the asset is coiling like a spring, absorbing immense selling pressure from early adopters while simultaneously drawing in a new, powerful wave of buyers. This delicate equilibrium, however, is set against a backdrop of explosive potential catalysts. From tightening technical indicators screaming of an imminent breakout to the looming deadline of US tariffs, the vocal endorsement of tech titans, and the unprecedented entry of Bitcoin into the mainstream political arena, the stage is being meticulously set. The question on every analyst's and investor's mind is no longer if Bitcoin will make its next major move, but when, and just how monumental it will be. This is not just another market cycle; it is a convergence of forces that could propel Bitcoin toward price horizons that were once the domain of only the most fervent optimists.
The Anatomy of a Healthy Consolidation: Whales Recede as a New Foundation is Built
At first glance, a market that stalls just below its peak might seem like a sign of weakness, an indication that the bullish momentum has been exhausted. However, a deeper look into the current structure of the Bitcoin market reveals a picture of profound strength and maturity. This period of consolidation is characterized by a crucial and healthy rotation of ownership. The so-called "whales"—early investors and large-scale holders who have accumulated vast quantities of Bitcoin at much lower prices—are beginning to ease their holdings. This is not the panic-selling seen during bear market capitulations. Rather, it is a strategic and logical process of taking profits, de-risking portfolios, and realizing life-changing gains after a historic run.
Every Bitcoin sold by a whale must be bought by someone else, and the identity of these new buyers is what makes the current phase so compellingly bullish. The supply being released onto the market is not causing a price crash; instead, it is being steadily absorbed by a fresh cohort of participants. This new wave includes a diverse mix of players: retail investors who are gaining confidence as Bitcoin solidifies its mainstream status, smaller institutional players who are now more comfortable entering the market, and, most significantly, corporations that are beginning to view Bitcoin as a legitimate treasury reserve asset. This process is akin to the changing of the guard. The early pioneers are passing the baton to a new generation of holders who are establishing a new, higher cost basis. This dynamic is incredibly constructive for long-term price stability. It builds a robust and formidable wall of support at these elevated price levels, transforming what was once a speculative peak into a solid foundation for the next leg up.
Further evidence of this underlying strength can be seen in Bitcoin's recent weekly performance. The asset has managed to set another record high weekly close. In the world of technical analysis, a weekly close is considered far more significant than a brief, volatile intraday spike. An intraday high can be the result of a short-lived speculative frenzy or a liquidation cascade, but a high weekly close demonstrates sustained buying pressure and conviction over a longer duration. It signifies that, for seven straight days, buyers successfully defended higher price levels against sellers, ultimately winning the battle as the candle closed. This repeated ability to secure high weekly closes indicates that the market is systematically accepting and validating these new price territories, creating a psychological and technical launchpad for a future assault on all-time highs. Traders are now intensely focused on this dynamic, attempting to pinpoint the new, higher bottoms of this consolidation range, recognizing that these levels are likely to serve as the bedrock for the next major bull run.
The Technical Cauldron: Bollinger Bands Signal an Imminent and Violent Breakout
While the fundamental picture is one of healthy rotation, the technical charts are sending an even more urgent message: prepare for a massive move. Among the myriad of indicators used by traders, the Bollinger Bands are currently painting a particularly dramatic picture. Bollinger Bands consist of three lines plotted over a price chart. The middle band is a simple moving average, while the upper and lower bands are positioned at a set number of standard deviations away from the middle band. In essence, they are a direct measure of market volatility. When the market is volatile, the bands widen. When the market is calm and consolidating, the bands contract, or "squeeze."
Bitcoin is currently in the midst of one of the most significant Bollinger Band squeezes seen in recent history. The upper and lower bands have drawn incredibly close to one another, indicating that volatility has been wrung out of the market to an extreme degree. Historically, such periods of low volatility are the calm before the storm. A Bollinger Band squeeze is almost always resolved by a period of explosive, high volatility—a powerful breakout. The longer and tighter the squeeze, the more violent the subsequent price move tends to be. The indicator itself does not predict the direction of the breakout, but in the current context, the directional bias is overwhelmingly clear. With Bitcoin consolidating just shy of its all-time high after a powerful uptrend, and with the fundamental backdrop being so strong, the path of least resistance is overwhelmingly to the upside.
This technical setup creates a powerful psychological feedback loop. As more traders and algorithms spot the tightening bands, they begin to position themselves for the inevitable breakout. This builds a massive amount of potential energy within the market. When the price finally does break through the upper band, it can trigger a cascade of buy orders—from traders entering new long positions, to short-sellers being forced to buy back to cover their losing bets. This rush of buying pressure is what can turn a simple breakout into a parabolic, face-ripping rally.
The anticipation surrounding this move has led to some audacious price targets being discussed. Analysts are now contemplating the possibility of a "false move" to as high as $105,000. The term "false move" in this context is intriguing. It could imply a rapid, almost wick-like surge to that level, driven by extreme speculation and leverage, which might then be followed by a sharp correction to shake out the "paper hands" before a more sustainable climb resumes. Alternatively, it could simply be a way of expressing disbelief at the sheer velocity of the potential move. Whether the target is $105,000 or another figure, the underlying message from the charts is unambiguous: Bitcoin is on the verge of a big move, and the technicals strongly suggest it will be a powerful breakout to the upside, potentially ushering in a new phase of price discovery.
The Confluence of Catalysts: Tariffs, Politics, and The Musk Effect
A primed technical setup is potent on its own, but when combined with powerful external catalysts, it creates the recipe for a perfect storm. Bitcoin's next potential move is not just being driven by its internal market dynamics; it is being pulled forward by a confluence of macroeconomic and political forces that are aligning in its favor.
One of the most significant near-term catalysts is the looming US tariff deadline. Historically, periods of geopolitical tension and economic uncertainty have been incredibly bullish for Bitcoin. Tariffs, trade wars, and protectionist policies create instability in global markets and can erode the value and trust in fiat currencies. As nations engage in economic conflict, savvy investors and even central banks begin to look for non-sovereign, censorship-resistant stores of value to hedge their wealth. Bitcoin, with its decentralized nature and fixed supply, is the ultimate hedge against such fiat currency debasement and geopolitical turmoil. The impending tariff deadline is forcing a global conversation about the stability of the current financial system, and Bitcoin stands to be a primary beneficiary as capital seeks a safe haven from the storm.
Adding fuel to this fire is the upcoming "Crypto Week," a period of heightened focus on the industry through conferences, major announcements, and media coverage. These events act as a gravitational force, pulling the attention of the financial world toward the digital asset space. This concentrated attention almost always leads to increased trading volume and volatility. It creates a self-fulfilling prophecy where the expectation of big news and market moves encourages traders to participate, thereby creating the very volatility they anticipated.
Perhaps the most electrifying and unpredictable catalyst, however, is the re-emergence of Elon Musk's "love" for Bitcoin and the asset's dramatic entrance onto the main stage of American politics. Musk, with his colossal social media following, has a proven and unparalleled ability to influence market sentiment with a single post. His recent teasing of a "Pro-Bitcoin America Party" has sent shockwaves far beyond the crypto community. This move, whether serious or satirical, has injected Bitcoin directly into the heart of the US political discourse. It reframes Bitcoin not just as a financial asset, but as a political symbol—a representation of innovation, decentralization, and freedom from government control.
This has been met with a reaction from other major political figures, including Donald Trump, creating a fascinating push-and-pull. The fact that leading presidential candidates and political influencers are now debating Bitcoin's merits and role in the nation's future is a monumental step in its journey toward mainstream legitimacy. It forces the public and policymakers to take it seriously. This political theater creates an environment where assets perceived as being aligned with pro-growth, pro-innovation, and pro-freedom ideologies can thrive. The emergence of a "BTC Bull Token" or similar concepts tied to this political momentum underscores the new reality: Bitcoin is no longer just a tech story; it is a powerful political and cultural movement, and this new dimension is likely to attract a wave of capital from those who align with its burgeoning ideology.
The Institutional Stamp of Approval: A Corporate Treasury Revolution
While retail excitement and political drama provide the fuel, the institutional adoption of Bitcoin provides the solid, unshakeable foundation for its long-term trajectory. The most powerful recent example of this trend is the announcement from Genius Group, a publicly traded education technology company, that it is increasing its Bitcoin treasury target to a staggering 10,000 BTC. This is not a speculative trade; it is a profound strategic shift in corporate treasury management.
This decision signifies that corporate boards and CFOs are beginning to understand and act upon Bitcoin's value proposition as a superior treasury reserve asset. In an era of persistent inflation and low-to-negative real yields on traditional assets like government bonds, holding large amounts of cash on a balance sheet is a guaranteed way to lose purchasing power. By allocating a portion of its treasury to Bitcoin, Genius Group is taking a proactive step to protect its shareholders' value from the ravages of monetary debasement. It is a declaration of confidence in Bitcoin's long-term potential as a reliable store of value.
The importance of such a move cannot be overstated. It provides a powerful stamp of approval and a case study for thousands of other corporations around the world. When one publicly traded company makes such a bold move and outlines its rationale, it normalizes the strategy. Other CFOs, who may have been hesitant, now have a blueprint to follow and a precedent to point to when presenting the idea to their own boards. This has the potential to unlock a veritable floodgate of corporate capital. Even a small, single-digit percentage allocation from the treasuries of the S&P 500 companies would represent hundreds of billions of dollars of new, sustained buying pressure for Bitcoin. The move by Genius Group is not an isolated event; it is the leading edge of a seismic shift in how the corporate world perceives and utilizes money.
Conclusion: The Dawn of a New Epoch
Bitcoin stands at a historic inflection point. The current period of quiet consolidation is deceptive; beneath the surface, a powerful confluence of forces is converging to launch the asset into its next major chapter. The market's internal structure has never been healthier, with the holdings of early whales being patiently absorbed by a new and committed class of buyers, building a formidable price floor far above previous highs. The technical charts are screaming of an imminent and powerful breakout, with the tightening Bollinger Bands signaling a massive release of energy that heavily favors the upside.
Layered on top of this potent technical and structural setup is a perfect storm of external catalysts. The specter of global economic instability driven by tariffs, the focused attention of a "Crypto Week," the unparalleled influence of figures like Elon Musk, and the shocking but legitimizing entry of Bitcoin into the partisan political arena are all acting as powerful tailwinds. This is all underpinned by the quiet but revolutionary trend of institutional and corporate adoption, which promises to bring waves of new capital into the asset for years to come.
The consolidation will soon end. The question is not about direction, but about magnitude. The forces at play are no longer just about market cycles; they are about a fundamental repricing of a global, non-sovereign asset in a world grappling with economic and political uncertainty. The stage is set for a breakout that could not only shatter previous all-time highs but could also permanently elevate Bitcoin's status, solidifying its role as a cornerstone of the 21st-century financial and political landscape.

BTC 2HOURS BEARISH ANALYSISThe chart appears to be analyzing the short-term price movement of bitcoin against the US Dollar. the use of teccjnical indicators and annotations suggests that the trader is attempting to identify potential trading opportunities based on chart patterns and trends.

BITCOINBTC is showing strong bearish momentum. Price has broken below key support and is forming lower highs and lower lows, indicating continuation of the downtrend.
Until we see a clear reversal pattern or reclaim of resistance levels, I expect further downside.
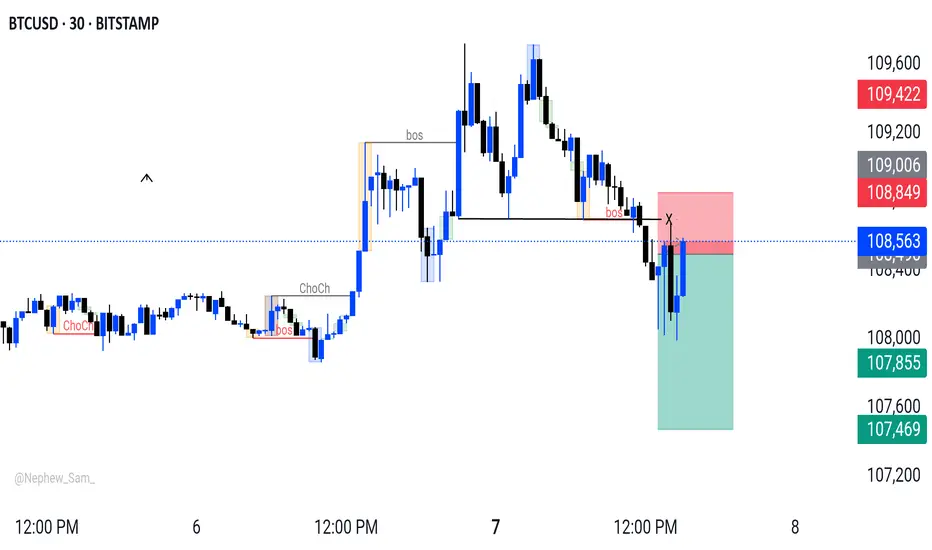
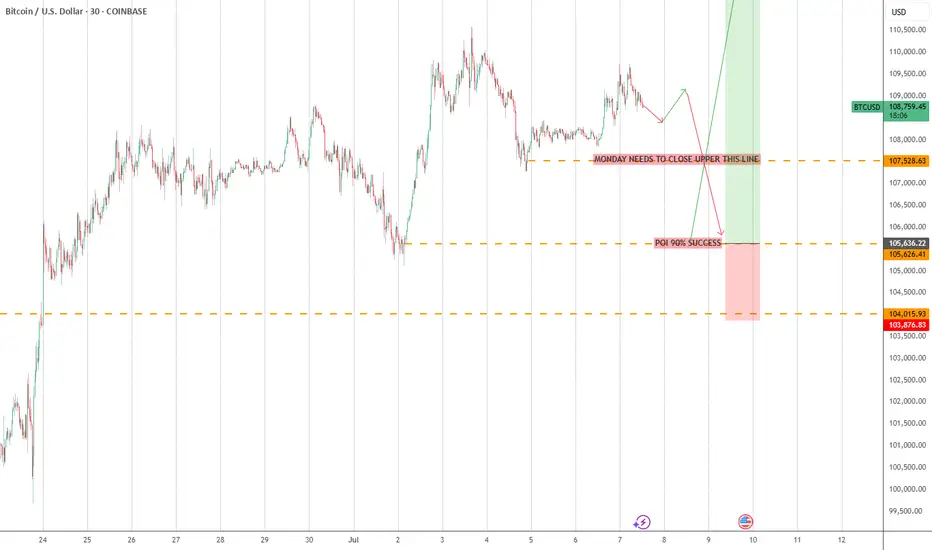
BTCUSD M30 Bearish Outlook #BTCUSD M30 Outlook 🕒
BTCUSD looking bearish below 108,490 zone.
🎯 Target: 107,470
Bias: Lower highs & weakness on M30.
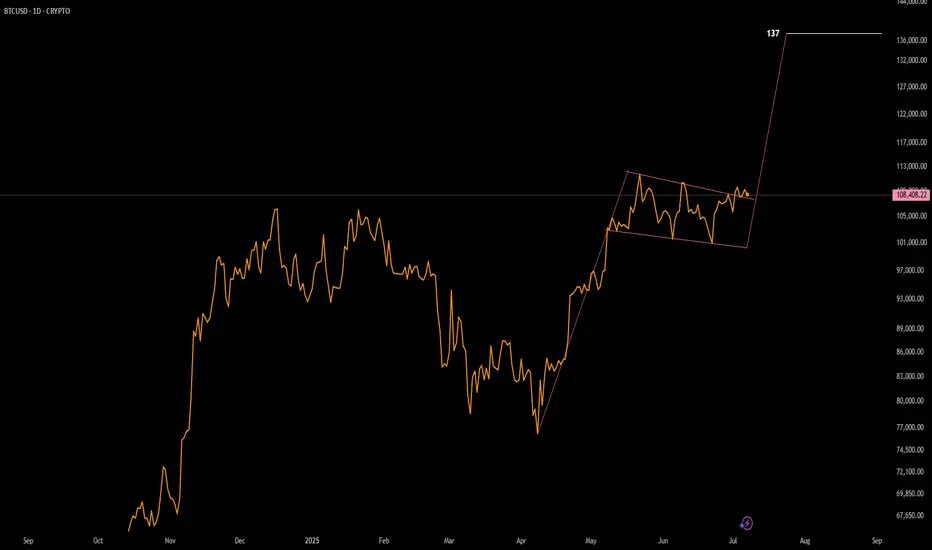
Bull Flag TargetBased on the flag pole height BTC has a current target of 137. This is be so much fun!
7.7 Analysis of the latest BTC trend and operation layout📊 Cautious wait-and-see strategy (Recommendation index ⭐️⭐️⭐️⭐️⭐️)
📰 News information:
1. Digital Market Asset Transparency Act
2. Anti-CBDC Regulation Act
3. US Stablecoin Innovation Act
📈 Technical Analysis:
At present, the price of BTC is around 109,000, and the overall narrow fluctuation pattern continues. The market as a whole lacks clear direction. However, it is worth noting that the trading volume has dropped to 30.1 billion US dollars, which has further shrunk compared with the previous day, reflecting a decline in market participation.
In my opinion, the driving factors of the market include the following:
1. The continued activity of ancient whales has attracted attention
2. The technical side shows that the momentum is weakening
3. Market sentiment has turned neutral
4. ETF fund inflows remain strong
5. The "Crypto Week" policy catalyst is coming
Currently, BTC continues to consolidate within the upward trend line, but the momentum indicator shows fatigue, the 4H Bollinger Bands shrink, and the price is running near the middle track of 108,400. Enter the market cautiously during the day and pay attention to the support of 107,000
🎯 Trading Points:
SELL 109,000-110,000
TP 107,500-107,000
In addition to investment, life also includes poetry, distant places, and Allen. Facing the market is actually facing yourself, correcting your shortcomings, facing your mistakes, and being strict with yourself. I share free trading strategies and analysis ideas every day for reference by bros. I hope my analysis can help you.
BITSTAMP:BTCUSD
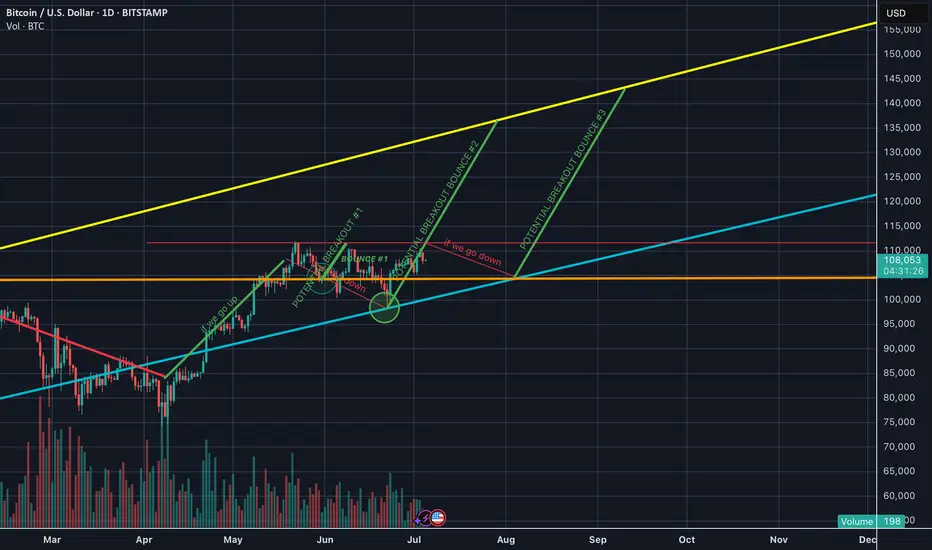
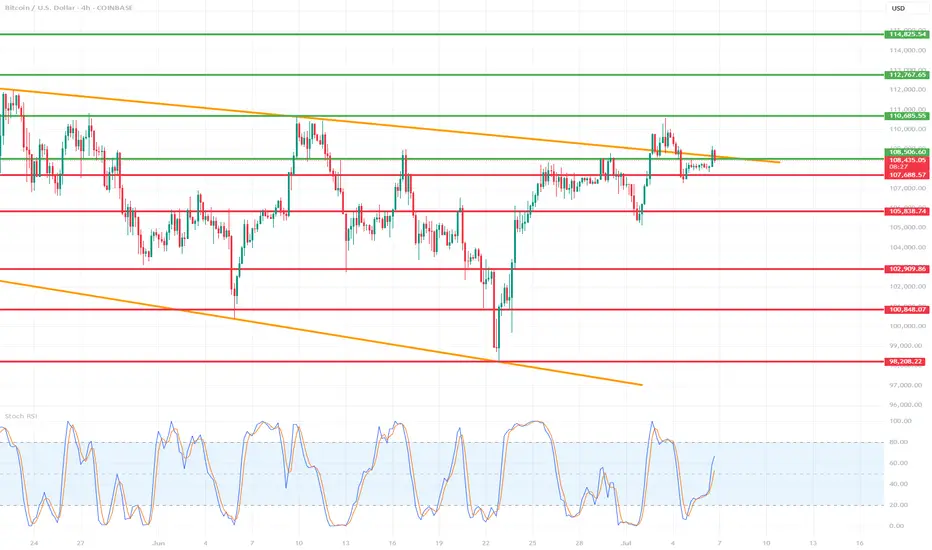
Are we breaking this resistance ? or not yet? BTC is currently trading around $108,000, sitting at a key trendline support zone. The market is at a critical decision point, with two main scenarios: a bullish breakout or a rejection and move lower.
🔍 Technical Structure Overview
Chart timeframe: 1D (Daily)
Major support: $104,000 (horizontal) & ascending trendline (cyan)
Major resistance: $110,000–$112,000 zone
Long-term resistance channel: Yellow trendline capping BTC near $140,000
Volume: Currently low — needs a spike to confirm any breakout
🟢 Bullish Scenario
BTC bounces off the ascending trendline (current zone)
A strong breakout above $112,000 with volume would confirm a Potential Breakout Bounce #2
Targets:
$120,000 (short-term)
$130,000–$140,000 (upper yellow trendline in long-term channel)
✅ Confirmation needed:
Daily candle close above $112K with high volume
RSI rising above 50, MACD bullish crossover would help confirm move
🔴 Bearish Scenario
BTC fails to hold the trendline and breaks below $104,000
This confirms a rejection and a likely move toward $96,000
If momentum weakens, this could turn into a deeper correction or sideways consolidation
BTC is in a tight consolidation range, nearing a major decision point. A breakout above resistance could send prices to new local highs, while failure to hold trendline support will likely trigger a correction. Watch key levels carefully and let volume + momentum indicators confirm your trade.
btcusd🚀 What's Next for #Bitcoin? Time’s Ticking...
Frankly, time is running out for Bitcoin to give us that final explosive leg we’ve been waiting for—the one that could take us to $145K before a correction in September, and ultimately reach $165K in early November, driven by pure FOMO.
But right now, what truly matters is the chart, and the chart is speaking loud and clear:
👉 If today's daily close holds above $107,500, and we see a dip to the $105,600 zone tomorrow or Wednesday, that could be the perfect setup to fuel the fire for an epic rally. We're talking about a run toward $112,000 and a breakout to new ATHs.
📈 Let’s be clear: If Bitcoin doesn’t close below $107,500 today, we could skip the dip entirely and go straight up. The bullish trend would remain fully intact, and I’ll be there—waiting for daddy Bitcoin to make its move.
Stay ready. This could get wild. 🧨
HEAD AND SHOULDERThe bearish head and shoulders pattern in crypto is a classic technical analysis signal that suggests a potential trend reversal from bullish to bearish. Here's how it works:
Structure of the Pattern.
Left Shoulder: Price rises, then dips.
Head: Price rises higher than the left shoulder, then dips again.
Right Shoulder: Price rises again, but not as high as the head, then dips.
Neckline: A support level connecting the lows after the left shoulder and head. When price breaks below this line, it confirms the bearish signal.
The bullish head and shoulders pattern—more accurately called the inverse head and shoulders—is a powerful signal that a downtrend may be reversing into an uptrend. It’s the mirror image of the bearish version and is closely watched by crypto traders for potential buying opportunities.
Structure of the Inverse Pattern
Left Shoulder: Price dips, then rises slightly.
Head: Price dips lower than the left shoulder, then rebounds.
Right Shoulder: Price dips again, but not as low as the head, then rises.
Neckline: A resistance level connecting the highs after the left shoulder and head. A breakout above this line confirms the bullish reversal.

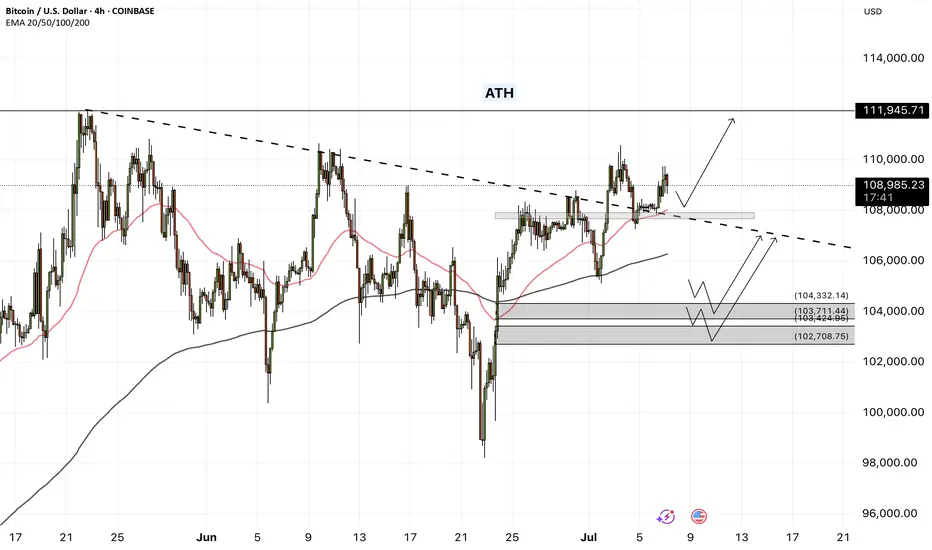
Bitcoin - Will Bitcoin record a new ATH?!Bitcoin is above the EMA50 and EMA200 on the four-hour timeframe and is in its medium-term ascending channel. Maintaining the specified support area will lead to the continuation of Bitcoin’s upward path and recording a new ATH. If it is corrected, we can look for Bitcoin buying positions from the specified demand zones.
It should be noted that there is a possibility of heavy fluctuations and shadows due to the movement of whales in the market and compliance with capital management in the cryptocurrency market will be more important. If the downward trend continues, we can buy within the demand area.
In recent days, Bitcoin has been stabilizing in a price range of around $107,000, with the market simultaneously witnessing a combination of short-term volatility and massive accumulation by institutional investors. A close examination of Bitcoin’s fundamental parameters shows that the market has entered a different phase than in the past; one that is no longer driven solely by momentary excitement, and that structured capital flows and on-chain data have formed its main axis. At the forefront of this trend are Bitcoin spot investment funds (Bitcoin ETFs), which reached their highest level of capital inflows in June. Total net inflows of these funds reached more than $4.5 billion last month, and on some days even approached more than $1 billion. Funds such as BlackRock’s IBIT and Fidelity’s FBTC now have billions of dollars in assets under management, a clear sign of increasing institutional participation in the Bitcoin market. These institutional investors are accumulating Bitcoin not with a short-term view, but with a long-term view and through legal means, which has reduced selling pressure and increased market stability.
On the other hand, the data from Anchin clearly shows that the market is in a steady accumulation trend. The amount of old Bitcoins held for more than 8 years experienced a significant growth of 5% in the second quarter of 2025. This statistic shows that long-term investors are not only reluctant to sell, but are still accumulating their assets. Also, the MVRV ratio, which indicates the relative profit or loss of the market, has decreased from 2.29 to 2.20, indicating mild and controlled profit taking by some investors, rather than widespread selling pressure or general panic. This rational behavior is a sign of market maturity and investors’ intelligence in managing short-term profits.
On-chain activity data also shows a similar trend. The average daily active addresses have reached around 1.02 million, indicating a decrease in market inflammation while maintaining overall dynamism. Other indicators such as Liveliness and Whale Accumulation also confirm that the amount of old transaction traffic has decreased and whales are mainly accumulating, not supplying. This trend is very valuable, especially in a market that has been far from explosive growth. From a macro perspective, the Bitcoin market is clearly in a consolidation and accumulation phase, but this consolidation is based on much stronger foundations than in previous periods. Institutional capital inflows via ETFs have reached over $50 billion, providing a strong foundation for continued growth. Also, some very old wallets that have been inactive for nearly 14 years have recently woken up and moved around $2 billion worth of Bitcoin. Although this could be a sign of potential supply, the market has not yet seen a significant negative reaction to it in the current market conditions and the market remains cautious.
Analysts believe that Bitcoin is in the third phase of its bullish cycle after the halving, which could bring gains of more than 120%. Some forecasts suggest a price range of $200,000-250,000 by the end of this year; however, the realization of such levels is subject to stable macroeconomic data, ETF performance and the absence of severe geopolitical shocks.
Finally, it can be said that the Bitcoin market has now reached a maturity where even periods of consolidation tend to strengthen its fundamentals rather than weaken the market. High-powered institutional investors are entering, whales continue to accumulate instead of selling, and long-term investors also see a bright outlook for the coming months. In this phase, price levels of $125,000 to $140,000 are likely by the end of the summer if the current trend continues, while in the event of severe economic or political pressures, key support for Bitcoin will be in the $95,000 to $100,000 range. Overall, Bitcoin is moving slowly but steadily towards higher targets, with stronger support than at any time in its history.
Bitcoin H4 | Rising into a swing-high resistanceBitcoin (BTC/USD) is rising towards a swing-high resistance and could potentially reverse off this level to drop lower.
Sell entry is at 111,747.48 which is a swing-high resistance that aligns with a confluence of Fibonacci levels i.e. the 78.6% projection and the 127.2% extension.
Stop loss is at 113,000.00 which is a level that sits above a confluence of Fibonacci levels i.e. the 100% projection and the 161.8% extension.
Take profit is at 108,698.22 which is an overlap support.
High Risk Investment Warning
Trading Forex/CFDs on margin carries a high level of risk and may not be suitable for all investors. Leverage can work against you.
Stratos Markets Limited (tradu.com ):
CFDs are complex instruments and come with a high risk of losing money rapidly due to leverage. 63% of retail investor accounts lose money when trading CFDs with this provider. You should consider whether you understand how CFDs work and whether you can afford to take the high risk of losing your money.
Stratos Europe Ltd (tradu.com ):
CFDs are complex instruments and come with a high risk of losing money rapidly due to leverage. 63% of retail investor accounts lose money when trading CFDs with this provider. You should consider whether you understand how CFDs work and whether you can afford to take the high risk of losing your money.
Stratos Global LLC (tradu.com ):
Losses can exceed deposits.
Please be advised that the information presented on TradingView is provided to Tradu (‘Company’, ‘we’) by a third-party provider (‘TFA Global Pte Ltd’). Please be reminded that you are solely responsible for the trading decisions on your account. There is a very high degree of risk involved in trading. Any information and/or content is intended entirely for research, educational and informational purposes only and does not constitute investment or consultation advice or investment strategy. The information is not tailored to the investment needs of any specific person and therefore does not involve a consideration of any of the investment objectives, financial situation or needs of any viewer that may receive it. Kindly also note that past performance is not a reliable indicator of future results. Actual results may differ materially from those anticipated in forward-looking or past performance statements. We assume no liability as to the accuracy or completeness of any of the information and/or content provided herein and the Company cannot be held responsible for any omission, mistake nor for any loss or damage including without limitation to any loss of profit which may arise from reliance on any information supplied by TFA Global Pte Ltd.
The speaker(s) is neither an employee, agent nor representative of Tradu and is therefore acting independently. The opinions given are their own, constitute general market commentary, and do not constitute the opinion or advice of Tradu or any form of personal or investment advice. Tradu neither endorses nor guarantees offerings of third-party speakers, nor is Tradu responsible for the content, veracity or opinions of third-party speakers, presenters or participants.

looking for shorts on bitcoin My point of interset for going short on bitcoin is taking that buyside out and waiting for something on the 1hr timeframe for my entry, for now i am on the side lines and not going to trade in the middle of the range. I do belive that at these levels bitcoin is do for a huge correction. We can even revisit that weekly fvg.

HelenP. I Bitcoin may correct to support level and continue growHi folks today I'm prepared for you Bitcoin analytics. If we look at the chart, the price has formed a clean upward channel after bouncing from the strong support zone at 103500 - 103000 points. This movement marked the beginning of a new bullish phase. Price continued to rise step by step, confirming the structure with higher highs and higher lows. After reaching above 110000 points, it made a minor pullback but still trades above Support 1 - 108800 points. This zone, 108800 - 108200 points, aligns well with the midline of the channel and may serve as a strong area for buyers to re-enter. The price is currently trading around 110382 points and is still respecting the channel structure. As long as BTCUSD stays above the support zone and inside the ascending channel, I expect a potential continuation toward the upper boundary. My current goal is 114000 points - near the resistance line of this bullish channel. Given the strong trendline support, clean reaction at each correction, and buyer activity on lows, I remain bullish and anticipate further growth. If you like my analytics you may support me with your like/comment ❤️
Disclaimer: As part of ThinkMarkets’ Influencer Program, I am sponsored to share and publish their charts in my analysis.
Bitcoin [BTC1!] Draw and Bias. 05.07.25, SaturdayLooking for bullish action on BTC. No stance on alts.

Is BTC getting ready for a new ATH?🔍 1. Key Support and Resistance Levels (Horizontal Lines):
🟢 Resistances (Green Lines):
114,295.54 — strong resistance resulting from previous highs.
112,767.65
111,009.00
110,685.35 — current key level that price may try to retest after a potential breakout.
🔴 Supports (Red Lines):
108,496.55 — current level being tested, also coinciding with local resistance from the past.
107,687.57
105,888.74
102,909.85
100,848.07
98,208.22 — strong long-term support; in the past, this level was reacted with a strong bounce.
🔶 2. Downtrend channel marked with orange lines:
The upper downtrend line acted as resistance.
The lower uptrend line acted as support.
The price recently broke above the upper line, but is now testing it again - this could be a retrospective retest.
➡️ If the close of the H4 candle is above this line - a possible confirmation of the breakout.
📊 3. Stochastic RSI indicator (at the bottom of the chart):
Currently in the uptrend phase after a bounce from the oversold level (<20).
The %K line (blue) is crossed upwards by the %D line (orange) - a bullish signal.
Still below the overbought zone, which suggests that the potential uptrend still has room to develop.
🧠 4. Market structure and price action:
Price broke above the 108.496 level, but is currently struggling to stay above this zone.
A retest of the broken triangle could be a healthy move, provided that support is maintained in the 108k–107.6k area.
A break below and a close below 107.6k could mean a false breakout and a possible decline towards 105.8k or even 102.9k.
🧭 5. Possible scenarios:
✅ Bullish scenario:
Maintaining the 108.496 level and closing the candle above the upper orange line → continued growth.
The nearest targets are:
110.685 (first resistance),
111.009 and 112.767 next.
❌ Bearish scenario:
The price will not stay above 108k and will fall below 107.687.
Possible return to the previous consolidation range with the target:
105.888,
and then 102.909 or 100.848.
🧮 Summary:
Currently, the decisive moment is underway: a test of support after breaking out of the convergent triangle.
The Stoch RSI indicator gives a bullish signal, but the price must confirm the movement by behaving above 108k.
Retest and bounce - this is a bullish scenario.
A breakdown and return under the trend line - means that the breakout was false.
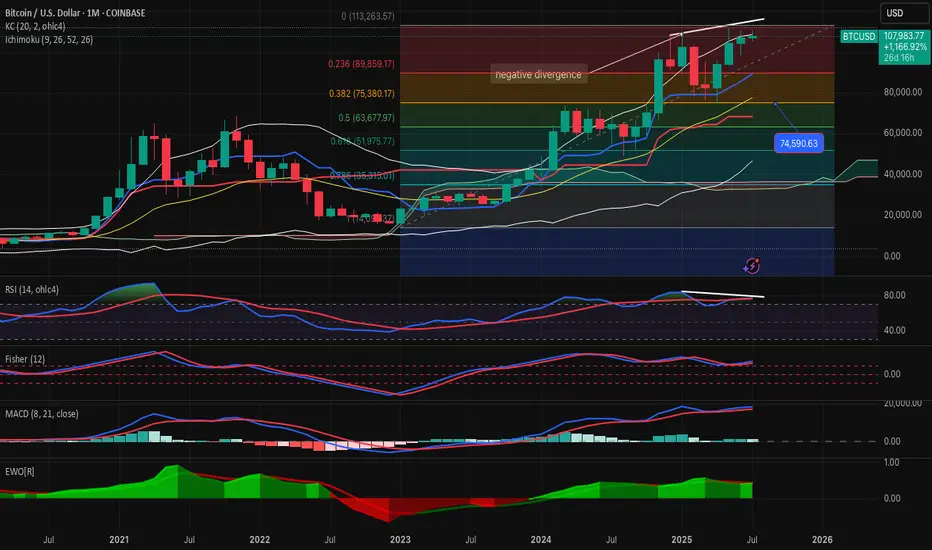
BTCUSD-SELL strategy. Monthly chart It looks a clear negative divergence case, and we are quite overbought. This requires again to alleviate the pressure and I feel $ 74k re-test is possible medium-term.
Short-term anything goes they say, and it feels it will try higher short term. just be careful for the longer-term situation.
Strategy SELL @ $ 108k-115k and take profit first @ $ 77k area.