BTCUSDTDo you think Bitcoin is long or short? I think we are shorting it to the 104,500 range and I am in a short position myself🎯🎯
BTCUSD.PM trade ideas
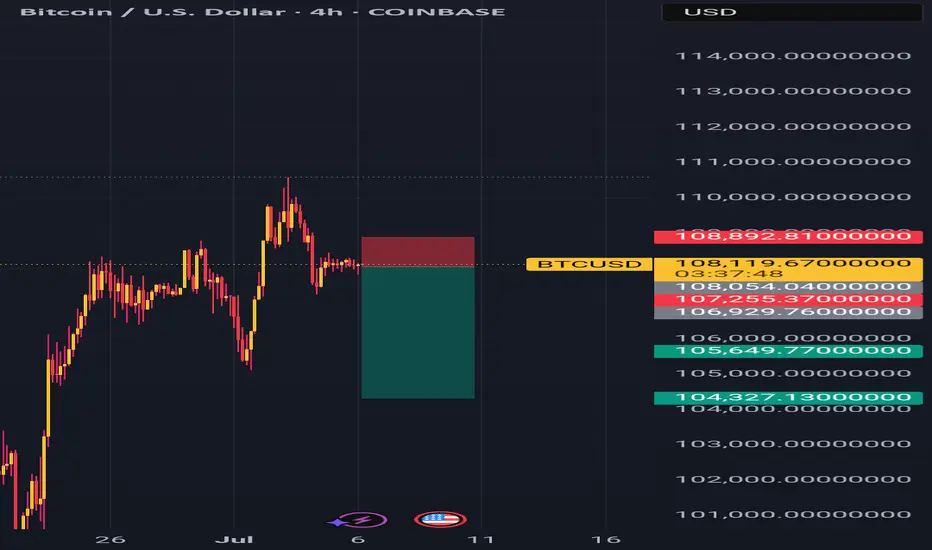
Bitcoin May See Short-Term Pullback After Hitting $108,000📊 Market Overview:
Bitcoin surged to $108,000 amid renewed risk-on sentiment, a softer US dollar, and slightly declining bond yields. However, weekend trading sees lower liquidity, and some profit-taking has emerged. Traders are also cautious ahead of next week’s Fed-related news.
📉 Technical Analysis:
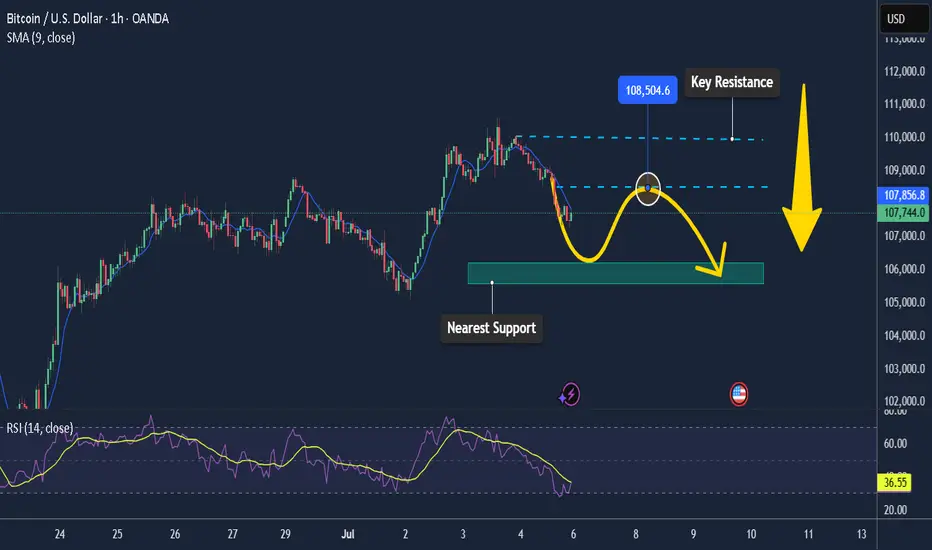
• Key Resistance: $108,500 – $110,000
• Nearest Support: $106,200 – $105,500
• EMA 09 (1H): Price is above EMA 09, indicating bullish momentum remains.
• Candlesticks & Volume: Doji candle and falling volume in 1H → suggests weakening upside momentum and possible retracement.
📌 Outlook:
Bitcoin may face a short-term pullback if it fails to break above $108,500 and no fresh catalysts emerge. Holding above $106,200 would keep the broader bullish structure intact.
💡 Suggested Trade Setup:
🔻 SELL BTC/USD at: 108,200 – 108,500
🎯 TP: 106,800
❌ SL: 109,300
🔺 BUY BTC/USD at: 106,200 – 105,500
🎯 TP: 107,800
❌ SL: 104,800
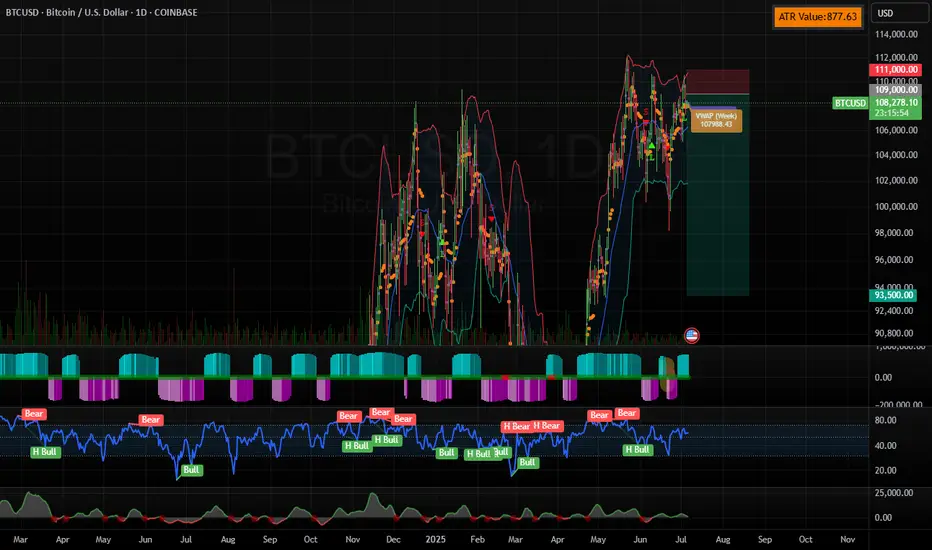
BTC ShortResistance at 111k has proven to be challenging for BTC, and I believe that it needs to retrace to regain momentum to go meaningfully higher.
On the hourly chart, price has been squeezing for the longest since June which resulted in a drop of more than 10%. The squeeze and RSI divergence pattern between the two periods is very similar. BTC enjoyed the tailwind of the USD falling significantly since the beginning of the year, but I believe it will start to strengthen again.
TP is the 93-94k range. I will cut losses at 111k. If the trade gains momentum and slices through 93k, then I will continue to trail stops until it reverts. At that time, I will most likely go long for the next major upside push.
Risks:
There are three major pieces of crypto legislation that could cause unpredictable swings.
Also, it's crypto, so anything can and routinely does happen :P
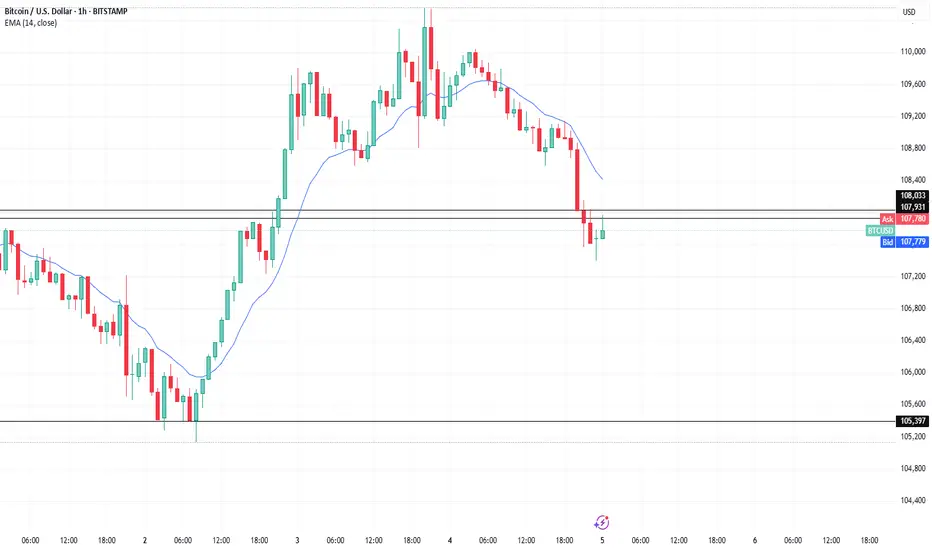
BTC/USD – Executed Short on Bearish Retest of Resistance PricePrice: 107,950
Position: SHORT
Strategy: Retest Sell into Bearish Continuation
Timeframe: 30m
Status: Trade Active
📊 Analysis Summary:
BTC/USD retested the 107,950–108,100 resistance zone, aligning with the 14 EMA on a clear downtrend. Bearish rejection candles confirmed seller dominance, and I executed a short entry near the top of the retest.
🔽 Plan Ahead:
Towards:105,400
Holding this short unless price breaks back above EMA with bullish strength.
💬 "Sell the bounce. Ride the breakdown. Risk managed, conviction high."
What’s your view? Will BTC hold below 108K or are bulls about to fight back?
#BTCUSD #Bitcoin #CryptoTrading #TechnicalAnalysis #ShortTrade #BearishTrend #EMA #TradingStrategy #SmartMoney #MarketStructure #RiskReward #SwingTrade
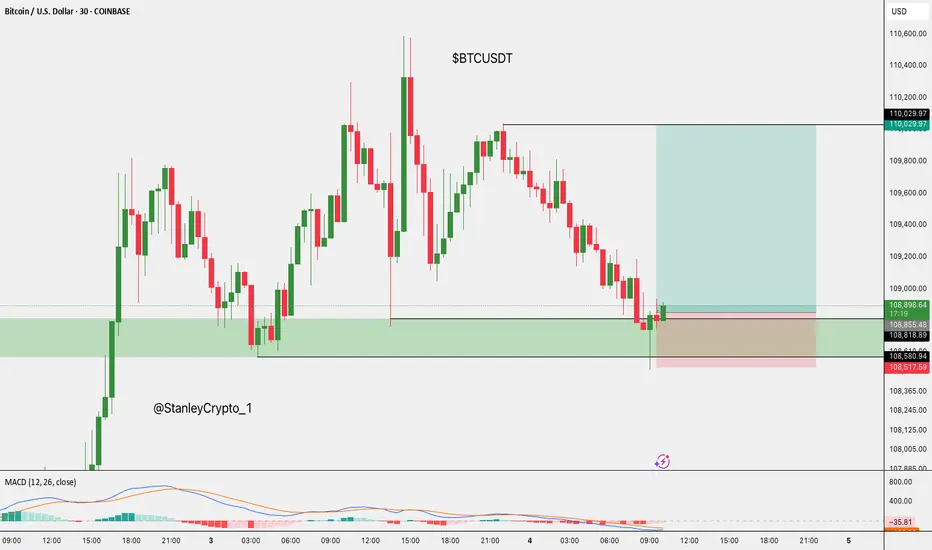
$BTC Long Setup. CRYPTOCAP:BTC Long Setup
Price bounced from the key demand zone.
- Entry: CMP
- SL: $108,517
- TP: $110,030
DYOR, NFA
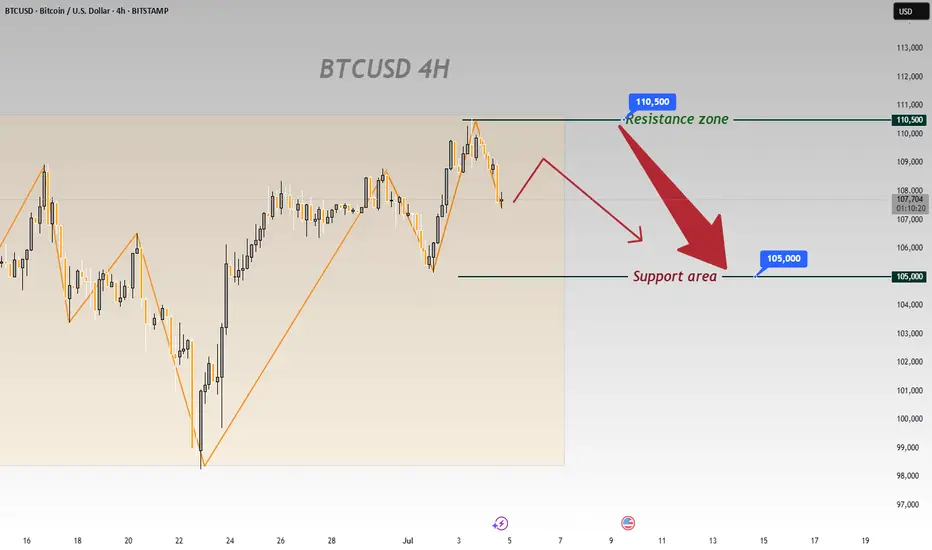
On BTCUSD’s 4 - hour chart, downside risks prevailOn BTCUSD’s 4 - hour chart, downside risks prevail:
Resistance Holds
Price failed to break 110,500, showing strong selling pressure that caps bulls 🚫. A pullback is likely.
Downtrend Signals
Post - resistance, price is retracing. Candlesticks and chart arrows point to a drop toward 105,000 support, fueled by building bearish momentum ⬇️.
Support Test Looms
105,000 is the next key level 🔑. Even if support slows the fall, the setup favors downside—bullish reversals seem unlikely after resistance failure.
Trend Weakness
Orange trendlines show the prior uptrend is fragile 🧊. Failing at 110,500 signals fading bullish force, setting up for a bearish correction.
In short, the 4 - hour chart is bearish. Watch for drops to 105,000; 110,500 will likely block bulls 🛑. Trade cautiously with this bias.
🚀 Sell@108500 - 107500
🚀 TP 106500 - 105500
Accurate signals are updated every day 📈 If you encounter any problems during trading, these signals can serve as your reliable guide 🧭 Feel free to refer to them! I sincerely hope they'll be of great help to you 🌟 👇
Long Setup Loading… (BTC)My key demand zone for potential long setup – confluence of Fibonacci 0.66/0.618 and liquidity grab expected.
This highlighted golden zone will be my key area to look for long entries. It's aligned with the 0.66–0.618 Fibonacci retracement from the previous impulse, and I expect potential liquidity sweep below recent lows before a strong bullish reaction.


BTC wait for Long
Bitcoin continues to struggle with its long-term weekly resistance.
In the short term, it’s likely that BTC will consolidate within the $100,000–$112,000 range.
Positioning heavily into altcoins during this phase may not be ideal. It’s more prudent to wait for either a confirmed breakout above weekly resistance or a pullback toward the $94,000–$92,000 support zone.
For now, the focus remains on short-term trading opportunities within this range. A potential long setup is outlined in the chart.
Disclaimer:
This analysis is based on my personnal views and is not a financial advice. Risk is under your control.

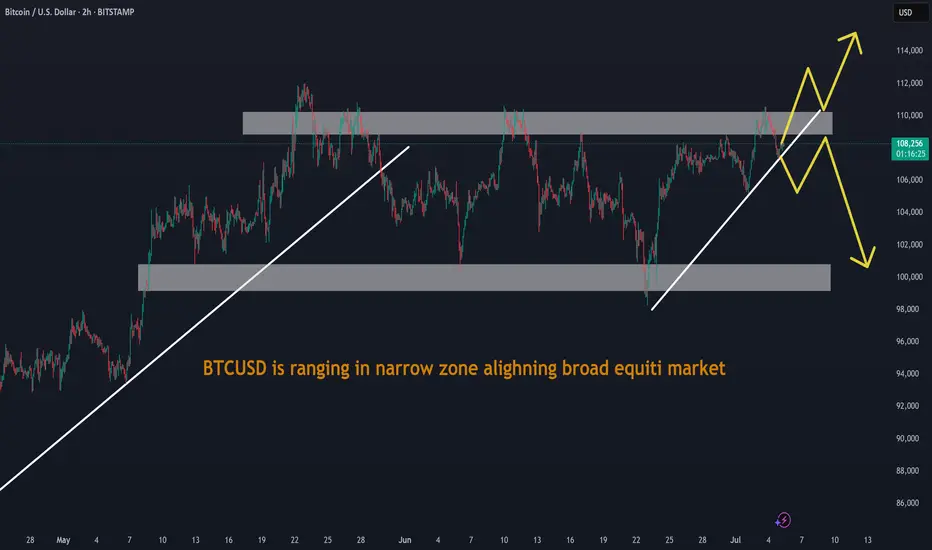
BTCUSD is ranging in narrow zone alighning broad equiti marketBTCUSD is ranging in narrow zone alighning broad equiti market
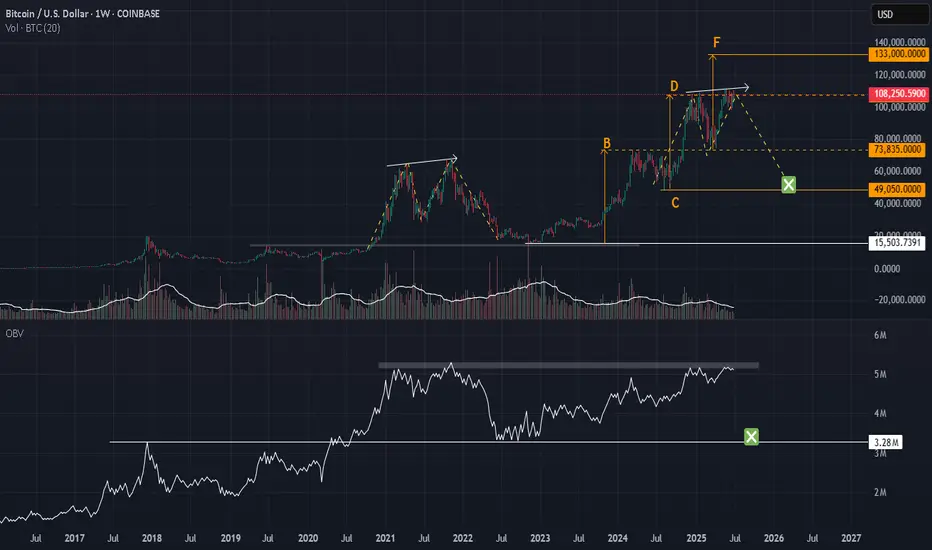
BTC : Looking at the supplyPrice is stalling at the D @ 108,800 for some time now.
I think it is not because of a lack of demand. Just that there is no one selling. Owners prefer to keep the limited supply. Buyers are unwilling to chase after the few available at a higher price. We have a stalemate.
In 2022, to break this stalemate, price needs to drop, with sellers taking a profit and making supplies available. Then we will have buyers scrambling again to BUY.
Watch the OBV.
So, I should wait to BUY, but at the right price.
Good luck.
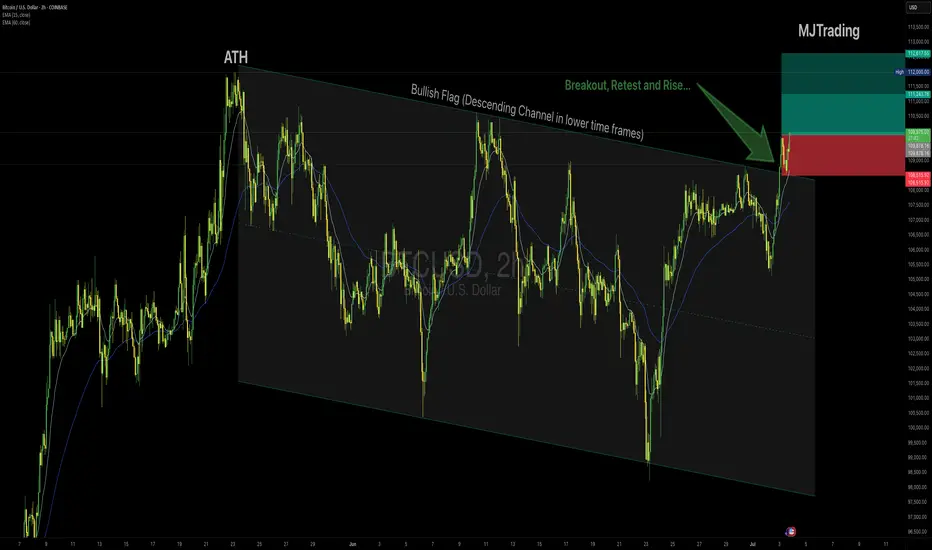
BTCUSD – Long Setup (2H Chart)👆👆🚀🚀Boost it if you like it (Thanks)🚀🚀👆👆
Idea:
Bitcoin is breaking out above the descending Flag after testing the upper boundary multiple times, showing bullish momentum confirmed by price holding above the 15 EMA and 50 EMA. The breakout aligns with strong impulse candles and sustained buying pressure.
Entry:
✅ Buy near $110,000
Stop Loss:
🔴 Below $108,500, under the breakout structure to protect against a false breakout.
Take Profit:
🟢 Tp1 $111,245
🟢 Tp2 $112,600
Rationale:
Clear breakout of the channel top resistance.
Bullish EMAs crossover with sustained slope.
Strong impulse move suggesting continuation.
Risk Management:
Position size accordingly, max risk 1–2% capital per trade.
#Bitcoin #BTCUSD #CryptoTrading #Breakout #LongSignal #TradingView #TechnicalAnalysis
Btc looks quite bearish from the 15 minutes timeframe- sellPrice is currently forming a bearish continuation pattern and this provides us with a sell opportunity from the lower timeframe perspective. A sell opportunity is envisaged

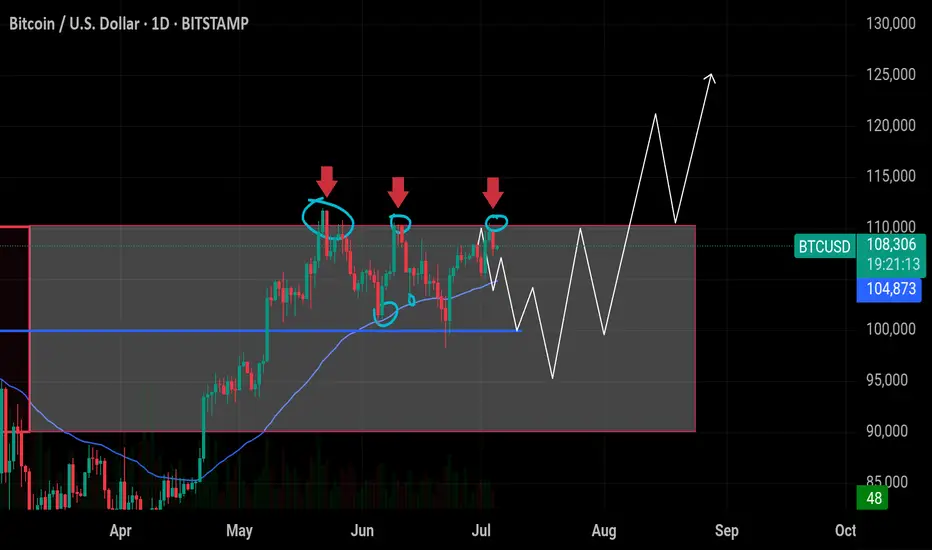
$BTC is stuck in a box – Big move coming soon! Bitcoin has hit CRYPTOCAP:BTC is stuck in a box – Big move coming soon!
Bitcoin has hit $110K resistance three times and failed. It's moving sideways inside a big box. A breakout is coming – either up or down.
🔸 Support at $104.7k–$100k:
50 EMA is around $104.7K, acting as the first support. Strong support is at $100K. If the price drops here, it’s a good place to buy.
🔸 Targets:
If BTC closes above $110K, we can see a quick move to $115K or even $120K.
🔸 Risk Level at $99k:
If price falls below $99K, the bullish setup is no longer valid. In that case, BTC might go down to $95K or even $90K.
🔸 Outlook:
✅ Watch for a close above $110K to enter a breakout trade.
✅ If price drops, look to buy near $100K–$105K.
Wait for confirmation — the next big move is near!
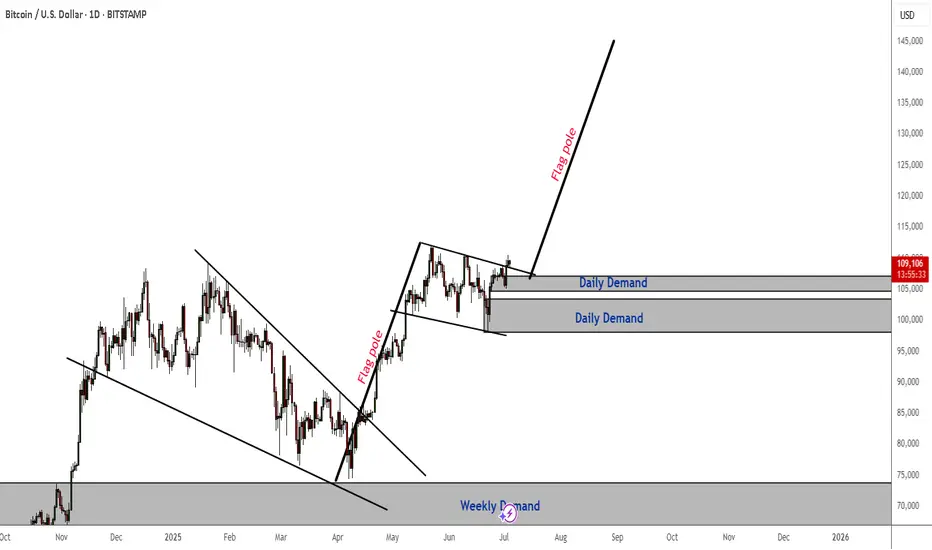
BTCUSD Daily TF Bull FlagThe daily timeframe bullish flag is a strong indication that the market is preparing for another bull run. The target for this will be around $140k - slightly higher.
I am anticipating a minor pullback to either one of the daily demand zones - (most likely the highest one) before the bulls take over.
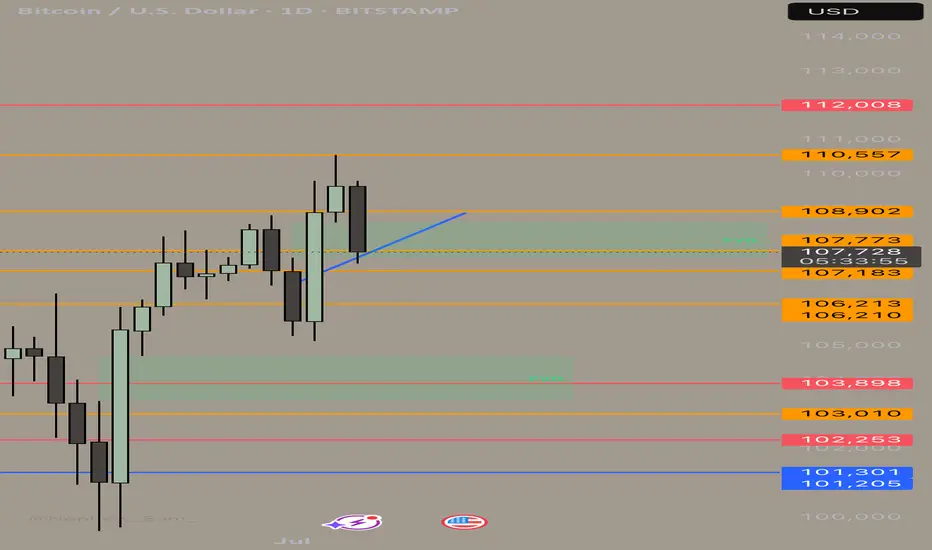
BUY BTCUSD now for a four hour time frame bullish trend continuBUY BTCUSD now for a four hour time frame bullish trend continuation ...............
STOP LOSS: 107,194
This buy trade setup is based on hidden bullish divergence trend continuation trading pattern ...
Always remember, the trend is your friend, so whenever you can get a signal that the trend will continue, then good for you to be part of it
TAKE PROFIT : take profit will be when the trend comes to an end, feel from to send me a direct DM if you have any question about take profit or anything...
Remember to risk only what you are comfortable with... trading with the trend, patient and good risk management is the key to success here

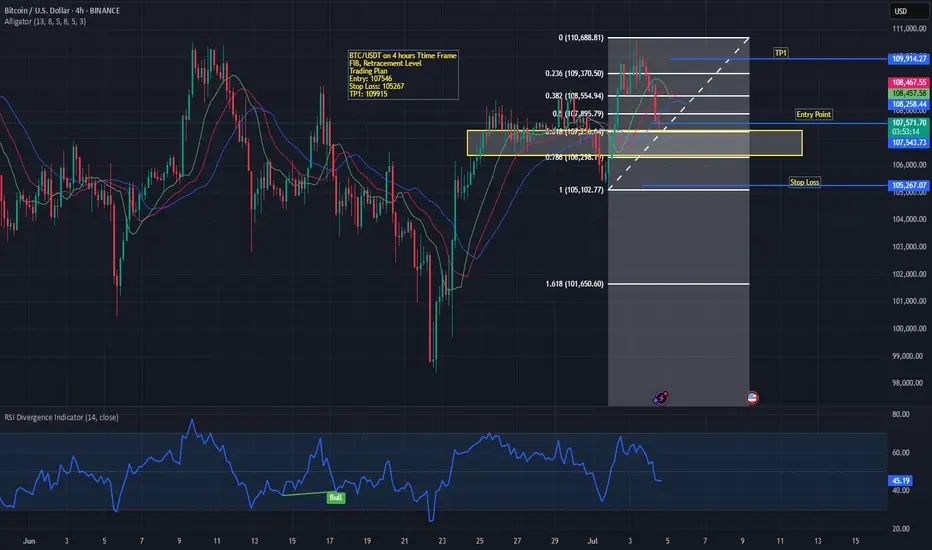
BTC/USDT on FIB Retracement LevelsThe price is currently retracing after a recent upward move and is testing the 38.2% Fibonacci level (≈107,805).
The entry zone is defined around 107,546, marked in yellow, suggesting a possible support area where buyers may step in.
The stop loss is placed slightly below at 105,267, around the 78.6% Fibonacci retracement level, to manage risk if the market breaks this zone.
The take-profit (TP1) target is set near 109,867, close to the previous high and aligning with the 0.236 Fib level (≈109,370).
📉 Indicators & Patterns
EMAs are converging, with price slightly under them, showing possible weakness but not a confirmed downtrend yet.
RSI (Relative Strength Index) at the bottom is around 45, signaling neutral momentum—neither overbought nor oversold.
A bullish divergence was marked earlier on RSI, which supported the previous price rise.
📈 Trading Plan Summary
Entry: 107,546
Stop Loss: 105,267
TP1: 109,867
Bias: Watching for a bullish reversal from the yellow support zone.
If price fails to hold above 106,296, it may head toward 105,102 and the 1.618 Fib extension (101,650).
This setup suggests a high-risk, reward potential if price bounces in the support zone, but caution is advised as RSI and EMAs currently show mixed signals.
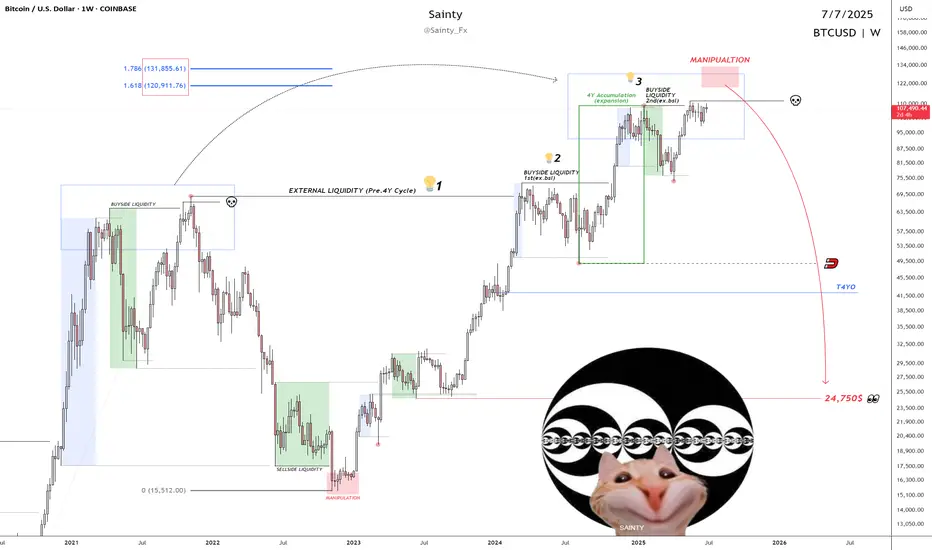
Bitcoin's 4-year bullish cycle is coming to an end.The price reversal and manipulation zone could be between $120K and $133K, indicating a big bearish movement.
Quarterly analysis indicates a target of approximately $24,750.
QT + ICT + SMC
- Sainty
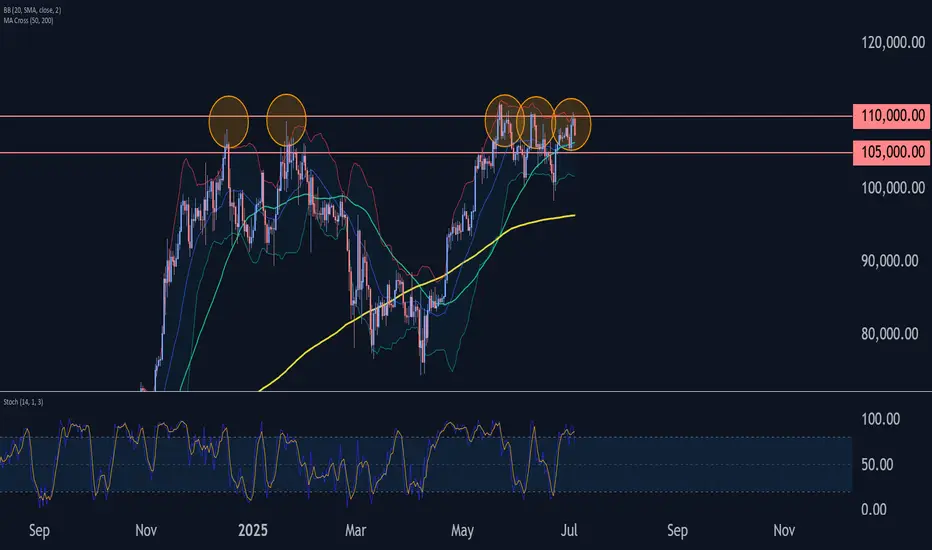
Bitcoin Wave Analysis – 4 July 2025- Bitcoin reversed from long-term resistance level 110000.00
- Likely to fall to support level 105000.00
Bitcoin cryptocurrency recently reversed down from the major long-term resistance level 110000.00 (which has been steadily reversing the price from the start of this year, as can be seen below) – intersecting with the upper daily Bollinger Band.
The downward reversal from the resistance level 110000.00 stopped the previous medium-term impulse wave (3) from the start of June.
Given the strength of the resistance level 110000.00 and the overbought daily Stochastic, Bitcoin cryptocurrency pair can be expected to fall to the next support level 105000.00 (low of the previous correction (2)).
Market ViewWatch
Trade
Manage
SmileWatch
Trade
Manage
SmileWatch
Trade
Manage
SmileWatch
Trade
Manage
SmileWatch
Trade
Manage
Smile

Btc will test 112 next! With some simple technical analysis I wouldn’t be confident calling in bottom but at this time I’m hedging with a short to take small profits and transfer it into spot for more BTC!! There is a FVG on a daily chart and for now on1H we can see certain resistance. RSI is relatively strong heading to neutral making me believe we may call this bottom for now. Smart money (institutional) has eaten BTC supply and just recently 7 dormant wallets are moving money. Something big may be brewing. Be careful out there.
July 3 Bitcoin Bybit chart analysis
Hello
This is Bitcoin Guide.
If you "follow"
You can receive real-time movement paths and comment notifications on major sections.
If my analysis was helpful,
Please click the booster button at the bottom.
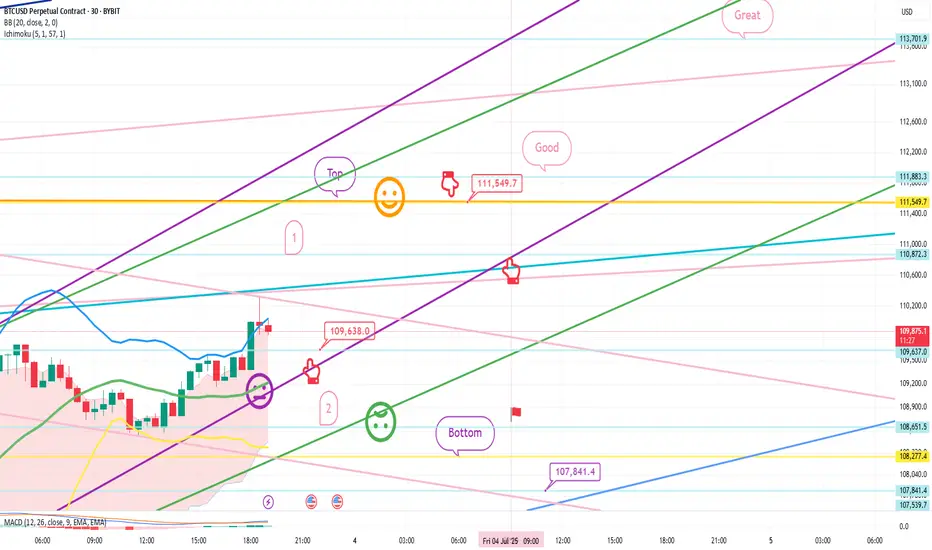
Here is the Bitcoin 30-minute chart.
There will be a Nasdaq index announcement at 9:30 and 11:00 in a little while.
I created today's strategy based on the Nasdaq pattern and Tether dominance vertical decline conditions.
*One-way long position strategy when the red finger moves
1. $109,838 long position entry point / stop loss price when the purple support line is broken
2. $111,549.7 long position 1st target -> Great 2nd target
The 1st section at the top and the 2nd section at the bottom are sideways sections.
Even if the strategy fails, if the green support line is not broken,
it is good for a long position.
Below that
Bottom -> Please note that it is open up to 107,841.4 dollars
Up to this point, I ask that you simply use my analysis for reference and use only
I hope that you operate safely with principle trading and stop loss prices.
Thank you.
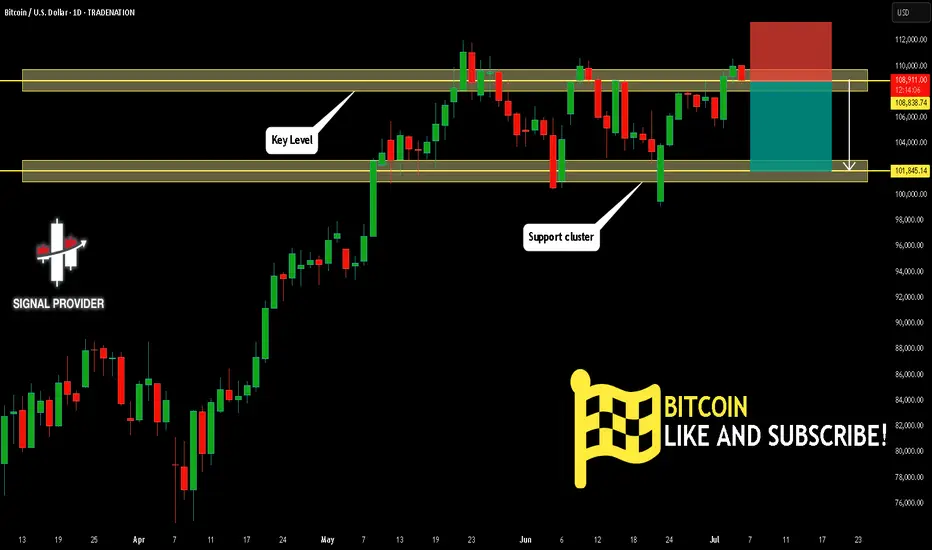
BITCOIN Will Fall! Sell!
Please, check our technical outlook for BITCOIN.
Time Frame: 1D
Current Trend: Bearish
Sentiment: Overbought (based on 7-period RSI)
Forecast: Bearish
The price is testing a key resistance 108,838.74.
Taking into consideration the current market trend & overbought RSI, chances will be high to see a bearish movement to the downside at least to 101,845.14 level.
P.S
The term oversold refers to a condition where an asset has traded lower in price and has the potential for a price bounce.
Overbought refers to market scenarios where the instrument is traded considerably higher than its fair value. Overvaluation is caused by market sentiments when there is positive news.
Disclosure: I am part of Trade Nation's Influencer program and receive a monthly fee for using their TradingView charts in my analysis.
Like and subscribe and comment my ideas if you enjoy them!