BTC Setup: 2.7 R:R"Bitcoin Poised for New Uptrend After Bull Flag Breakout Retest"
Bitcoin appears ready to begin a new uptrend after successfully retesting the breakout from a bull flag pattern and completing consolidation above key support.
This setup offers a 2.7:1 risk-to-reward ratio, with the following trade parameters:
Entry: $109,965.79
Stop Loss: $106,300
Target: $120,000
BTCUSD.PM trade ideas
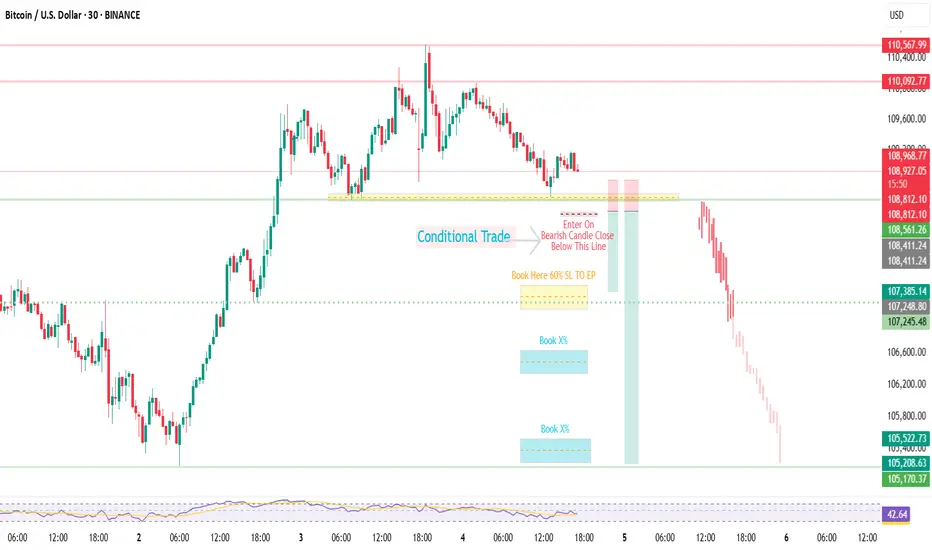
BTCUSDBTCUSD | Quiet Market Play – Conditional | Trade Based On Bearish Candle Closure
After a sharp upward move, price is now losing momentum and consolidating.
Currently entering a short position after breaking the resistance
Trade includes full risk management, marked on chart. 🔴📉
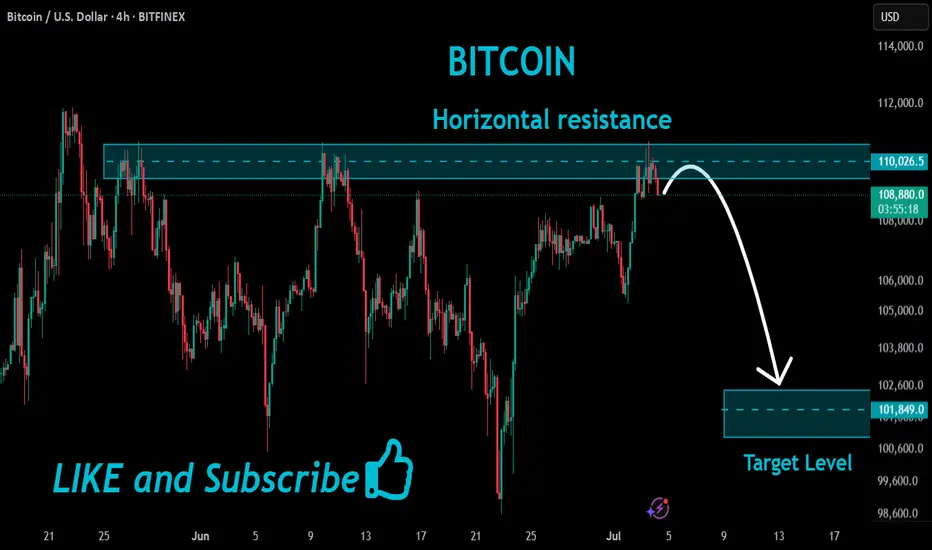
BITCOIN Short From Resistance!
HI,Traders !
#BITCION went up sharply
Made a retest of the
Horizontal resistance level
Of 110026.5 from where we
Are already seeing a local
Bearish reaction so we
Are locally bearish biased
And we will be expecting
A local bearish correction !
Comment and subscribe to help us grow !
BTCUSD Sell Setup (15M) Chart Analysis BTCUSD Sell NOW
Entry: ~ 109,200
Target : ~ 108,600
Target : ~ 108,290
SL : ~ 109,550

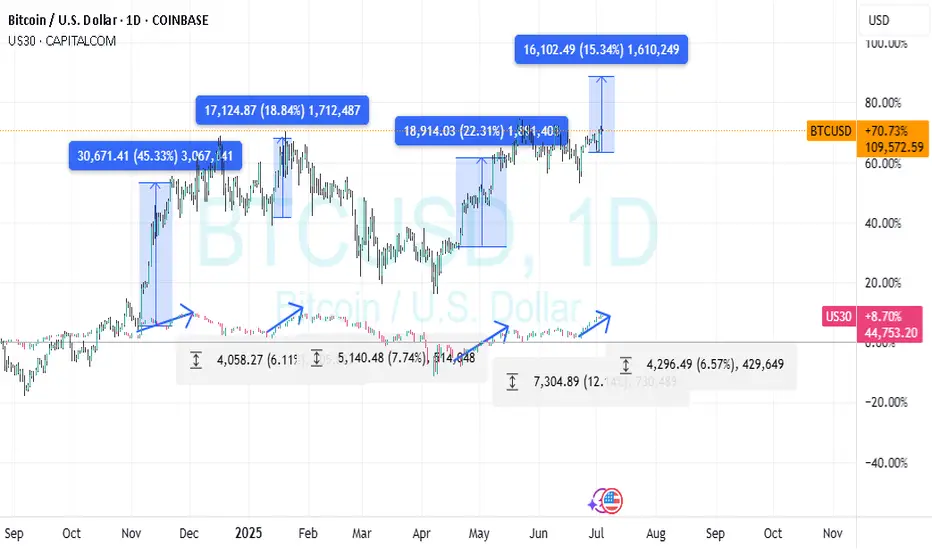
BTC? and
It's alliance..
I have this knowledge will like to share: Use it caveat emptor Okay.
US30 and BTC correlate 1:2 approximately.
If US30 moved 10% BTC will move 20%
I will plot from the bottom till now (example) and get the % for US30
Then will double that % from bottom for BTC
This is no mean a crystal ball, but it gives a sense of confidence.
You will then be on a lookout in BTC for??
Whatever you like / preference on BULLISH SIDE; fav pattern bla bla..
All the best.
Do your own research. I am not guru.
NB/ May you will bless with abundance
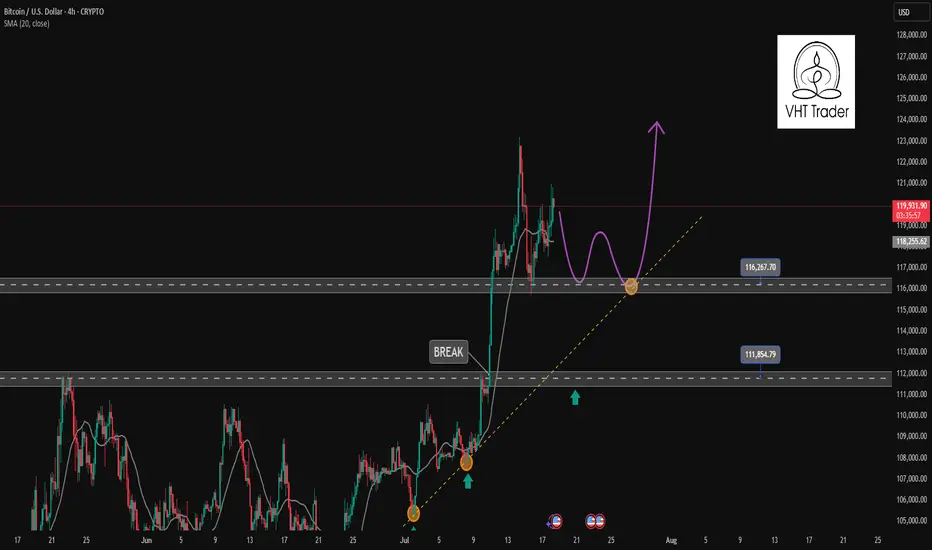
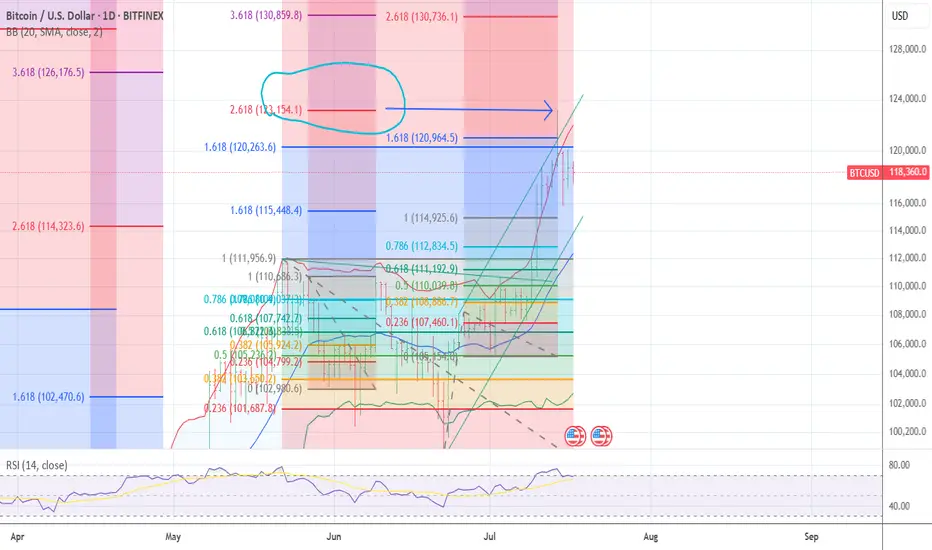
Find a recovery point to continue buying BTC✏️ CRYPTO:BTCUSD is trading near the all-time high. The trading strategy is to wait for some investors to take profit so that the price can return to the nearest support zones and continue to buy to the new all-time high zones.
📉 Key Levels
BUY Trigger: confirms the recovery from the support trend line 116000
BUY zone 112000 (Strong support zone)
Target 129000
Leave your comments on the idea. I am happy to read your views.
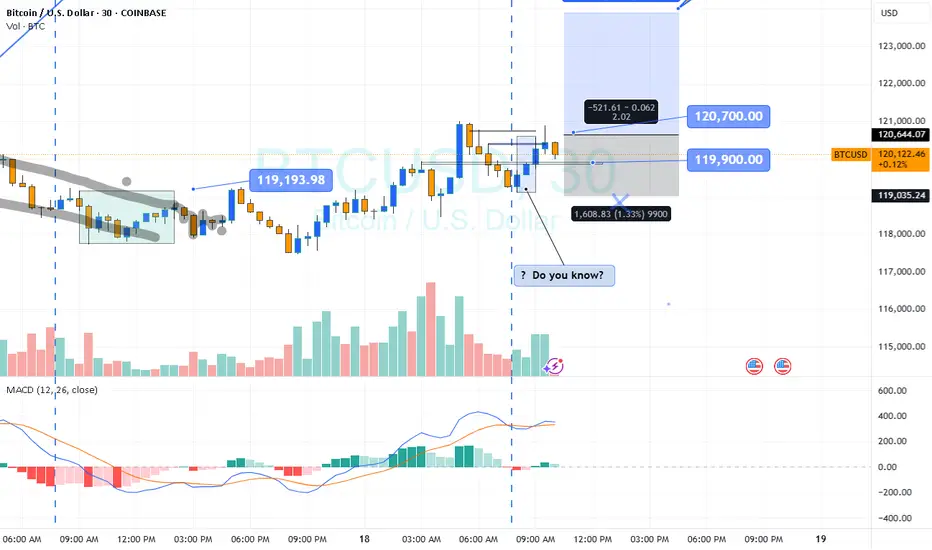
BTC intra?
Hi
Do you know?
www.investopedia.com
If your initial plan is BUY.. whatever reasons: Fundamental/ outlook buy
We'll take this trade; reason
Two Yeses : Outlook BUY Pattern BUY
How will it react?
Answer: I don't know
High probability : Yes
Where do you enter? Your preference
wait retrace or now... just
If you wait.. might not get the ticket
If calculate between entry and stop loss: pips
And divide by what you re risking in $ to pips
All the best
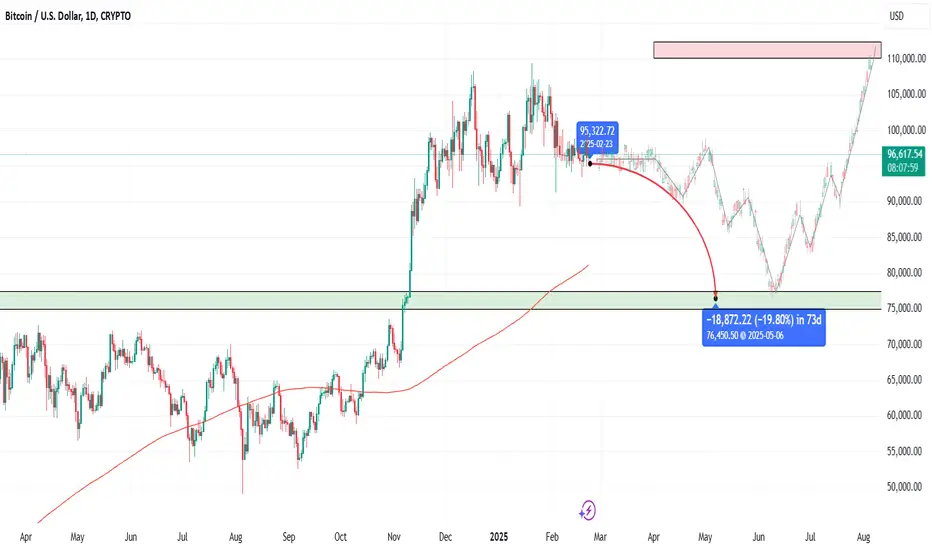
BTC OutlookIn the volatile world of trading, uncertainty is the only constant. Could prices dip to 75k before surging to 115k? Is such a drop a brief pullback or the start of a prolonged downturn? What technical or fundamental signals might indicate a recovery toward 115k?
Disclaimer: This content is for informational purposes only and does not constitute financial advice. Always consult a professional before making any investment decisions.
BTC Longsim looking at crypto longs from here because the market is showing signs of a bullish continuation.
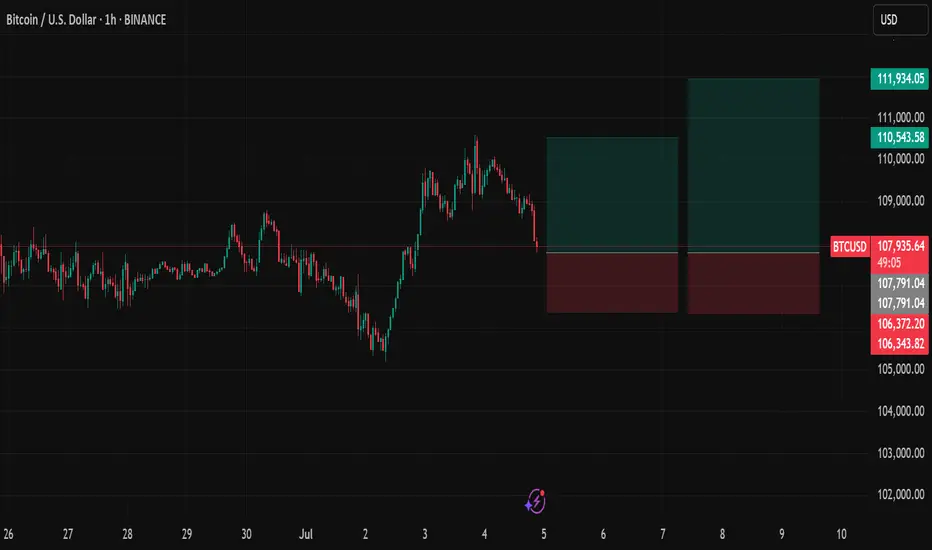
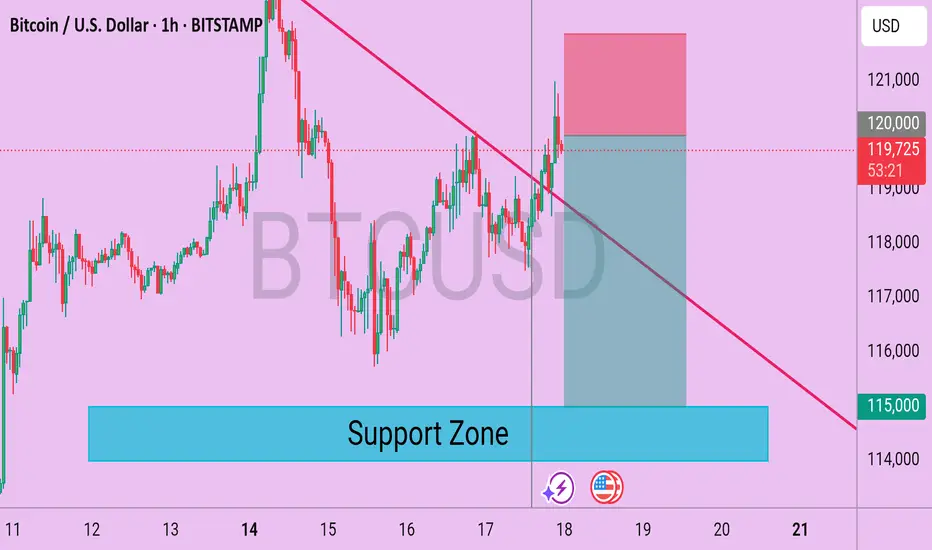
Bitcoin (BTC/USD) 1H Technical Analysis – Breakout in ProgressBitcoin is showing bullish intent after breaking above a descending trendline resistance on the 1-hour chart. The breakout occurred with decent bullish momentum, suggesting buyers are regaining control in the short term.
📈 Chart Observations:
Descending Trendline Broken: Price has successfully broken above a well-respected descending trendline, which acted as resistance over the past few sessions. This breakout may signal a shift in short-term market structure.
Support Zone: The marked support zone around $115,000 continues to act as a critical demand area. Price has rebounded multiple times from this zone, reinforcing its significance.
Current Price Action: BTC is currently trading near $119,800, just under the round-level resistance of $120,000. A clean hourly close above this level could open room for further bullish continuation.
📊 Key Levels:
Resistance: $120,000 (Psychological level)
Immediate Support: $118,000
Major Support Zone: $115,000–$114,000
📉 Bearish Scenario:
If BTC fails to hold above the broken trendline and slips back below $118,000, a revisit of the support zone near $115,000 becomes likely. Bears may step in again if the price fails to sustain higher highs.
✅ Conclusion:
BTC is showing potential for a short-term bullish reversal after breaking out of its descending pattern. Traders should monitor for confirmation through price continuation above $120,000. However, a cautious approach is advised near resistance levels, and invalidation below $118,000 could favor sellers once again.
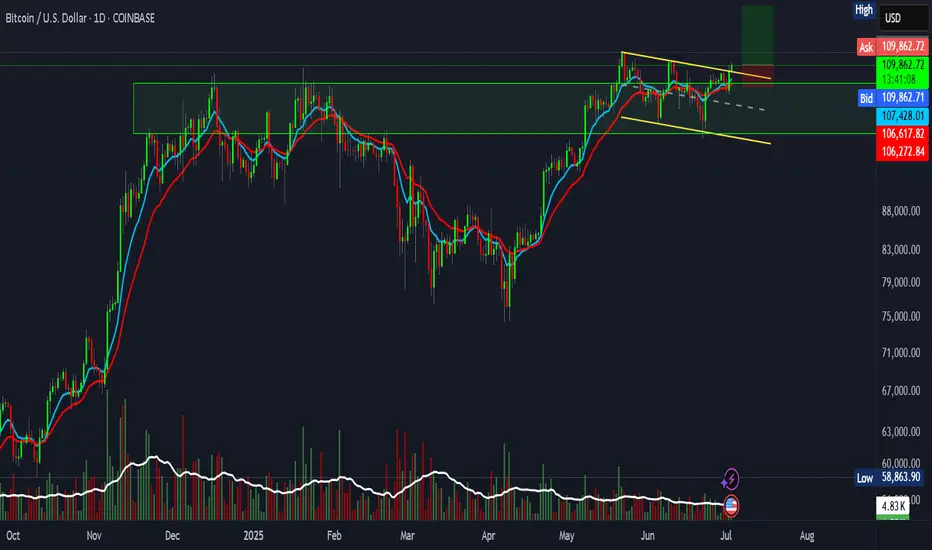
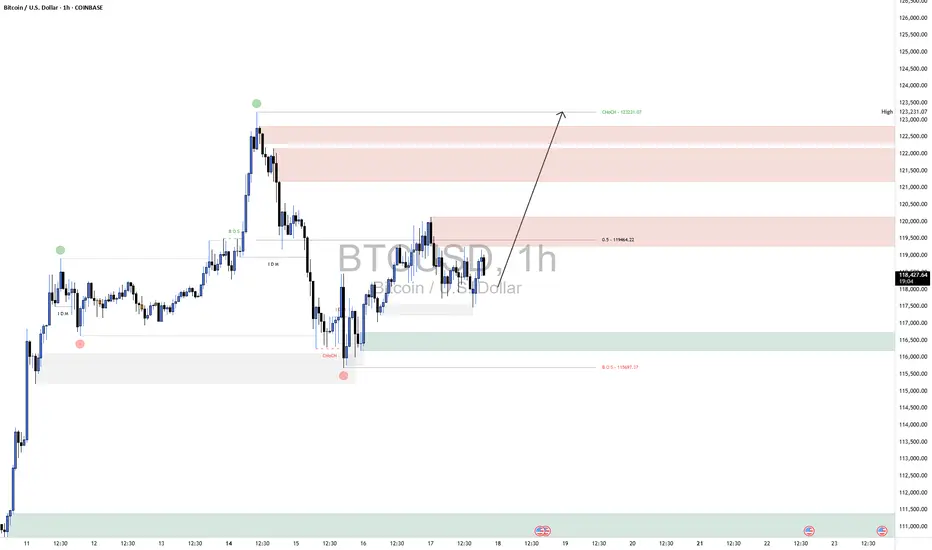
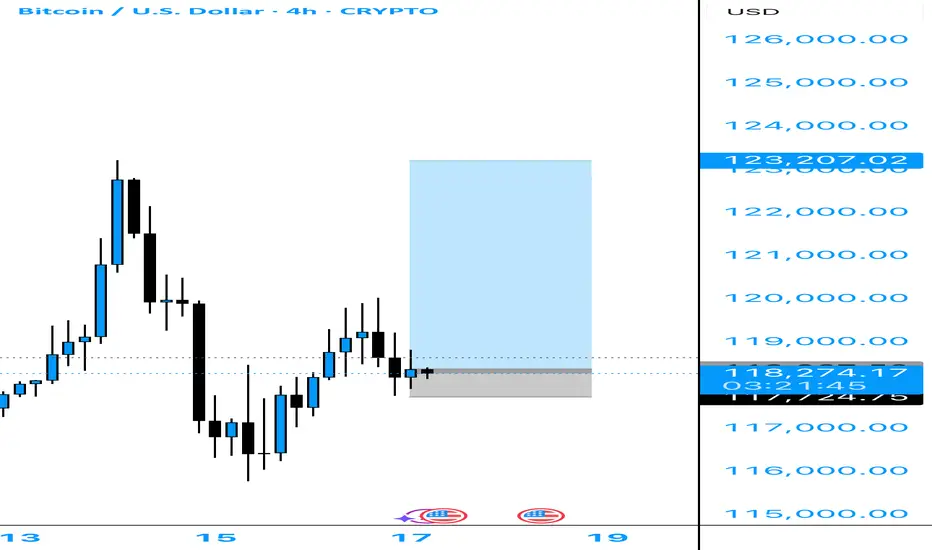
BTCUSD Long📈 Scenario Outlook:
Bias: Bullish
Preferred Play: Long setups are favorable as long as price holds above 116,600 demand.
BTC is expected to push through the intermediate supply zones and potentially attempt a full retracement toward the previous CHOCH high at 123,231.
📌 Key Zones ("Your Borders"):
🟢 Demand Zone (Support)
Zone: 116,600 – 117,600
This is a well-marked reaccumulation zone, aligned with previous demand and the CHOCH origin. Price respected this level multiple times, showing it as a valid base for long entries.
As long as BTC holds above this zone, the bullish thesis remains valid.
🔴 Supply Zones (Resistance Targets)
First Supply: 119,000 – 120,000
Aligned with the 50% retracement level (11964.22) from the previous high to low swing.
Expect short-term reaction here; however, this level may not hold if momentum continues building.
Upper Supply Zone: 121,500 – 123,200
This is the final major resistance before revisiting the previous high at 123,231.
A sweep or rejection from here could form a double top or distribution structure, depending on macro factors and volume.
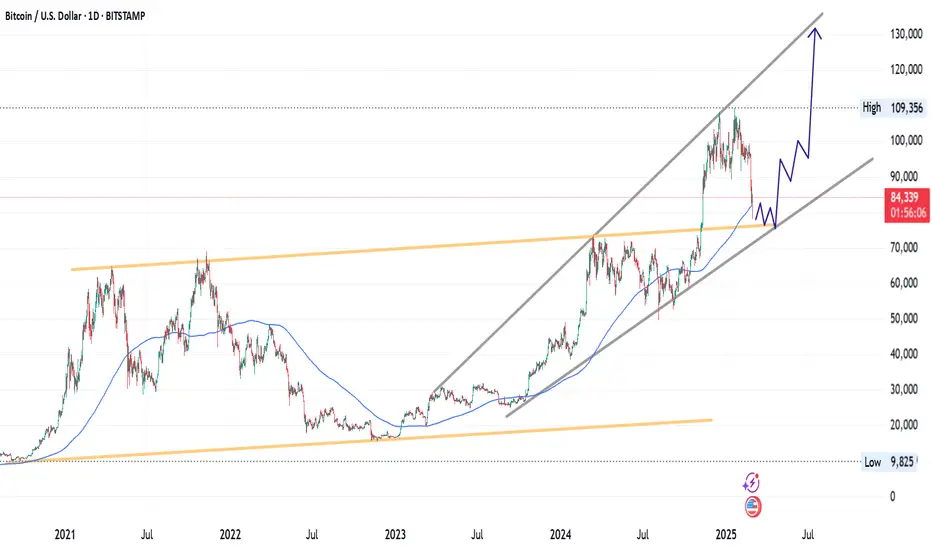
THAT WHAT YOU NEED TO KNOW ABOUT BTC IN 2025Professional Technical Analysis & Trading Plan for BTC/USD (Hypothetical 2025 Data)
---
1. Technical Structure & Key Observations
A. Price Context:
- **Current Price:** ~84,197 (below SMA 81,998).
- **SMA (Simple Moving Average):** 81,998 (likely 200-day SMA, acting as dynamic resistance).
- **Volume:** 52K (low volume suggests consolidation; watch for spikes to confirm breaks).
C. Key Levels (From Data):
- **Resistance:**
- Immediate: 81,998 (SMA).
- Major: 90,000, 100,000, 130,000 (swing highs).
- **Support:**
- Near-term: 74,000 (psychological),
---
2. Advanced Indicator Analysis
A. Momentum (RSI & MACD):**
- **RSI (14):** Likely near 40–45 (neutral-bearish zone). A break below 30 signals oversold; above 55 confirms bullish momentum.
- **MACD:** Bearish crossover possible (signal line above MACD line). Watch for reversal above SMA.
B. Volume Profile:
- **Low Volume (52K):** Indicates weak participation. A surge above 100K on a breakout/breakdown would validate direction.
- **Volume-Weighted Average Price (VWAP):** If price trades above VWAP, bullish bias strengthens.
---
3. Trading Strategies
Scenario : Bullish Reversal (30% Probability)
- **Trigger:** Daily close above SMA (81,998) with volume >100K.
- **Entry:** Long at 74,500 (confirmation of strength).
- **Targets:**
- TP1: 90,000 (8.5% move).
- TP2: 100,000 (19% move).
- **Stop Loss:** 71,500
---
5. Sentiment & Catalyst Watch
- **Bullish Catalysts:** Institutional ETF inflows, Fed rate cuts, Bitcoin halving momentum.
- **Bearish Risks:** Regulatory crackdowns, exchange hacks, macro recession.
-Conclusion
BTC/USD is at a critical juncture. *Trade the SMA break/breakdown with volume confirmation*, and prioritize risk-reward ratios. Always cross-verify with real-time data and news.
Disclaimer: Hypothetical analysis for educational purposes. Not financial advice.* 🚀
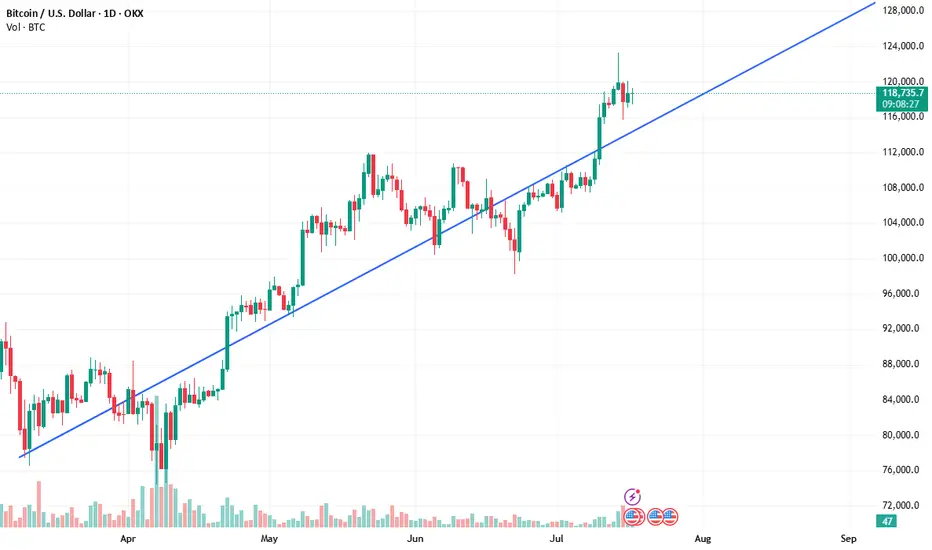
BTC seems to be following this trendline at the momentThe market seems to be buying and selling above and below this trendline
BITCOIN I am short 121,600The chart posted is my work in Bitcoin I am short using the Blackrock Etf in PUTS 70strike
BTCUSD Bullish Continuation Patterns on LTFThe trend is still bullish and the daily bull flag I posted is still at play. This is just a lower TF perspective within the bigger overacharching view.
Inverse head and shoulders and a bullish flag all indicate continuation to the upside. You can use market structure to confirm your entries and your target profit zones if you do not plan on holding until $150k
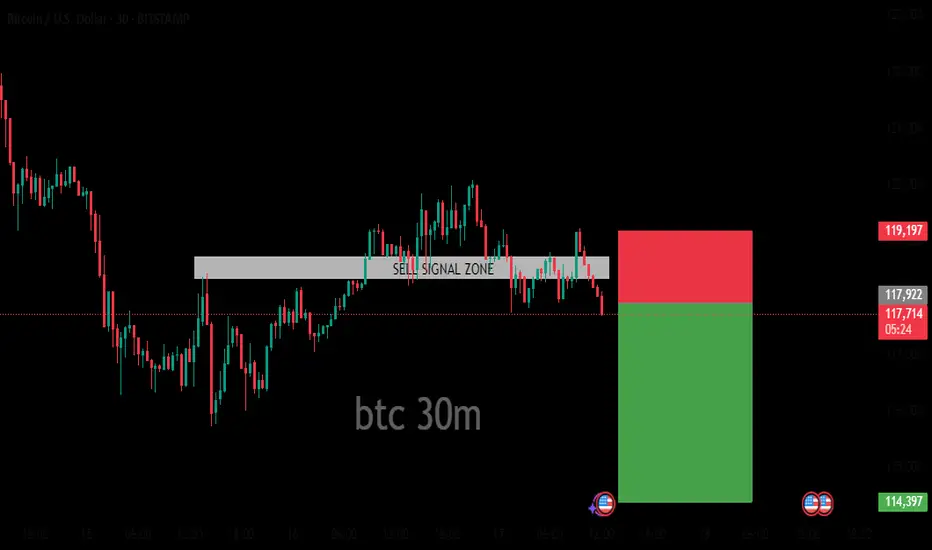
BTC 30M BEARISH ANALYSIS It features a series of vertical bars in red and green, representing price movements over time.
- The chart is labeled "btc 30m" at the bottom, indicating that it displays Bitcoin (BTC) price data over a 30-minute interval.
- A white horizontal bar spans the chart, marked with the text "SELL SIGNAL ZONE" in black letters.
- To the right of the candlestick chart, a bar graph is visible.
- The bar graph consists of two rectangular bars: one red and one green.
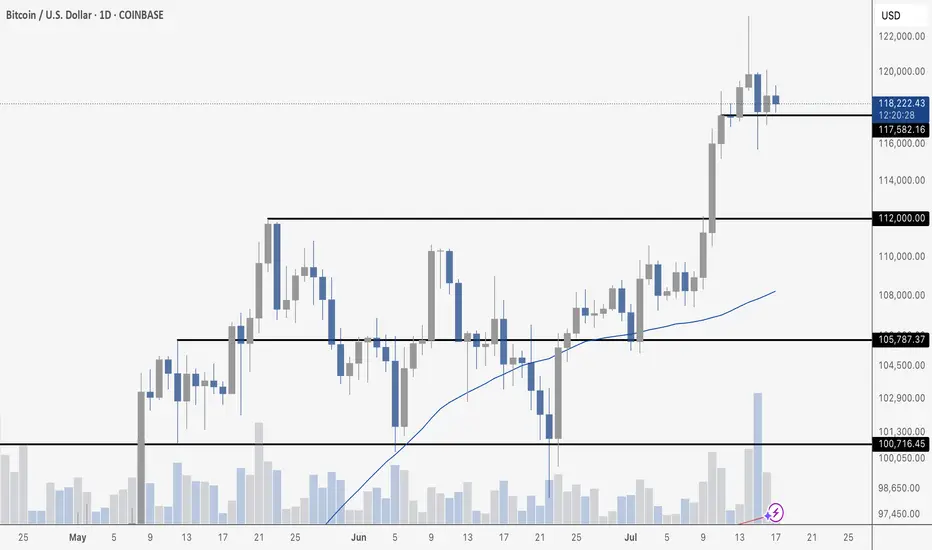
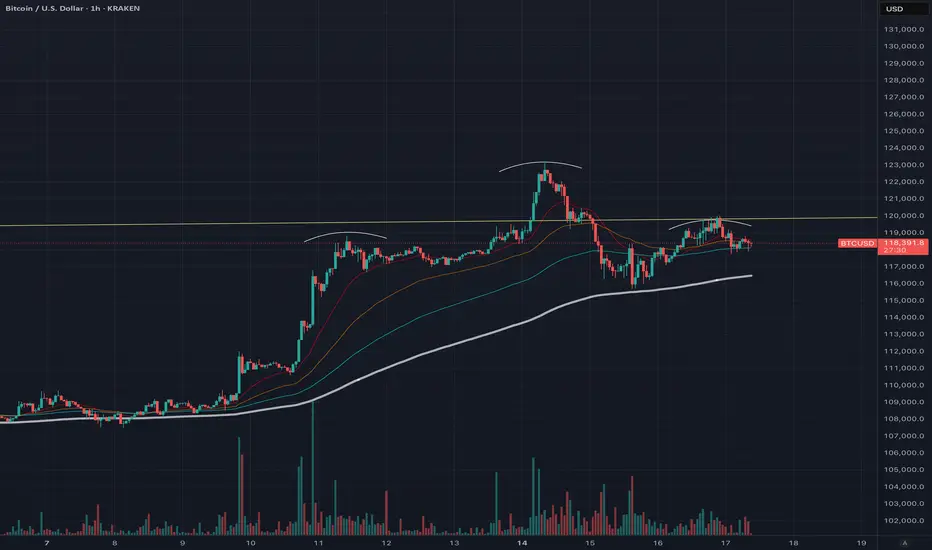
BTC CONSOLIDATESBitcoin is consolidating just below \$120,000 after Tuesday’s sharp pullback – which came on the highest daily volume since the \$74,000 bottom in March – mostly driven by selling. Despite the pressure, price held support cleanly at \$117,582 and continues to range tightly, suggesting healthy consolidation after a strong breakout above \$112,000. As long as \$117,582 holds, the structure remains bullish. A close above \$120,000 could ignite the next leg higher.
BTCUSD shortFor the rest of the week I think we will se more bearish action in BTCUSD. After a 5 wave drop we´ve just created a corection for another 5 wave move. On lower timeframe we´re in a ABC correction and fall bewow the 200EMA.
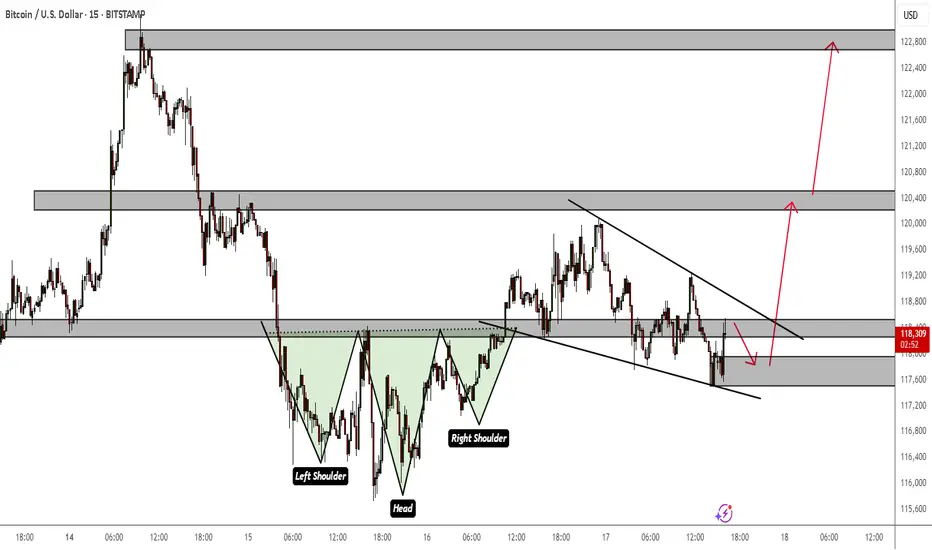
Bitcoin Day Trade Signsl To Buy NowIf this trade plays out I will make 7x my risk!
Subscribe to my YT channel at DNiceFx to watch me trade live!!
Head and shoulder pattern on hourly.
A reversal seems likely, so we should anticipate a pullback. The trading volume is decreasing while exchange volume is increasing, which suggests a potential market top based on previous trends. Greed is also on the rise. Although history doesn’t repeat itself, it certainly shows similarities. The BTC/GBP chart is indicating a double top pattern on the daily timeframe. An altcoin season may be approaching based on the ETH/BTC pair, signaling that the end of Bitcoin’s dominance could be near.
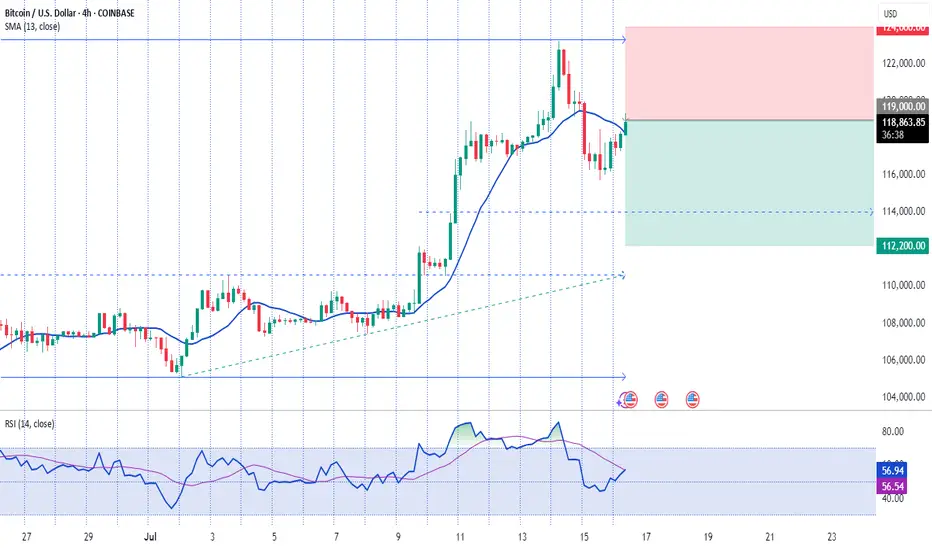
16.07.2025 #BTCUSDSELL 119000.00 | STOP 124000.00 | TAKE 114000.00 - 112200.00 | Downward price movement.
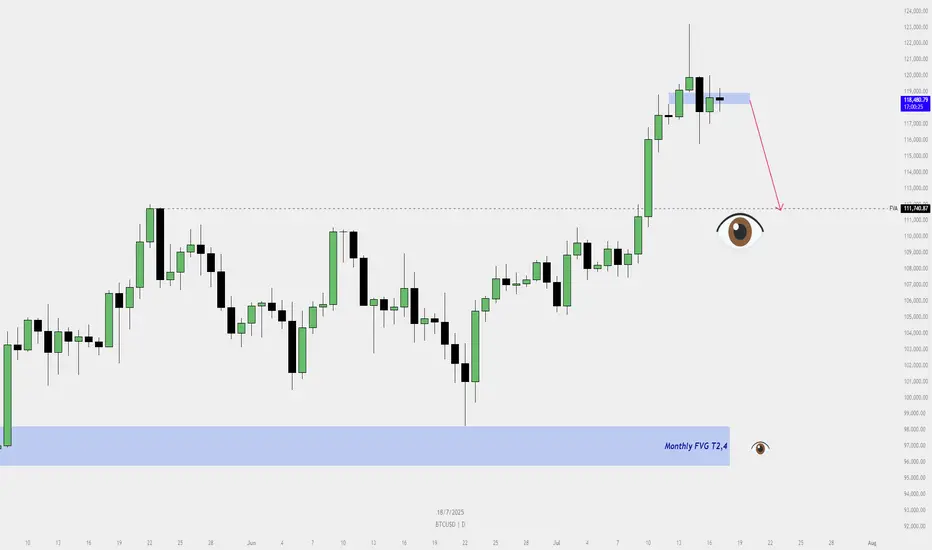
BTCUSD – Pullback Imminent?📉 BTCUSD – Pullback Imminent?
Buyers beware ⚠️ — The bullish FVG on the daily chart is no longer holding. Price has shown signs of rejection from the premium zone , and a deeper pullback toward the Fair Value Area at 111,740 seems likely.
🧠 Let the market breathe... we’ll catch the real ride from below.
👀 Eyes on the Monthly FVG (T2,4) as the ultimate demand zone if price accelerates lower.