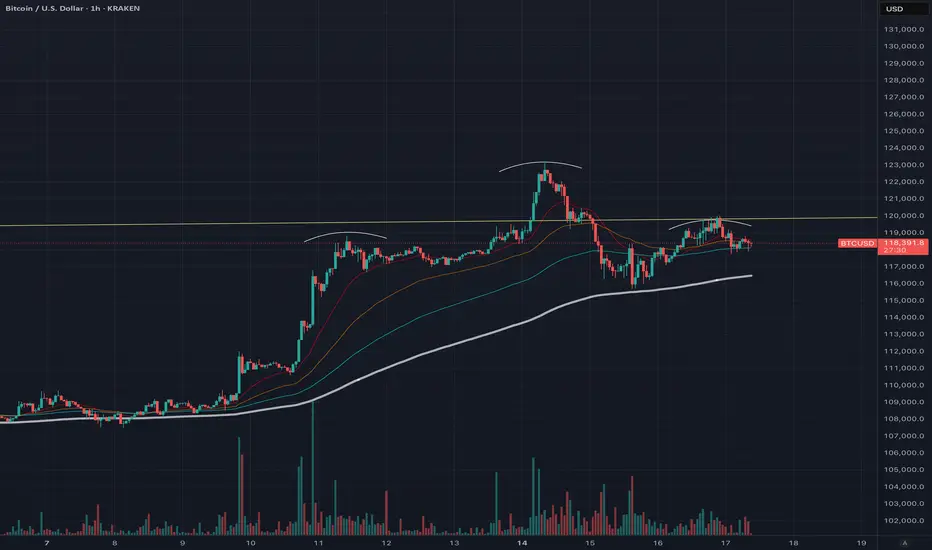
BTCUSD shortFor the rest of the week I think we will se more bearish action in BTCUSD. After a 5 wave drop we´ve just created a corection for another 5 wave move. On lower timeframe we´re in a ABC correction and fall bewow the 200EMA.
BTCUSD.PM trade ideas
Bitcoin Day Trade Signsl To Buy NowIf this trade plays out I will make 7x my risk!
Subscribe to my YT channel at DNiceFx to watch me trade live!!
Head and shoulder pattern on hourly.
A reversal seems likely, so we should anticipate a pullback. The trading volume is decreasing while exchange volume is increasing, which suggests a potential market top based on previous trends. Greed is also on the rise. Although history doesn’t repeat itself, it certainly shows similarities. The BTC/GBP chart is indicating a double top pattern on the daily timeframe. An altcoin season may be approaching based on the ETH/BTC pair, signaling that the end of Bitcoin’s dominance could be near.
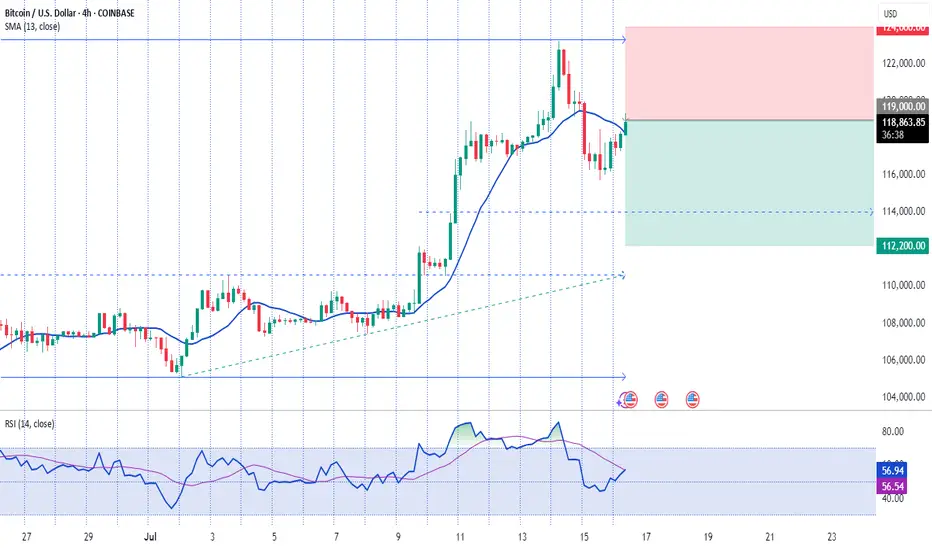
16.07.2025 #BTCUSDSELL 119000.00 | STOP 124000.00 | TAKE 114000.00 - 112200.00 | Downward price movement.
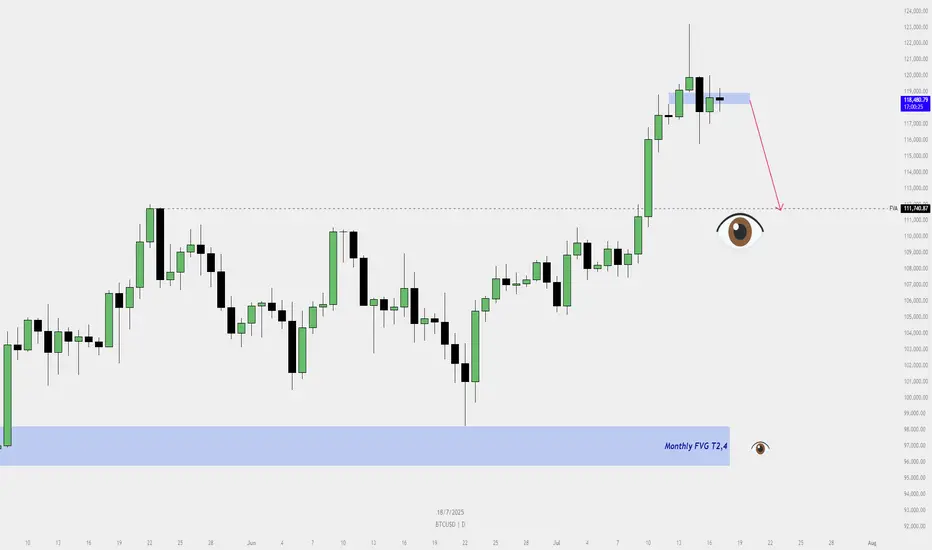
BTCUSD – Pullback Imminent?📉 BTCUSD – Pullback Imminent?
Buyers beware ⚠️ — The bullish FVG on the daily chart is no longer holding. Price has shown signs of rejection from the premium zone , and a deeper pullback toward the Fair Value Area at 111,740 seems likely.
🧠 Let the market breathe... we’ll catch the real ride from below.
👀 Eyes on the Monthly FVG (T2,4) as the ultimate demand zone if price accelerates lower.
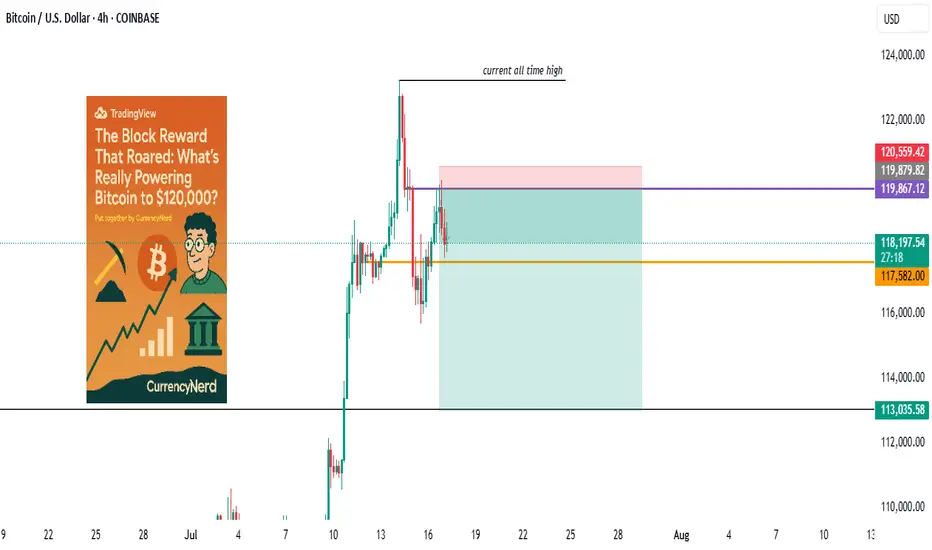
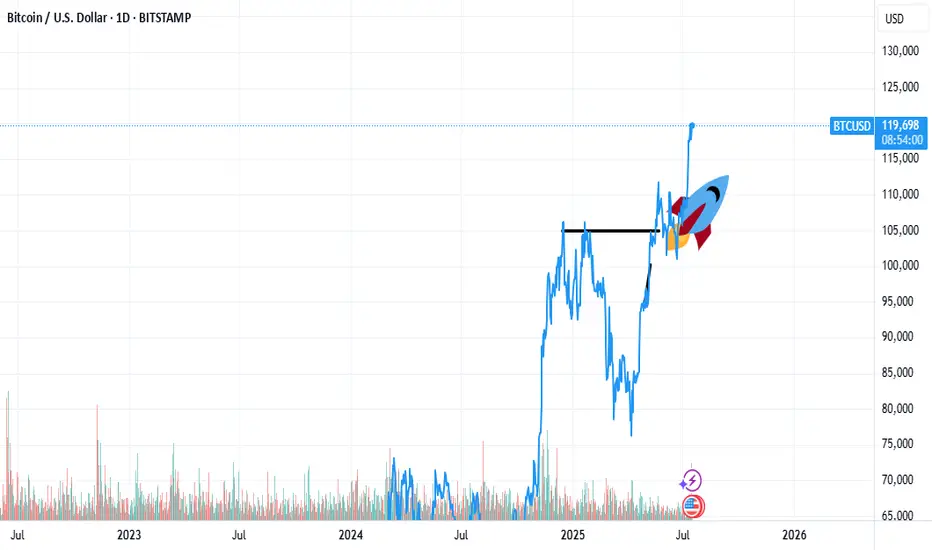
wall Street has set camp on Satoshi's backyard...Bitcoin didn’t just wake up and choose violence. It chose velocity.
As BTC blasts through the six-figure ceiling and fiddles $120k with laser precision, everyone’s pointing to “the halving” like it’s some magical switch. But let's be real, Bitcoin bull runs don’t run on fairy dust and hope. They run on liquidity, macro dislocations, structural demand shifts, and a pinch of regulatory chaos.
Here’s the nerdy breakdown of what’s really driving the Bitcoin Rocketship (and why this one’s different):
1. The Halving Effect (Not Just the Halving)
Yes, the April 2024 halving slashed miner rewards from 6.25 to 3.125 BTC. But this time, the reflexivity is louder. Miners now have to sell less, and buyers (especially ETFs) have to beg for more.
Miners = Reduced Sell Pressure.
ETFs = Constant Buy Pressure.
That’s a one-way order book squeeze. Simple math, but powerful dynamics.
2. ETF Flows: The "Spot" That Launched a Thousand Rallies
When the SEC finally gave the green light to Bitcoin spot ETFs, TradFi didn’t walk in—they stormed in.
Think BlackRock, Fidelity, and friends becoming daily buyers. It's not retail FOMO anymore, it's Wall Street with billions in dry powder doing dollar-cost averaging with institutional consistency.
🧠 Nerd Note: The top 5 U.S. spot ETFs alone are now hoarding more BTC than MicroStrategy.
3. Dollar Liquidity is Leaking Again
Despite Fed jawboning, real rates are still under pressure and global liquidity is quietly creeping back. Look at the TGA drawdowns, reverse repo usage, and China’s stealth QE.
Bitcoin, being the apex predator of liquidity, smells it from a mile away.
“In a world flooded with fiat, Bitcoin doesn’t float. It flies.”
4. Sovereigns Are Quietly Watching
El Salvador lit the match. Now, Argentina, Turkey, and even Gulf countries are tiptoeing toward a Bitcoin pivot, hedging USD exposure without broadcasting it to CNN.
Central banks don’t need to love BTC to stack it. They just need to fear the dollar system enough.
5. Scarcity Narrative Goes 3D
With 99% of BTC supply already mined and over 70% HODLed for over 6 months, every new buyer is bidding for a smaller slice of the pie. ETFs and institutions are trying to drink from a faucet that only drips.
This is not a market with elastic supply. This is financial physics with a scarcity twist.
6. Market Microstructure is Fragile AF
Order books are thin. Real liquidity is fragmented. And the sell-side has PTSD from getting blown out at $70k.
This creates a “skateboard-on-a-freeway” scenario, when a few billion in inflows hit, prices don’t just rise. They gap.
Nerdy Bonus: The Memecoin Effect (No, Really)
The memecoin mania on Solana, Base, and Ethereum has been injecting dopamine into degens—and their profits are increasingly flowing into the OG digital gold.
It’s the 2021 cycle all over again, just with more liquidity bridges and fewer inhibitions.
Nerdy Insight: The Bull Run Has Layers
What’s driving BTC to $120,000 isn’t a single headline. It’s a stacked convergence of macro, structure, psychology, and coded scarcity.
Bitcoin isn’t “going up” just because of hope or halving hype. It’s going up because it’s the cleanest asset in a dirty system, and now both retail and institutions agree.
Still shorting? That’s not “fading the crowd.” That’s fighting thermodynamics.
Stay nerdy, stay sharp.
put together by : @currencynerd as Pako Phutietsile
Crypto Week in the U.S. – Bitcoin SurgesCongressional Crypto Week: Bitcoin Hits All-Time Highs in a Decisive Week for the U.S.
Ion Jauregui – Analyst at ActivTrades
Bitcoin (BTCUSD) is back in global headlines after breaking above $123,203 this Tuesday, setting a new all-time high in the same week. So far in July, the leading cryptocurrency has surged 17%, fueled by a combination of institutional inflows, political momentum, and evolving regulation. This week, Washington is hosting “Crypto Week,” a key event that may define the legal and financial future of digital assets in the United States. At the same time, institutional backing shows no signs of slowing down—Bitcoin ETFs continue to set records for net inflows, particularly BlackRock’s IBIT, now managing over $85 billion in assets.
ETFs, Trump, and Regulation: All Roads Lead to Crypto
BlackRock’s spot Bitcoin ETF, IBIT, attracted $729 million in net inflows last week alone, setting a historic milestone by becoming the fastest ETF ever to reach $80 billion in assets under management—just 374 days, compared to over 1,800 days for the previous record held by the Vanguard S&P 500 ETF. The growing institutional interest—with over 265 funds and entities now actively investing in BTC—not only validates the asset class but also tightens supply: BlackRock reportedly acquired an average of more than 860 bitcoins per day last week. This persistent demand is directly contributing to the price momentum.
A Legal Framework in Progress
Three major bills are on the Congressional agenda this week:
The Genius Act: Aims to regulate stablecoins and has already passed the Senate with bipartisan support.
The Clarity Act: Seeks to define which cryptocurrencies qualify as securities or commodities, clarifying regulatory oversight.
The Anti-CBDC Act: Proposes restricting the government’s ability to issue an official digital currency, favoring decentralized ecosystems.
This regulatory push is seen by the market as a sign of institutional consolidation in the crypto space, paralleling the already advanced European MiCA framework.
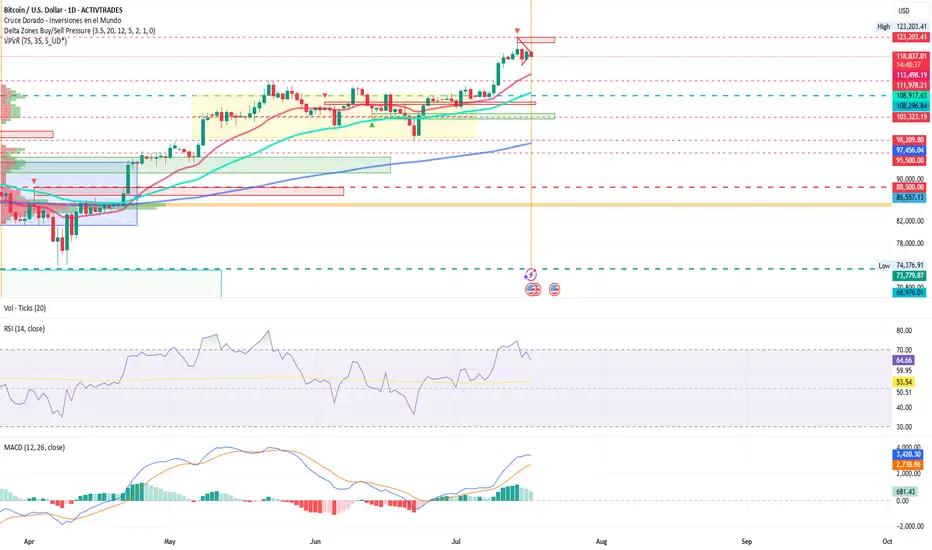
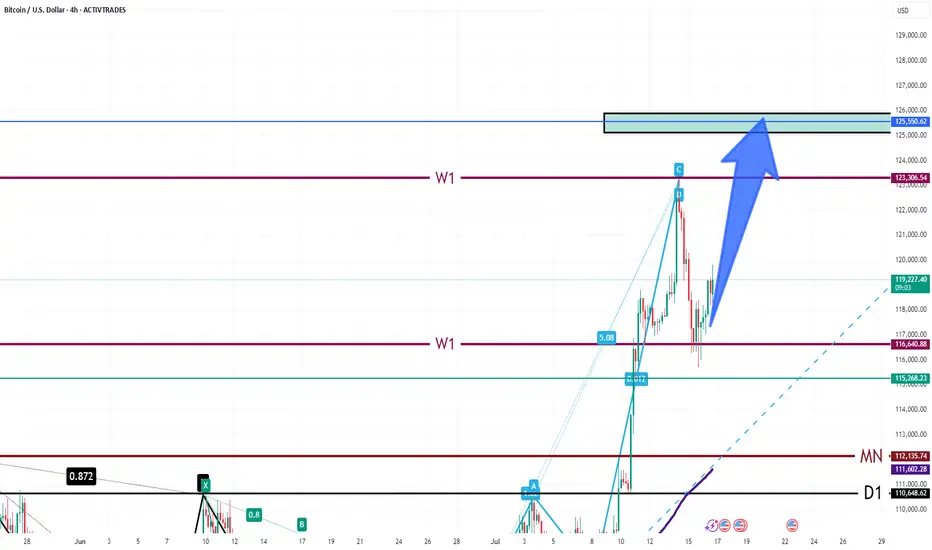
Technical Analysis of BTCUSD
On the daily chart, Bitcoin broke decisively above the previous ceiling at $112,000 on July 12 and has since been validating a consolidation pattern near the $120,000 level—forming a bullish pennant on the 1-hour chart. The RSI remains overbought at 64.92%, but with no current signs of bearish divergence. The next technical target lies in the $130,000–$135,000 zone, while the nearest support is found at $118,000. A daily close below that level could trigger a technical correction toward $108,000–$109,000, marking the base of the current impulse. The point of control sits far lower at $85,195, although the current move appears to be unfolding within the third of three key volume profile levels. The MACD continues to support price expansion, though trading volume appears to be declining. Delta level indicators suggest strong resistance near current price highs, meaning another push may be needed—possibly triggered by continued regulatory momentum.
*******************************************************************************************
The information provided does not constitute investment research. The material has not been prepared in accordance with the legal requirements designed to promote the independence of investment research and such should be considered a marketing communication.
All information has been prepared by ActivTrades ("AT"). The information does not contain a record of AT's prices, or an offer of or solicitation for a transaction in any financial instrument. No representation or warranty is given as to the accuracy or completeness of this information.
Any material provided does not have regard to the specific investment objective and financial situation of any person who may receive it. Past performance and forecasting are not a synonym of a reliable indicator of future performance. AT provides an execution-only service. Consequently, any person acting on the information provided does so at their own risk. Political risk is unpredictable. Central bank actions can vary. Platform tools do not guarantee success.
SellRejection Level
Daily Volume
Market Structure Shift
London Session
Trend Line Break
Untapped Order Point
Head And Shoulder Pattern
Bitcoin Buy analysis/ideaThis analysis is based on the 4-hour and 1-hour timeframes and executed using Supply and Demand trading and trend formation. Complete explanation in the video!

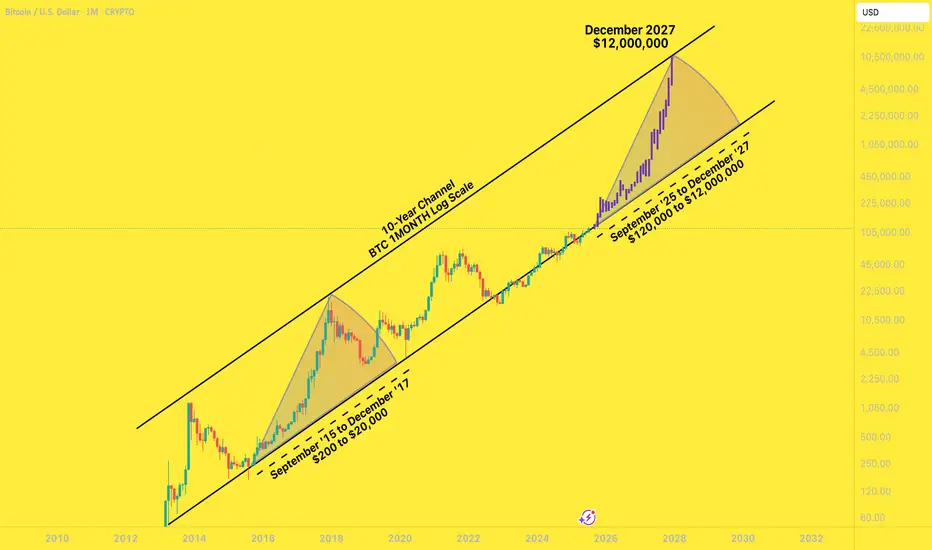
BTC to $12,000,000 December '27I had a years-old bookmarked chart from @MillionaireEconomics that I wanted to update and pick a random, extremely bullish candle pattern from the last time BTC came off the bottom channel to slap on it.
Riddle me this:
Why shouldn't Bitcoin go to $12,000,000 by December 2027?
Saylor continues to lead the way for global companies to scramble to build their own BTC warchests. These early adopters are having investor money dumped into them by the truckload.
Countries are stacking BTC
The BTC ETFs are a smash hit
Trump is all for making his own multi-billy family bitty stack
Mid-curvers will sell far too early, for far too little.
In the next two years, you'll be bombarded with countless, seemingly good reasons to sell your Bitcoins for hundreds of thousands of dollars - and then millions of dollars.
A shocking number of people will be far too early to sell. They will wake up in a cold sweat, night after night, haunted by their "could-have-been" stack, the number that updates in their head ten times a day, going up by six or seven figures a day .
... until they FOMO right back in at $11,999,999.
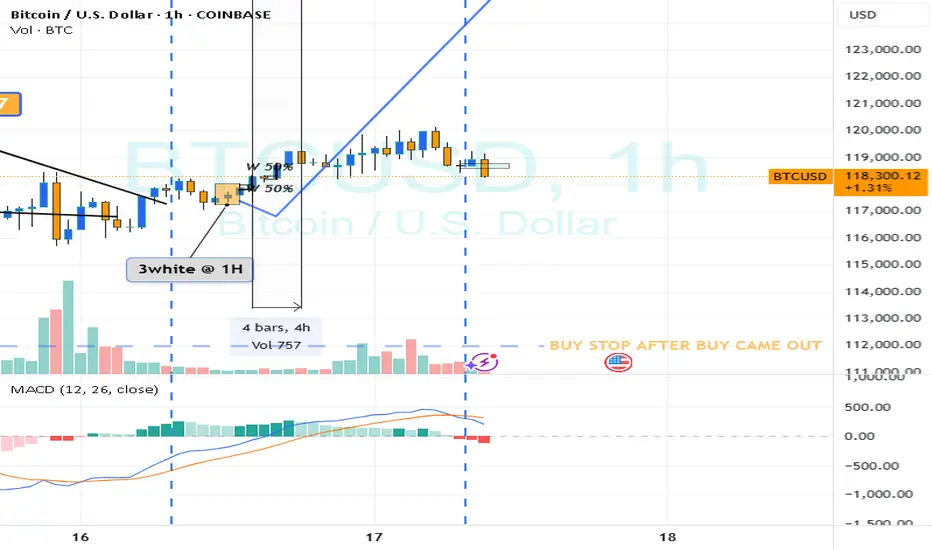
BTC intra? RECAP
Hi
Hope yest was a successful day trading for you.
Initial Bias for the DAY was up
I found : 3 white soldiers
Instant entry at found
or wait for retrace and my stop was below pattern
Profit. take when satisfied
So very important what risk i put in
say 100$ for a trade would be happy at 200$-300$
1:2 /3
or whatever i'm willing
adjusting to every trade
Easier said than done; your confidence will suddenly peak
You'll push your luck .. n risking way more than should
Be discipline
I hope the force will be with you.. n be lucky in 99.999% of the time
Not a guru
*& sharing is not a sin
nb/ all guru can slideee :)
Looking for your nx entry???
Bullish Patterns - will be in pdf in www
If new; print it
trade when see one (forexbee.co)
Do 20-50 trades.
Journal it.
Then your report card; positive or negative
pass or fail, is the pattern in web telling you the truth or lie
You decide
I hope your confidence will spike and won't depend on anyone anymore.
It's like learning to walk..
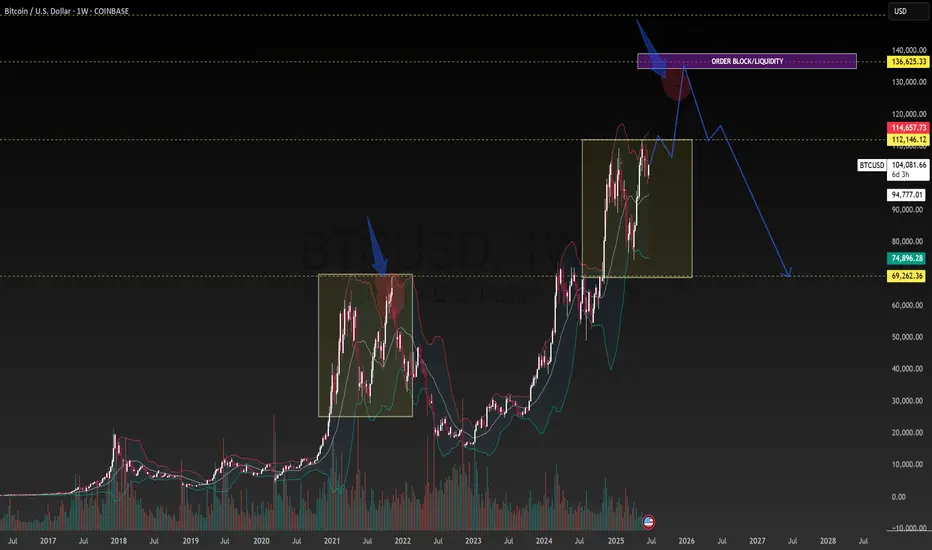
BTC USDT 135k TARGET. BTC USDT going to cross the 135k mark by the year end before cooling off.
HISTORY REPEATS ITSELF.
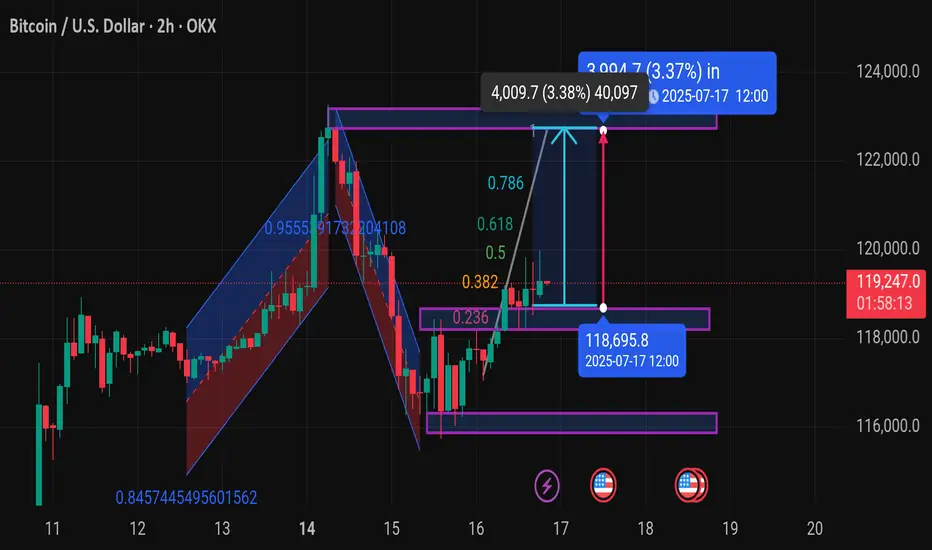
Btcusd techinical analysis.Chart Overview (BTC/USD - 2H, OKX):
Current Price: $119,240.5 (+1.23%)
Key Zones:
Support Zone: Around $118,695.8 (highlighted for July 17, 12:00)
Resistance/Target Zone: Around $123,250 (based on the measured move)
Fibonacci Levels: Drawn from the recent swing high to swing low
Important retracement levels: 0.236, 0.382, 0.5, 0.618, 0.786
Price is currently testing the 0.5–0.618 zone, which is a common area for potential breakout or rejection
Potential Price Move:
Bullish Projection:
Upside target of $4,009.7 (3.38%) from the breakout area
Reaching the $123,250 range by July 17 at 12:00 (UTC)
Technical Patterns:
It looks like you're tracking:
A potential bullish breakout from a consolidation range
Possibly a bullish flag or continuation pattern
Momentum is shifting after a clean bounce off the 0.236 zone
---
Let me know if you want:
A deeper analysis (e.g., RSI, MACD, volume)
Confirmation for long/short entries
Risk management suggestions
What’s your goal here — are you planning to trade this move or just analyzing the pattern?
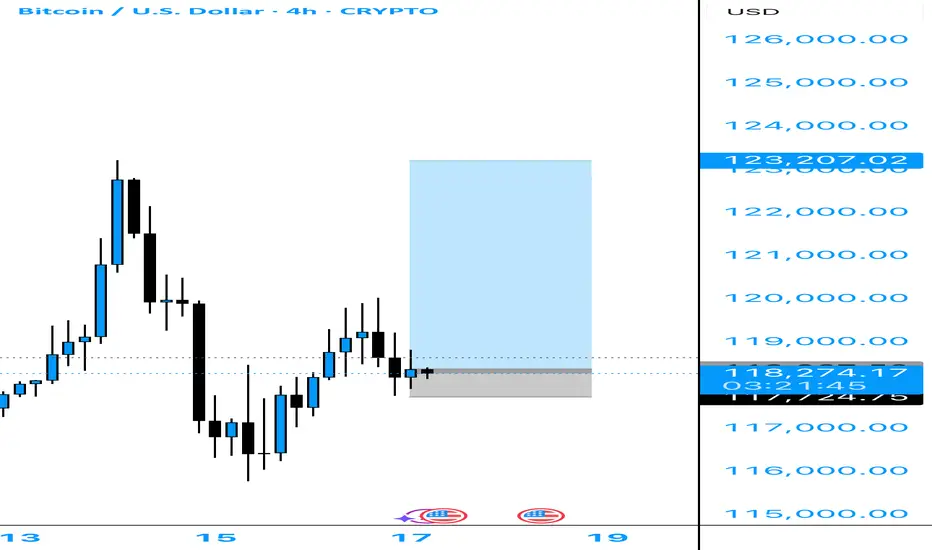
Bullish Correction Complete — Targeting 125,500–126,000Market Overview:
After a strong bullish impulse, BTC retraced to the 116,000–117,000 support area and is now showing renewed momentum. The current price action suggests a move toward the 125,500–126,000 target zone.
Technical Signals & Formations:
— Completed ABC corrective structure
— Weekly support held at 116,000–117,000
— Price bouncing from 144 EMA
— Break above local resistance confirms bullish continuation
Key Levels:
Support: 117,000, 116,000
Resistance: 123,300, 125,500–126,000 (target zone)
Scenario:
Primary: holding above 119,000 opens the way toward 125,500–126,000
Alternative: break below 117,000 could lead to a deeper pullback toward 115,000
BIG ALERT: Stock Market shown a massive break on a TL support. 🚨BIG ALERT: Tech Sector shown a break on a massive TL support level and this news just came out.
We may see everything reverse here pretty soon, depending how the market responds......
CRYPTO may still trend upward and most likely WILL!
- Crypto wins in the end, stay watchful! #BlackChain

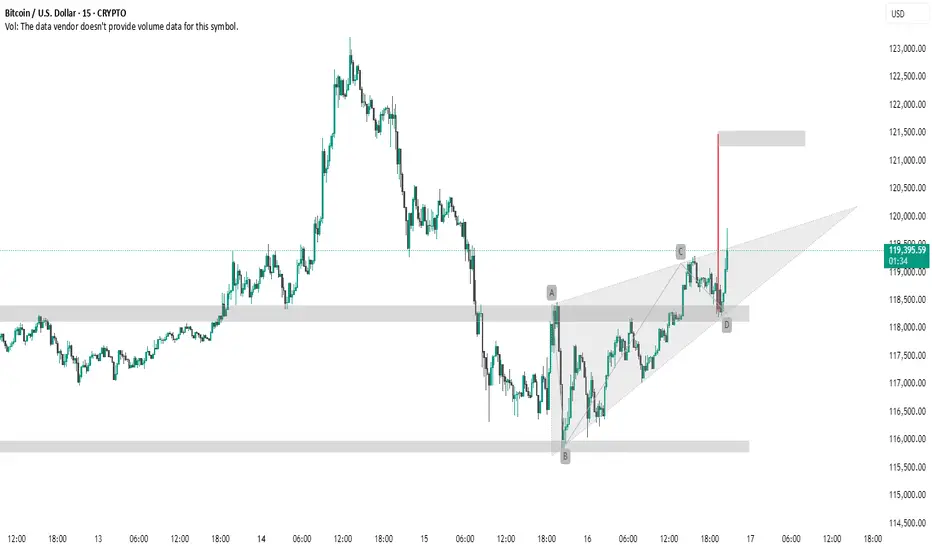
BTC #Trangle BreakoutThis 15-minute BTC/USD chart presents a **bullish breakout** from a **rising wedge pattern**, which typically has bearish connotations but in this case broke upward — suggesting strong buying pressure.
Key Observations:
* **AB=CD Pattern**: The chart shows a completed harmonic AB=CD pattern, typically a **reversal** or **continuation** signal, depending on context.
* **Breakout & Target Zone**: Price broke above the wedge resistance near point D, with a projected target zone around **\$121,500**, shown with the red vertical line and grey box.
* **Support Zones**: Well-defined support areas near **\$118,000** and **\$116,000** provide a strong base for the bullish move.
Summary:
This setup indicates a **bullish continuation** with a breakout from the wedge, validated by the harmonic pattern and volume momentum (if available). Traders may watch for price holding above \$118,000 to confirm continuation toward \$121,500.
thank u
Bitcoin bull runthe $120k bitcoin all time high comes earlier than expected, it looks like our next stop might be $150k by the end of these year
4 Analyses with 100% sensitivityBTCUSD - LTCUSD - ETHUSD - XRPUSD
I suggest that if you want to see the strongest price support in these 4 currencies, check out the analysis I posted for these currencies in the past months.

Bitcoin | BTCUSD | SELLSell Bitcoin.
Price reached supply level on 1H, we got confirmation of rejection from 15m.
Take Profit: 111,430
Stop Loss: 120600
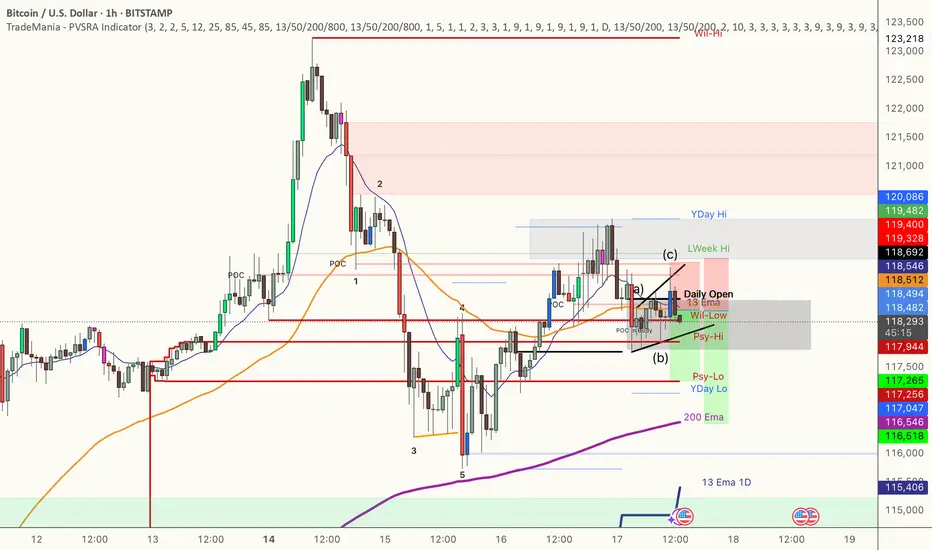
BTC Possible Short-Term Scenario (Long)Sharing my view on the BTC short-term scenario.
Main idea here is to find confluence of the resistance levels using different technicals.

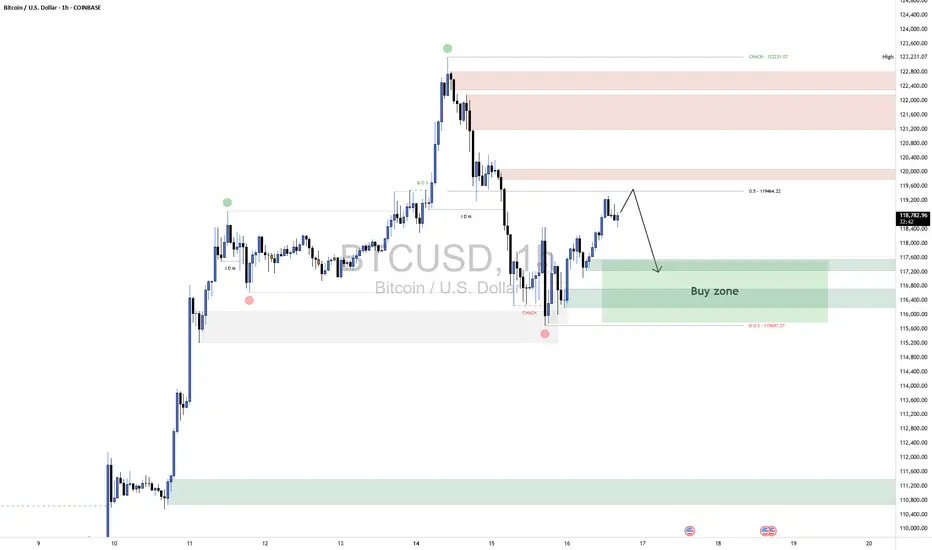
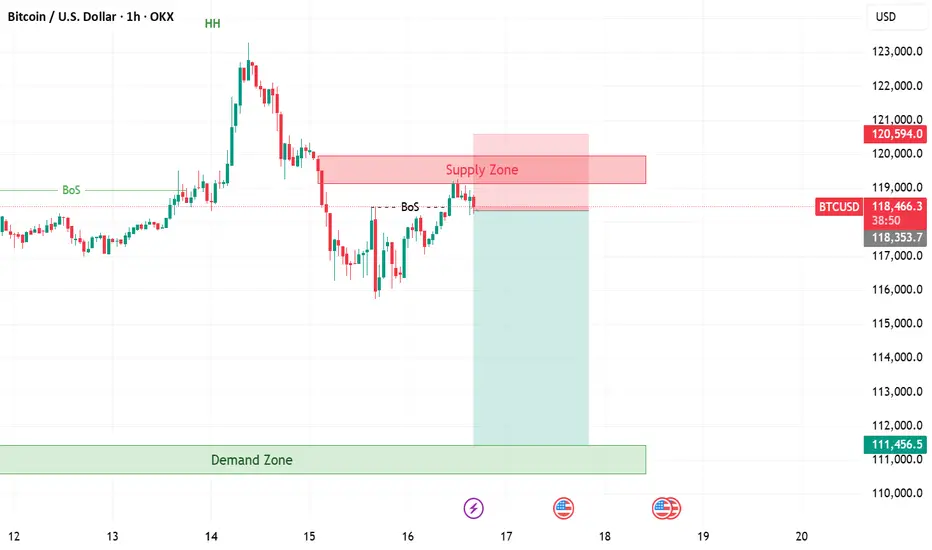
BTCUSD ShortBTCUSD 1H Technical Analysis
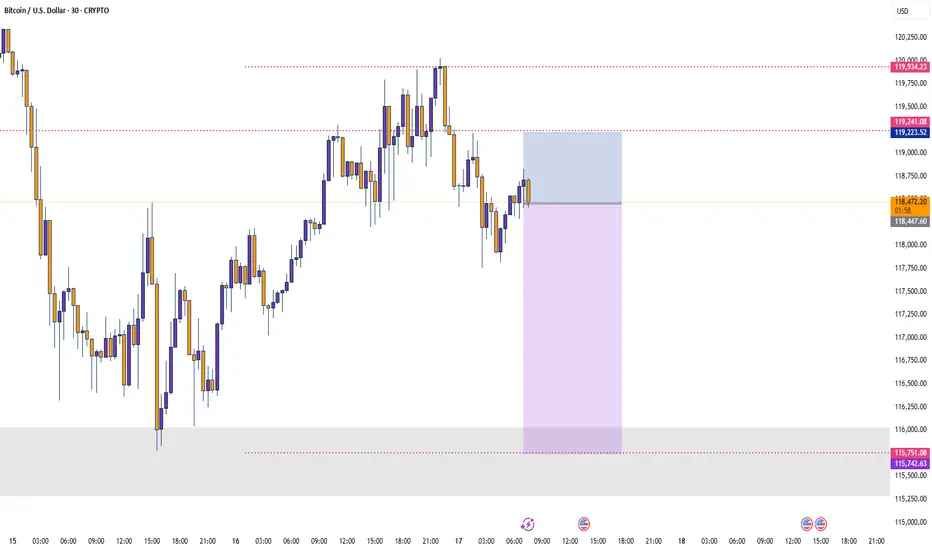
⚙️ Scenario Outlook:
Bias: Bearish
Preferred Play: Wait for price to enter the 119,000–120,000 supply zone. If price shows signs of exhaustion or bearish confirmation (e.g. bearish engulfing, strong rejection), a short position becomes favorable.
Targets: First target at 117,200; final target near 115,600–115,000 range, depending on how price behaves within the intermediate demand.
🔼 Supply Zone (Resistance):
Zone: 119,000–120,000
This red zone marks a previously unmitigated supply area aligned with the 50% Fibonacci retracement level from the prior bearish impulse. It's expected to act as the final resistance before the next move lower. A rejection from here would confirm bearish intent and offer optimal risk-to-reward for short setups.
🔽 Demand Zones (Support Targets):
First Demand Zone: 117,200–117,600
This green border is your first liquidity pocket to watch. It may offer a brief reaction or bounce, but if bearish momentum holds, price is likely to continue through it.
Deeper Demand Zone: 115,600–116,200
This is the stronger accumulation area, marked by your lower green zone. It sits just above the previous CHoCH and BOS lows, making it a prime liquidity sweep and reversal candidate if price moves deeply into it.