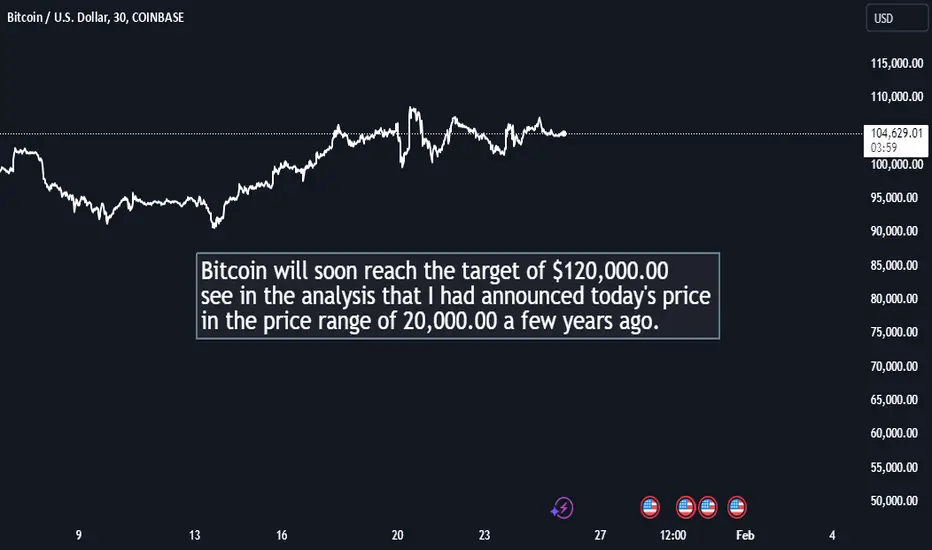
Bitcoin $120,000.00 Bitcoin will soon reach the target of $120,000.00, see in the analysis that I had announced today's price in the price range of 20,000.00 a few years ago.
Sasha Charkhchian
BTCUSD.PM trade ideas
Whales Impact on BTC and XRP MarketsKey Points:
Whales drive market dynamics, focusing on BTC, ETH, XRP.
Whales influence price movements and trader behavior.
Institutional inflows increase, spotlighting large-cap assets.
Whale activities have drawn attention due to their potential to alter market dynamics, indicating possible price shifts and investment strategies for traders.
Recent Influences of Whale Activity on Cryptocurrency Markets
Recent whale activity has driven interest in Bitcoin and XRP, as whales accumulate assets, influencing market trends. Abdullah “Abs” Nassif emphasized the strategic importance of holding, advising caution.
"If you hold it and play the game like we do, you have a chance at freeing people around the world from the debt slavery system. I can promise you that." - Abdullah “Abs” Nassif, Host, Good Morning Crypto
Financial markets are adapting, with noticeable movements in cryptocurrency prices due to whales' actions. Their accumulation signals rising confidence, especially in Bitcoin, which hit a new all-time high.
BTC's surge influenced the broader market, encouraging capital flow into large-cap assets. These movements reflect potential shifts in trader strategies, highlighting the impact of significant investments.
Insiders suggest regulatory developments may affect prices, yet whale activity implies potential long-term growth. Historical patterns highlight institutional investors' stability during volatile periods, underscoring the strategic value of holding as exhibited by these whales.
Plan on bracing yourself for Monday most likely. That's when we'll really see the test as to whether crypto can maintain the momentum. OKX:BTCUSD BITFINEX:BTCUSD BITFINEX:BTCUSD OANDA:BTCUSD
10 Types of Cryptocurrencies: Explanations and ExamplesCryptocurrencies go far beyond Bitcoin. Today’s digital asset market includes a wide variety of coins and tokens, each serving distinct purposes. Below are 10 key categories of cryptocurrencies with brief explanations and examples:
Store of Value Cryptocurrencies:
Used as a digital form of gold or a long-term value reserve.
▶ Example: Bitcoin (BTC)
Smart Contract Platforms:
Support decentralized applications and programmable transactions.
▶ Example: Ethereum (ETH)
Stablecoins:
Pegged to fiat currencies to reduce volatility.
▶ Examples: USDT, USDC
Payment Tokens:
Designed for fast, low-cost money transfers.
▶ Examples: XRP, Stellar (XLM)
Governance Tokens:
Allow holders to vote on protocol decisions.
▶ Examples: UNI, MKR
Meme Coins:
Inspired by internet culture and social trends.
▶ Examples: Dogecoin (DOGE), Shiba Inu (SHIB)
Gaming Tokens:
Used in blockchain-based games and metaverses.
▶ Examples: AXS, SAND
Privacy Coins:
Focused on anonymous, untraceable transactions.
▶ Examples: Monero (XMR), Zcash (ZEC)
NFT Tokens:
Represent digital collectibles or assets on-chain.
▶ Examples: Bored Ape, CryptoPunks (ERC-721)
Infrastructure Tokens:
Power scalability, cross-chain solutions, or protocols.
▶ Examples: Polkadot (DOT), Cosmos (ATOM)
Understanding these categories helps investors and users navigate the complex crypto ecosystem more effectively.

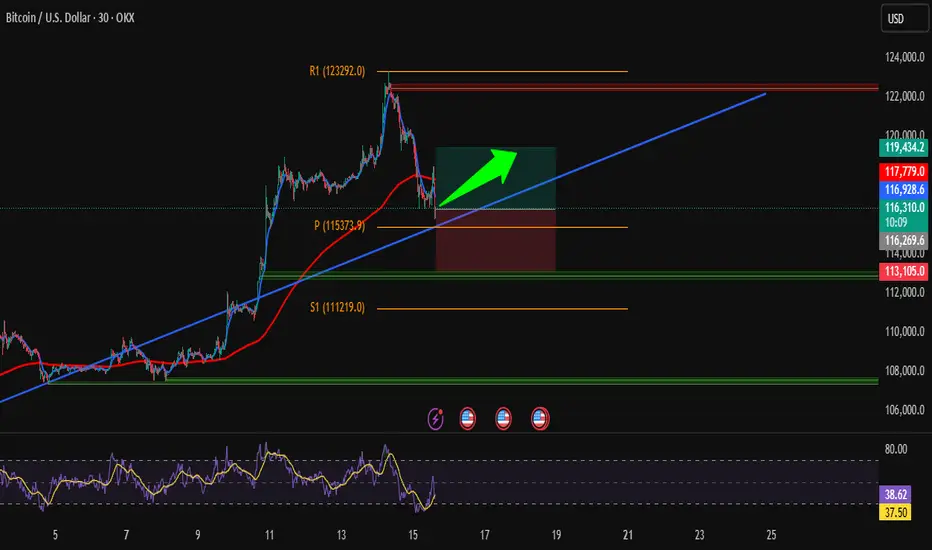
Clean BTC Trade – Bounce from Key Trendline SupportHi traders! , Analyzing BTC/USD on the 30-minute timeframe, we can observe that price is respecting the ascending channel and reacting to the dynamic trendline support (blue line). This bounce, aligned with prior structure, signals a potential bullish continuation.
🔹 Entry: 116,249
🔹 Take Profit (TP): 119,434
🔹 Stop Loss (SL): 113,105
Price remains above the 200 EMA while continuing to respect the ascending trendline, signaling sustained bullish structure. The RSI is showing a bullish divergence, which supports the idea of upward momentum. We also saw a strong reaction at the pivot point (115,373), and a bullish engulfing candle formed right near the trendline — adding further confirmation to this potential long setup.
This long setup presents a favorable risk/reward ratio within the context of the broader trend. Targeting a clean break above previous resistance and return to the R1 zone.
⚠️ DISCLAIMER: This is not financial advice. Trade at your own risk and always use proper risk management
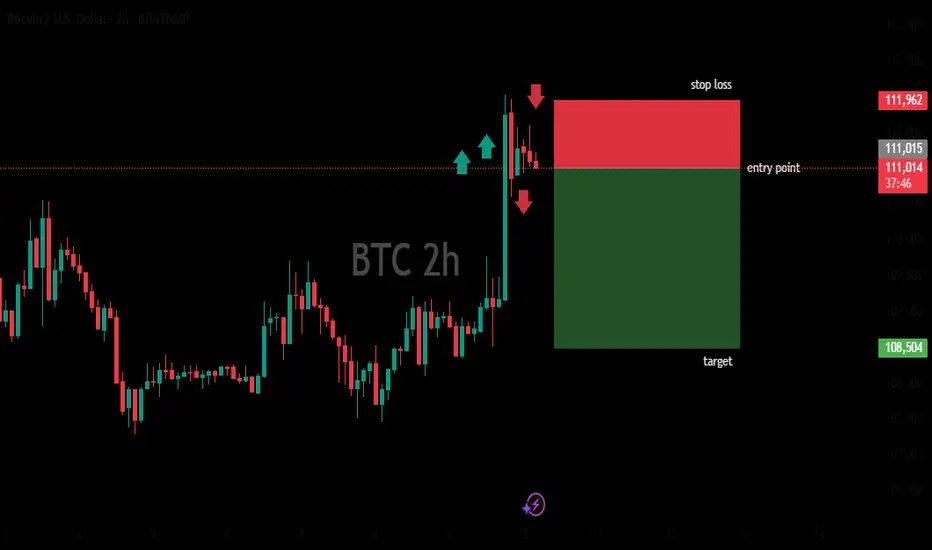
btc 2hours bearish analysisThe image shows a computer screen displaying a Bitcoin price chart on the TradingView platform. The chart is set to a 2-hour time frame and shows the price of Bitcoin in US dollars. The chart has several indicators and annotations, including a stop loss, entry point, and target price.
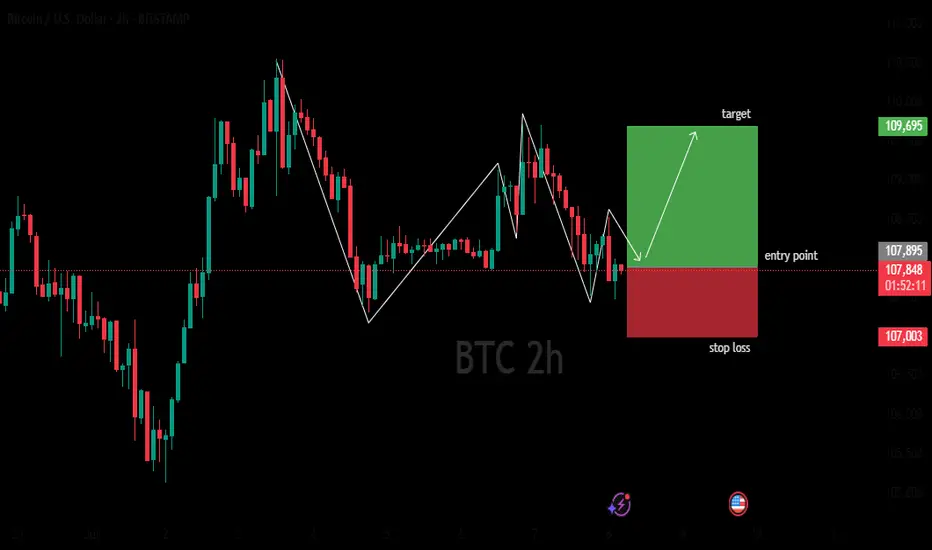
BTC 2HOURS BULISH ANALYSISThe image shows a computer screen displaying a Bitcoin trading chart on the TradingView website. The chart is titled "BTCUSD" and features a 2-hour time frame, with a black background and white text. The chart displays a downward trend, with red and green bars indicating price movements.
Global Market Overview | July 15President Trump’s latest statements made headlines again, but market reactions have become more measured. The Dow declined slightly, while Asian markets presented mixed performances; Japan remained flat, Korea and Australia posted losses, and Taiwan outperformed. The US dollar strengthened as the yen weakened. Bitcoin recovered near $118,000 after dropping from its $123,000 high. Silver held firm above $38.
Today, market focus turns to U.S. PPI data and key bank earnings reports.
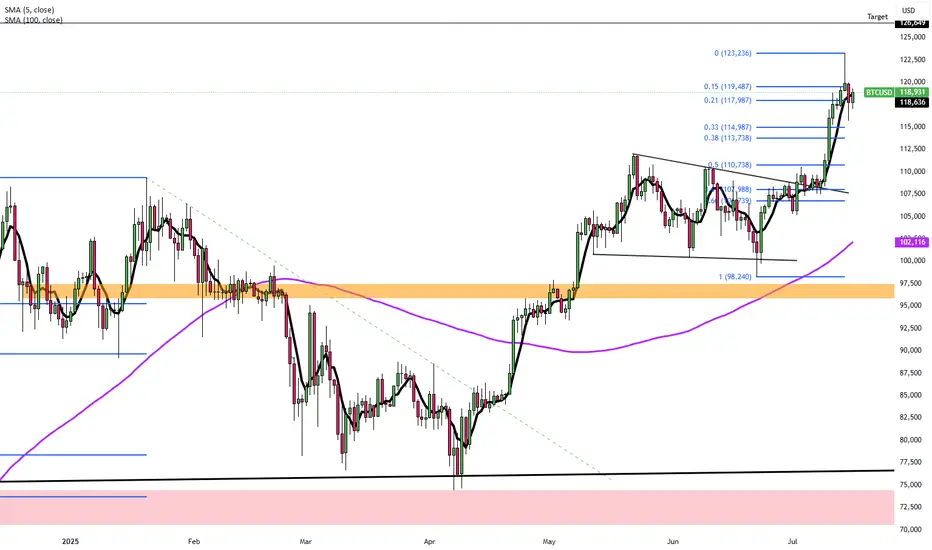
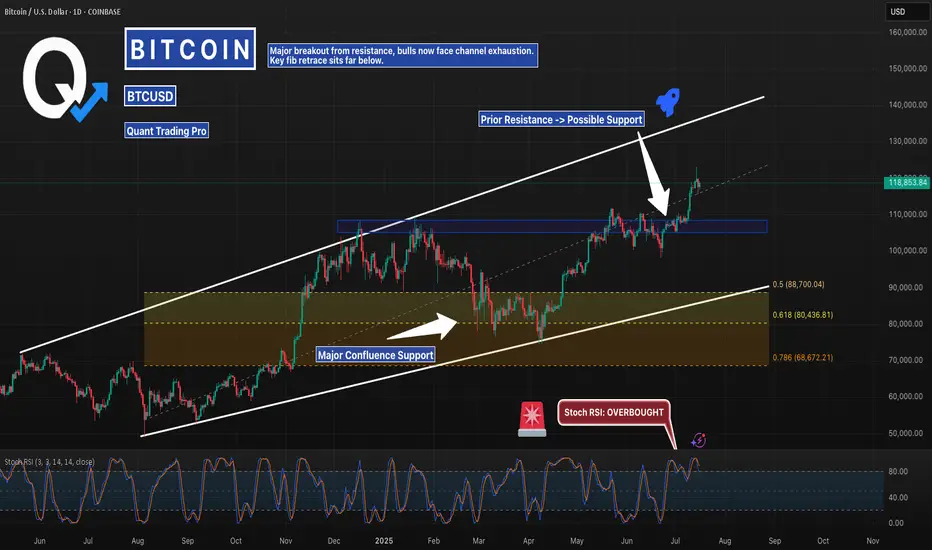
BTCUSD - Breakout Or Bull Trap? Watching the Fib Reload ZoneBitcoin just cleared the prior resistance zone near 114K–115K, breaking higher within the macro ascending channel. But with Stoch RSI overheated and price stretching toward the upper trendline, this move may exhaust soon.
I’m watching the Fib confluence zone between 88K–80K — which aligns with the mid-channel and prior breakout structure. If bulls lose steam, that’s where the real bid could return.
Set alerts. Let the algo hunters chase.
This is where smart traders prepare.
#BTCUSD #Bitcoin #Crypto #PriceAction #Fibonacci #SmartMoney #Backtesting #QuantTradingPro #TradingView
BITCOIN Will Go Higher! Long!
Here is our detailed technical review for BITCOIN.
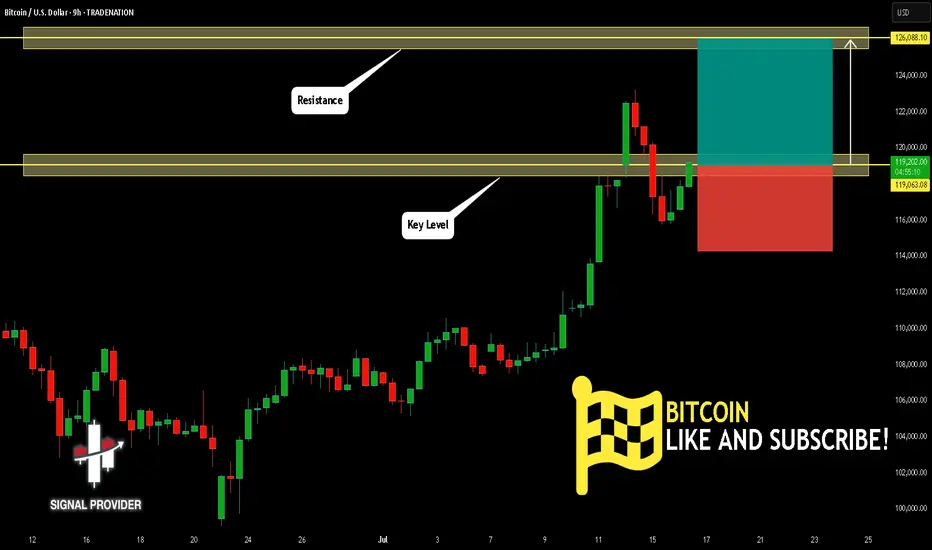
Time Frame: 9h
Current Trend: Bullish
Sentiment: Oversold (based on 7-period RSI)
Forecast: Bullish
The market is trading around a solid horizontal structure 119,063.08.
The above observations make me that the market will inevitably achieve 126,088.10 level.
P.S
Overbought describes a period of time where there has been a significant and consistent upward move in price over a period of time without much pullback.
Disclosure: I am part of Trade Nation's Influencer program and receive a monthly fee for using their TradingView charts in my analysis.
Like and subscribe and comment my ideas if you enjoy them!
BTC Bottom & New ATH..... when ?!!! Hello Guys
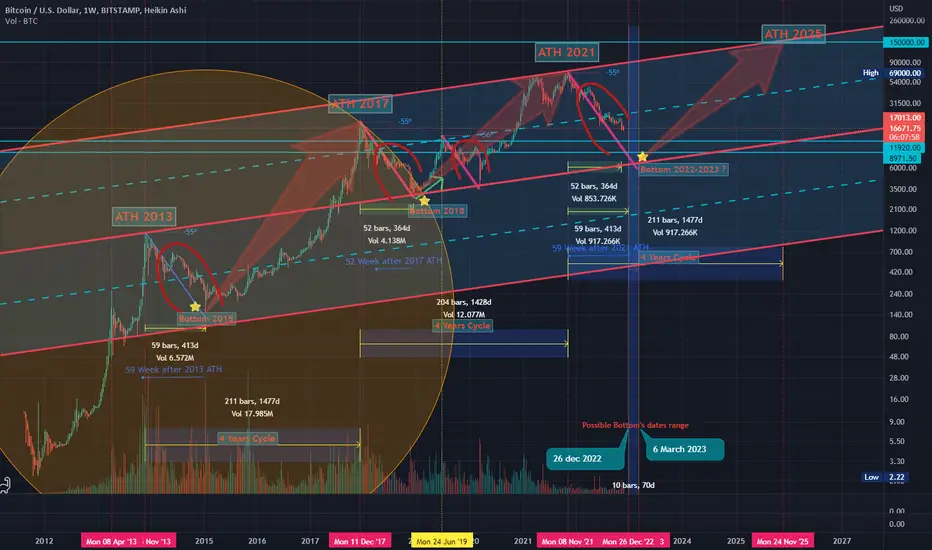
There are some notes of BTC weekly Chart:
1. We have a new ATH every 4 years ( 1428-1477 ) days..
2. After the ATH we take about ( 52-59 ) weeks to make a new bottom then we go up a little ...
3. Every time we reach a new ATH we drop down in a same angle (-55) before the new bull run starting .... look at my chart ( Red angles and curves ):
****** We dropped from ATH 2013 to Bottom 2015 by an angle ( -55 ) .
****** We dropped from ATH 2017 to Bottom 2018 by an angle ( -55 ) .
****** Same (24 July 2019) we dropped from local top to the local bottom by Angle ( -56 ) .
****** Will we drop from ATH 2021 to Bottom (2022 - 2023) by the same angle ( -55 or -56 )??
4. In my opinion , I expect we will reach the final bottom between ( 26 December 2022 : 6 march 2023 ).
5. I don't care what will be the price of BTC then , but I care only for when will be the possible bottom !!.
But if we can try to expect the price it will be in a range of ( 11900 : 9000$) ...
Note:( 10K - 10500$) is very very strong demand area for BTC .
-------------------------------------------------------------------------------------------------------------------------------------------------------------------------------------------------------
Finally , I think the new ATH will not be before Nov 2025 ( 150k $ ).
It is not a financial advice , I am only share my thoughts with u :)
Thank u and good luck.
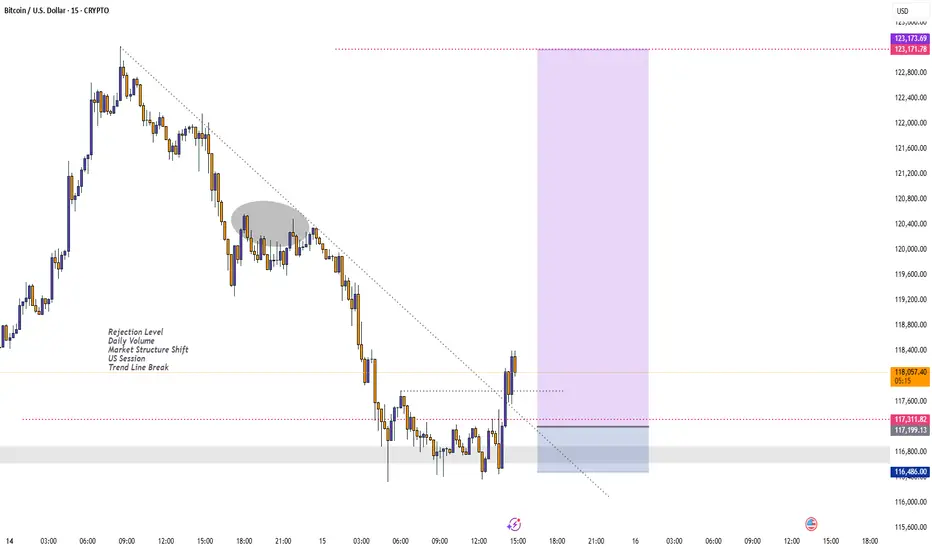
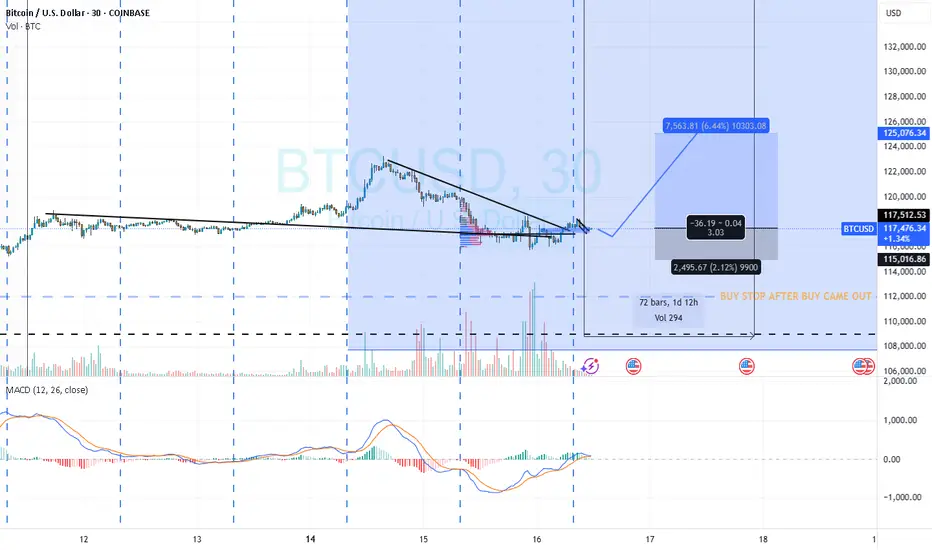
BTC/USD 4H Technical & Fundamental AnalysisBTC/USD 4H Technical & Fundamental Analysis
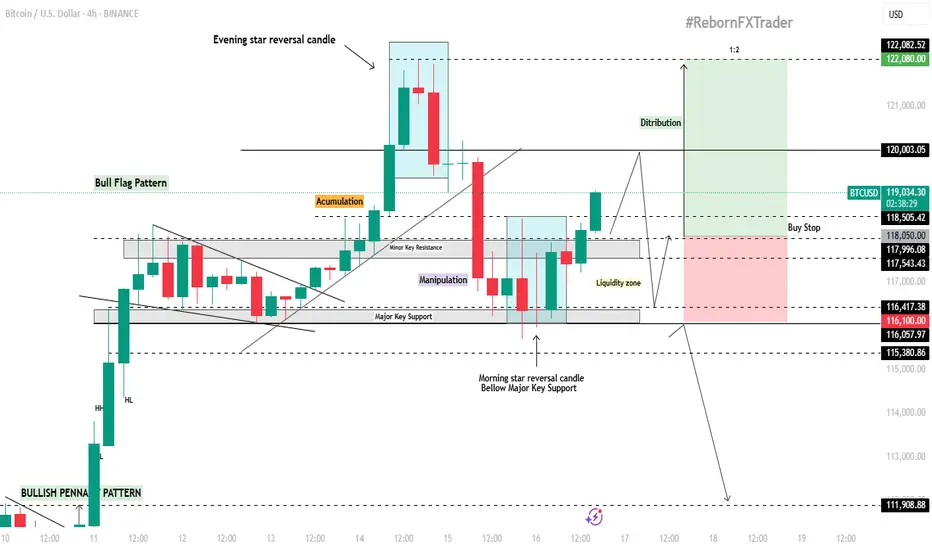
Bitcoin remains fundamentally bullish as institutional adoption continues to rise through Spot ETF inflows, while post-halving supply pressure tightens the available BTC in circulation. Additionally, the upcoming regulatory clarity such as the GENIUS Act could pave the way for major institutions like JPMorgan to issue their own stablecoins, further bridging the gap between crypto and traditional finance. On the technical side, BTC is currently consolidating around the 116,200 level, potentially forming a bull flag pattern on the 4H timeframe. This zone has acted as a major support level due to multiple historical touches.
Previously, price reached an all-time high around 122,000 before forming an Evening Star reversal pattern, leading to a pullback back to the 116,200 zone. A Morning Star reversal then formed on this key support, suggesting renewed bullish momentum.
Our current objective is to wait for price to climb toward the 120,000 level, where we anticipate a potential liquidity grab within the highlighted liquidity zone.
📍Buy Stop Setup:
Buy Stop Entry (AOI): Around 118,050
Stop Loss: 116,100 (below liquidity zone)
Take Profit: 122,080
📌 Disclaimer:
This is not financial advice. Always wait for proper confirmation before executing trades. Manage risk wisely and trade what you see—not what you feel.
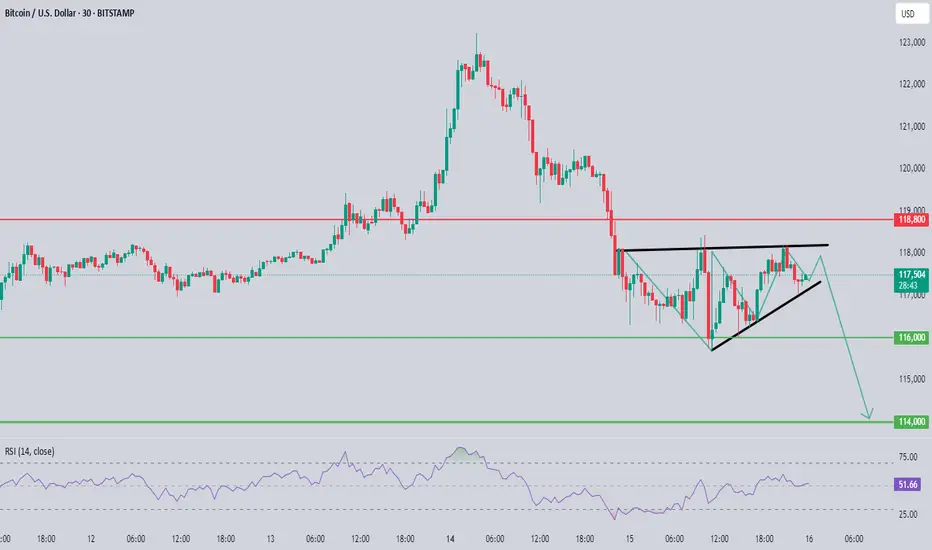
XAU/USD Chart Pattern ObservedBased on the image you've shared, this is a technical analysis chart for gold (XAU/USD), with a visible bearish setup in play. Here’s a detailed sell-side analysis:
Chart Pattern Observed
Bearish Pennant/Wedge Breakout:
The price appears to be breaking out downward from a rising wedge or bearish pennant pattern.
These patterns typically indicate a continuation to the downside after a short consolidation or pullback.
Key Levels Identified
Resistance Zone:
118.800 (Strong resistance level marked in red)
Price failed to break above this and reversed, confirming it as a solid supply zone.
Current Price: Around 117.500
Support Levels (Take Profit Targets):
116.000 – Minor support/first TP level
114.000 – Major support/final TP level (likely the full target of the move)
RSI Indicator
RSI at 50.71 – neutral but pointing slightly downward.
This gives room for further bearish momentum to unfold.
Sell Trade Setup
Entry: After confirmed break below the rising trendline (around 117.800 - 117.500)
Stop Loss: Above 118.800 (just above the resistance zone to avoid fakeouts)
Take Profits:
TP1: 116.000
TP2: 114.000
Trade Justification
Clear lower highs forming.
Rejection at strong resistance.
Breakdown of rising structure = bearish continuation.
Bearish projection arrows on chart suggest institutional outlook favors sell.
Risk Management
Use proper lot sizing based on your account balance and risk %.
Look for a retest of the trendline as a safer sell entry if missed the initial break.
BTC? intra
Hi
Looking ready for next round for upside.
Are you still bullish?
I see yest was accumulation.
If today is a bullish day. Later we'll see prints of 118500 above.
If not.. 116800 is not a good print.
All the best.
Not a guru
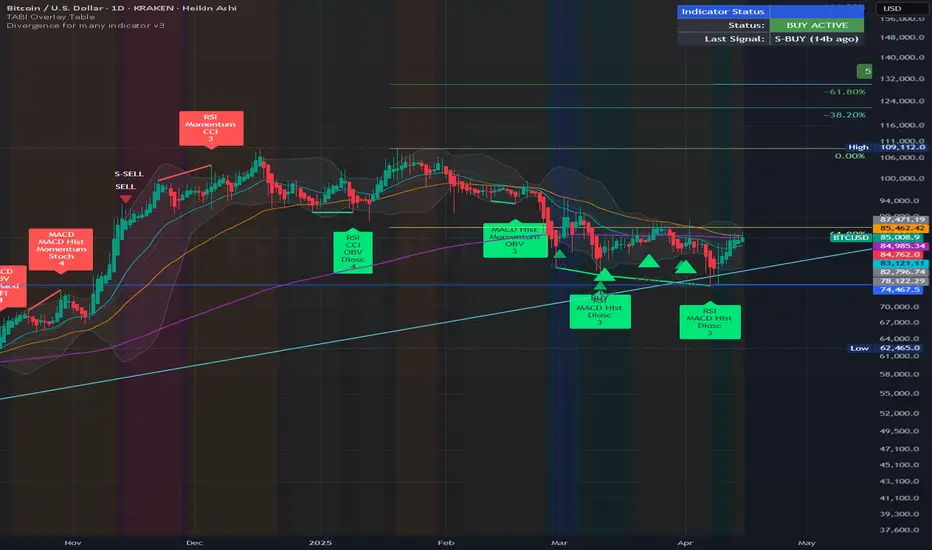
BTC – Strong Buy Signals, Sentiment Reversing, Final Push?BTC is clearly in a place of rising trust
- Fear & Greed Index improving: last week 24 (Extreme Fear), yesterday 31, now 38 (Fear), last month low was 3
- Several bullish divergences visible: RSI and MACD show higher lows vs. price, momentum indicators curling up, OBV ticking higher despite weak price action
- Price is sitting at the lower Bollinger Band and holding an ascending trendline
- Multi-indicator (mostly RSI-based) showing clustered buy signals, similar to previous rallies
- Simple Fibonacci retracement from the recent high (~73K) shows potential move toward 130K, assuming continuation and break above ~109K
- Last S-BUY signal was 14 bars ago, still active
- Structure is clean and holding
- If this is the final leg up, we could be entering danger or euphoria territory soon
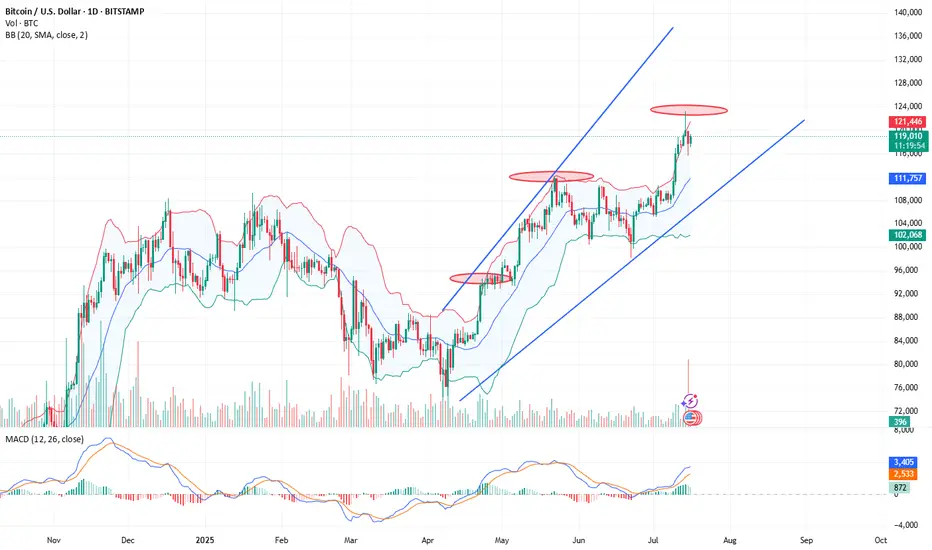
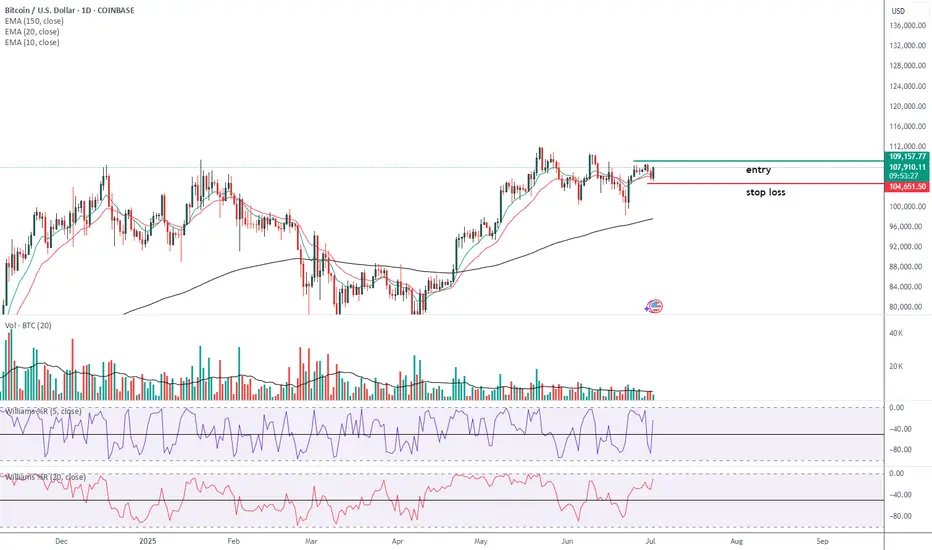
BTC Heading DownThis is my first chart using TradingView. I'm 50/50 on how I feel about it's utility, but it does well enough until I learn it better. I use the D Timeframe too look for support/resistance. I focus in on the 4h, then 1h further. I have recently switched from lower timeframes to higher timeframes with some surprising success following my rules. Constructive Criticism/Dialogue welcomed.
It is time for a reversal. Why? Those ATHs were just hit after two bullish runs for 2025 (Jan and July). Granted it would be hopeful for all investors to keep seeing this beast rip for a 3rd time in 2025, that is a dream, I think. There has been two runs then consolidation/pullbacks, NORMALLY (see hollow boxes on chart). This does not mean this is the case, but this is what I am going with after researching. After the ATH, a lovely wick and an incredibly high volume on an engulfing candle formed. This along with a PSAR switch on the 4H is what I utilize. I have only researched down to $102k. Each TP (blue line), I will be looking for a sign of reversal on the 4h.
Key:
Blue lines:
- My TP
Boxes:
- Areas of Interest
Hollow Boxes only:
- Shows two runs before a consolidation to an official breakout
Highlights:
- What within that area of interest I'm using for justification
Orange lines:
- Where in the past BTC has had breakouts then a retest before the next breakout
Red line:
- My SL
Enjoy your BTC,
AtlasRising
BTC SHORT FOR NOW?An all time high was achieved recently at around 123k USD. A number of buyers should potentially be liquidating their profits around this region, reducing buy pressure and ultimately leading to a short term pull back maybe close to around the 110's? Price action will have to reveal more information in order to see what happens after this movement.
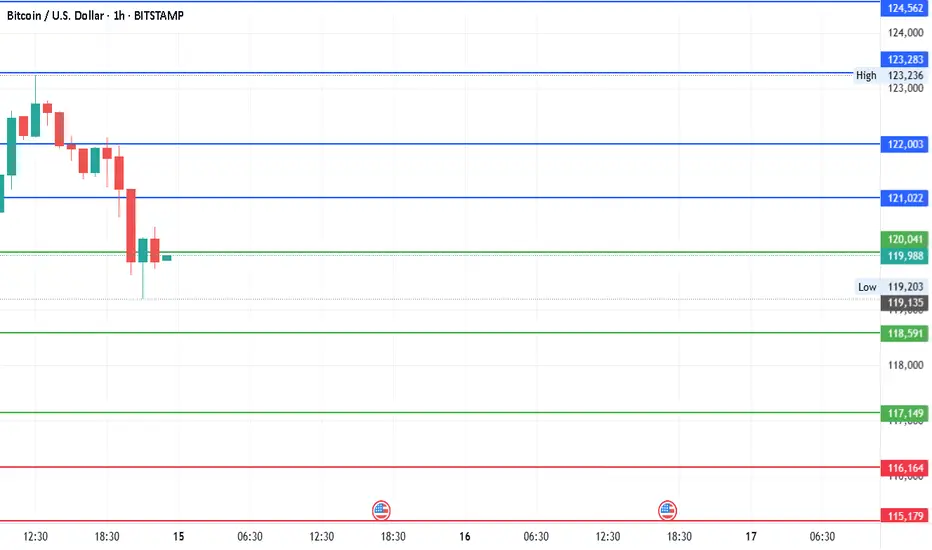
#Bitcoin - Levels to watchDate: 14-07-2025
#Bitcoin
Current Price: 119900
Pivot Point: 118591.00 Support: 117149.31 Resistance: 120041.22
Upside Targets:
Target 1: 121022.11
Target 2: 122003.00
Target 3: 123282.50
Target 4: 124562.00
Downside Targets:
Target 1: 116164.16
Target 2: 115179.00
Target 3: 113899.50
Target 4: 112620.00
#Crypto #Bitcoin #BTC #CryptoTA #TradingView #PivotPoints #SupportResistance
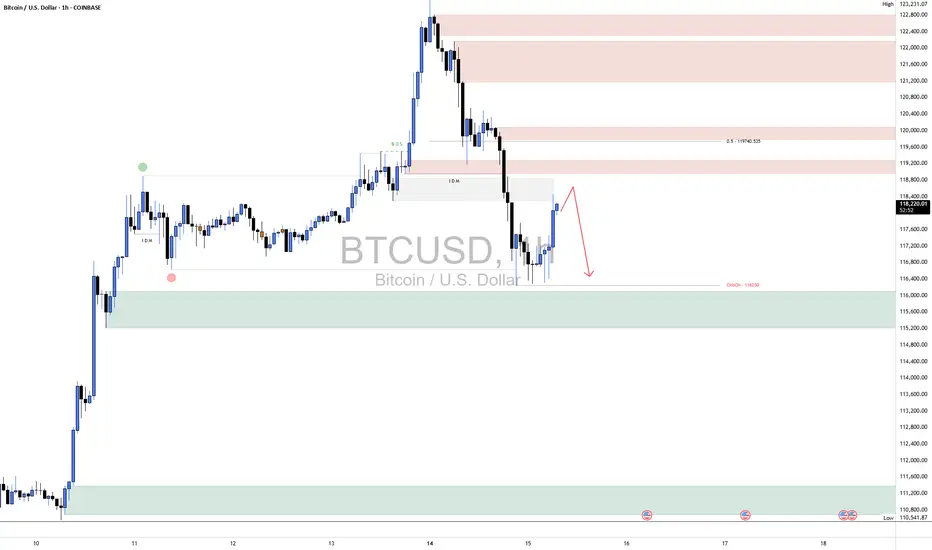
BTC ShortBTC has shown some short-term bullish signs, with a corrective bounce from the demand zone around 116,000–115,000, indicating a temporary reaction from buyers. However, this move appears to be a retracement rather than a full reversal, as the overall structure remains bearish.
Price is currently pushing into a previously broken intraday supply zone and approaching the 50% equilibrium level near 119,000, which aligns with a potential lower high forming. As long as BTC stays below this key level and fails to break market structure to the upside, the bias remains bearish.
We still believe BTC is likely to come back down to retest the recent lows, possibly revisiting the 116,000 zone to sweep more liquidity before any meaningful reversal can occur.
As always, proper risk management is essential. Wait for confirmation before entering trades and protect your capital in these volatile conditions.
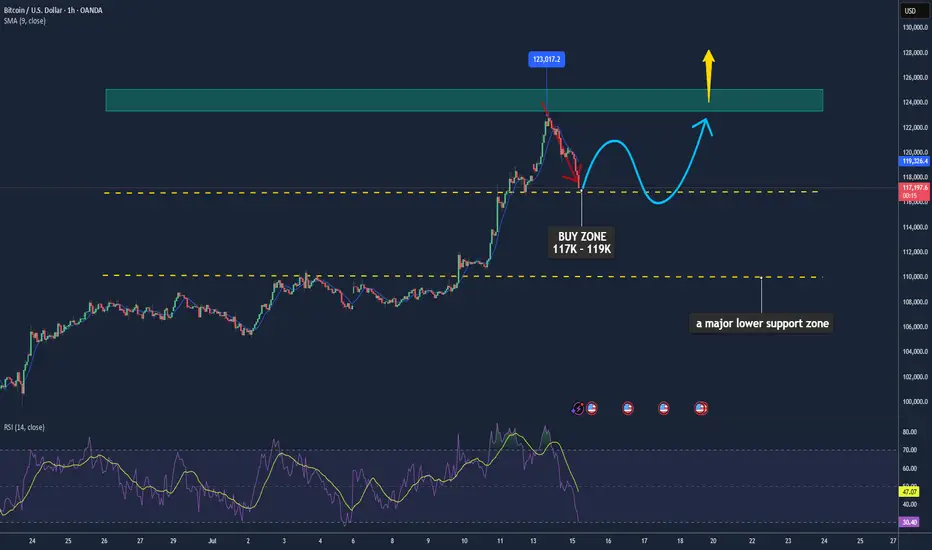
Bitcoin May Pause After Recent Highs📊 Market Move:
Bitcoin (BTC) recently touched an intraday high of ~$122.8K after hitting new all-time highs, supported by a weaker USD, strong institutional inflows, and favorable U.S. regulatory developments (e.g., GENIUS Stablecoin Act, CLARITY Act, and Trump’s executive orders). However, rising volatility (DVOL) and a rebounding USD are signaling a possible short-term correction.
📉 Technical Analysis:
• Key Resistance: ~$123K–$125K
• Nearest Support: ~$117K (with $110K as a major lower support zone)
• EMA: Price is currently above the 9-day EMA → short-term trend remains bullish.
• Candlestick / Volume / Momentum:
• A cup-and-handle formation has emerged, typically a bullish continuation pattern, suggesting a possible 14% rally to ~$134.5K.
• Momentum is still strong; RSI is elevated but not yet overbought (14-day stochastic RSI at ~79.4%).
📌 Outlook:
Bitcoin may consolidate or experience a mild pullback in the short term around the $123K level, especially if the USD continues to strengthen or volatility spikes. However, a clean breakout above $125K could trigger a further rally toward the $134K–$146K range.
💡 Suggested Trading Strategy: (Spot only – no leverage)
🔻 SELL Bitcoin/USD at: $123K–125K
🎯 TP: $117K
❌ SL: $126.5K
🔺 BUY Bitcoin/USD at: $117K–119K
🎯 TP: $123K–125K
❌ SL: $115K
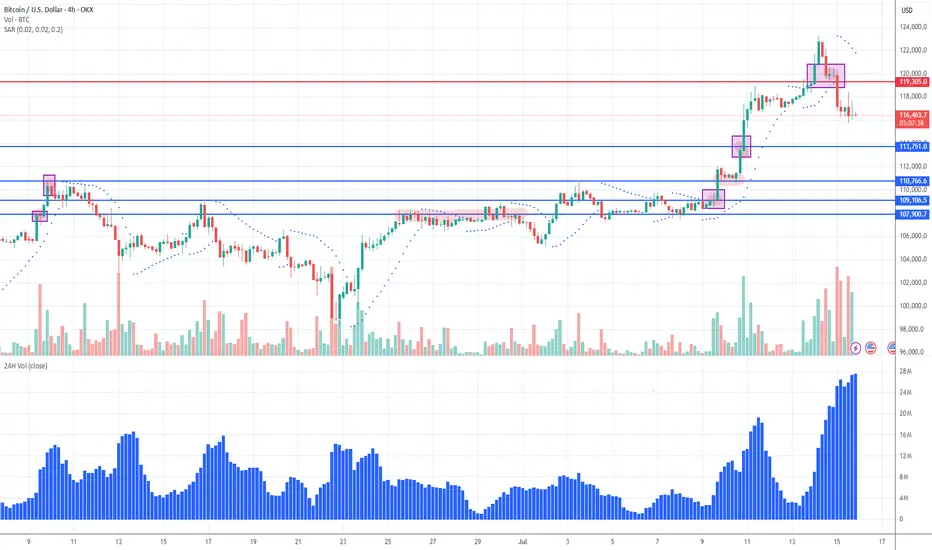
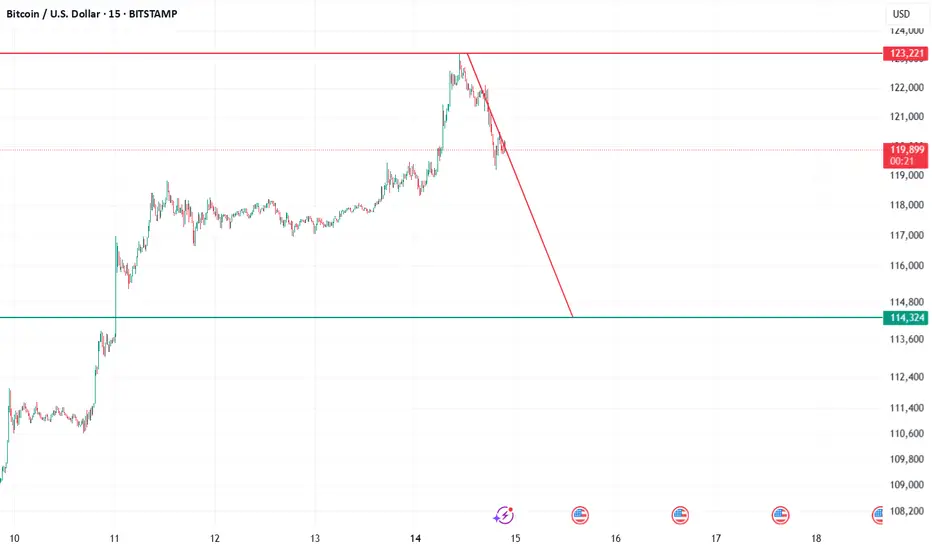
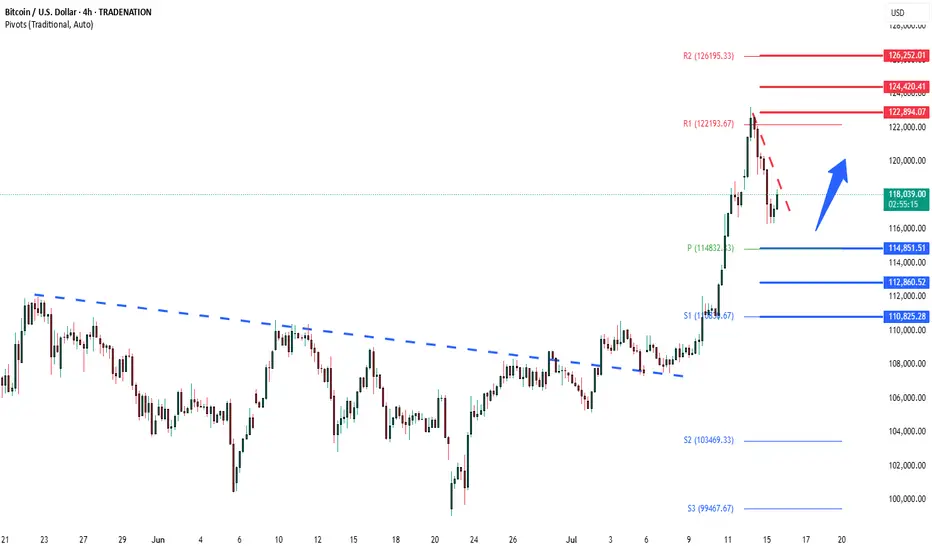
BTCUSD overbought correction supported at 114,850The BTCUSD remains in a bullish trend, with recent price action showing signs of a corrective pullback within the broader uptrend.
Support Zone: 114,850 – a key level from previous consolidation. Price is currently testing or approaching this level.
A bullish rebound from 114,850 would confirm ongoing upside momentum, with potential targets at:
122,900 – initial resistance
124,420 – psychological and structural level
126,250 – extended resistance on the longer-term chart
Bearish Scenario:
A confirmed break and daily close below 114,850 would weaken the bullish outlook and suggest deeper downside risk toward:
112,860 – minor support
110,825 – stronger support and potential demand zone
Outlook:
Bullish bias remains intact while the BTCUSD holds above 114,850. A sustained break below this level could shift momentum to the downside in the short term.
This communication is for informational purposes only and should not be viewed as any form of recommendation as to a particular course of action or as investment advice. It is not intended as an offer or solicitation for the purchase or sale of any financial instrument or as an official confirmation of any transaction. Opinions, estimates and assumptions expressed herein are made as of the date of this communication and are subject to change without notice. This communication has been prepared based upon information, including market prices, data and other information, believed to be reliable; however, Trade Nation does not warrant its completeness or accuracy. All market prices and market data contained in or attached to this communication are indicative and subject to change without notice.
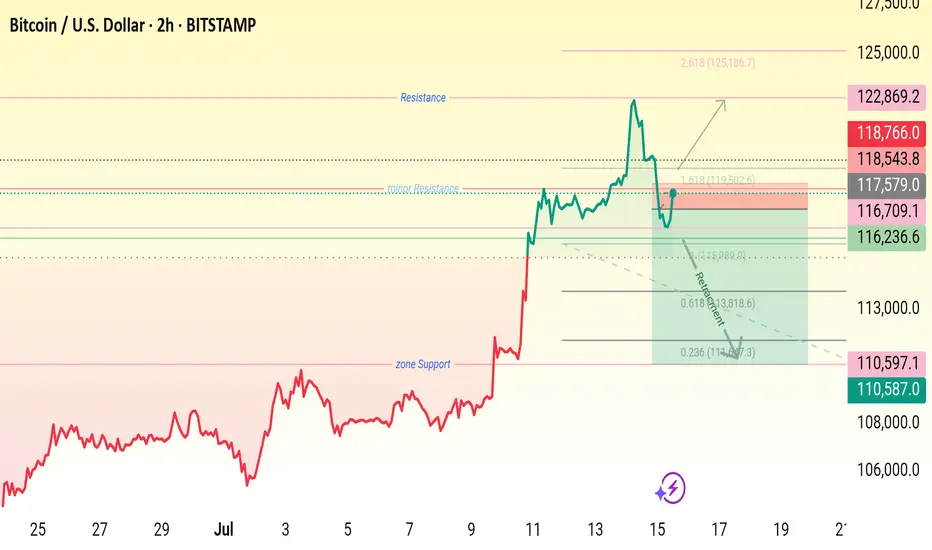
Btc key levels,
Wait for price rejection .
•Entry Zone: 115,900 – 116,700
• Stop Loss: Below 110,587
🎯 Target 1: 118,543
🎯 Target 2: 122,869
• Extension Target: 125,186 (1.618 Fib)