BTCUSD • 1H ABCD Completion at Key Confluence – Long Bias1) Macro → Micro Context
Daily / 4H Trend:
Still a clear up-trend on the daily & 4-hour: higher highs / higher lows above the 8, 34 & 55 EMA ribbon.
The $120 K–$121 K zone houses the largest Volume-by-Price node in two weeks, now acting as near-term support.
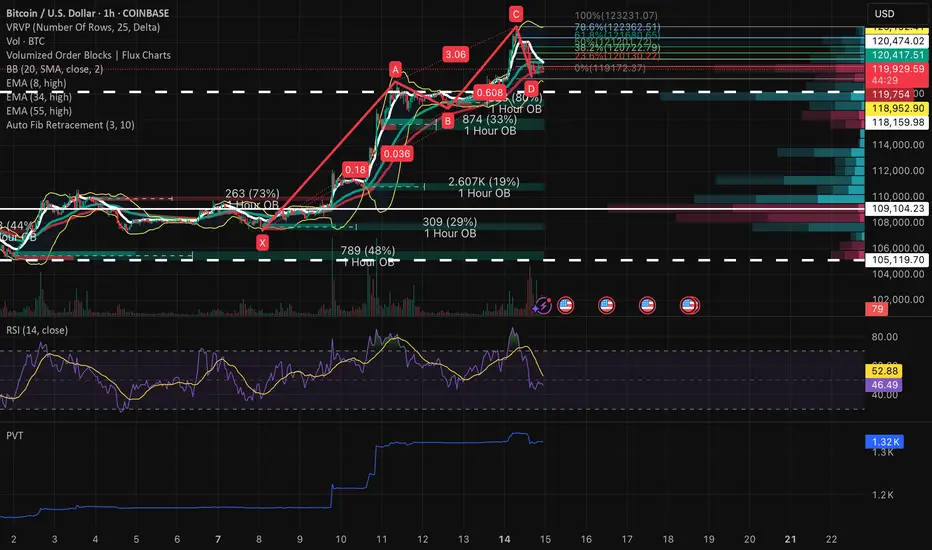
1H Context:
X→A: $106 100 → $118 950 impulsive run
A→B: ~15% pullback into $117 000 (≈0.15 XA)
B→C: 3.06× extension to $123 230
C→D: Retrace into $119 900–$120 300, matching 0.618 BC & ~80% XC Fib
2) Structural & Momentum Breakdown
AB=CD & Fib Confluence: D at $119 900–$120 300 aligns perfectly with both 0.618 BC and ~80% XC retracements.
1H Bullish Order Block: $119 900→$119 750
20-period SMA (mid-BB): ≃$120 100
VRVP High-Volume Node: Centered ≃$120 400
RSI (14): Holding 47–50 on the hour, flattening and poised to curl up
PVT: Flat-to-up on the pullback—sign of absorption
Volume: Contracts into D, then a slight uptick on the last 1 h bar
3) Exact Trade Plan
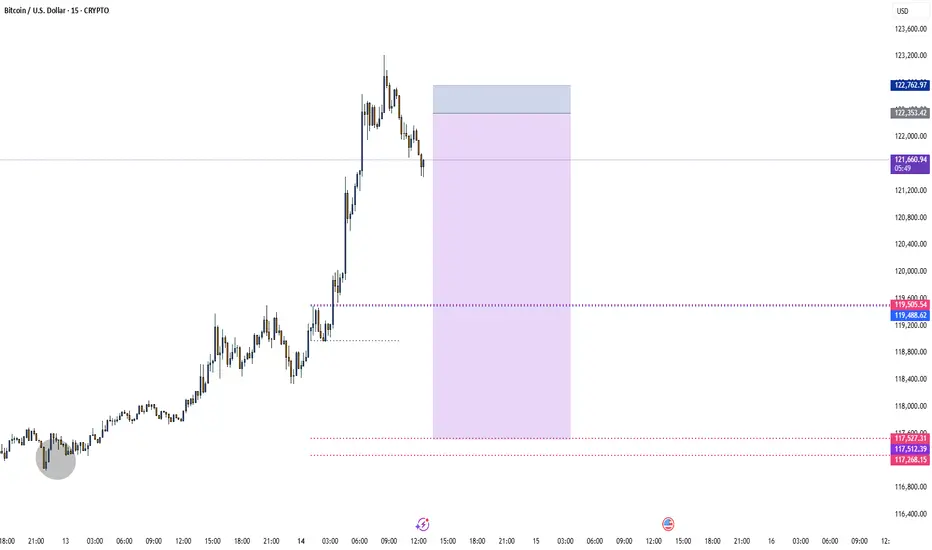
Entry: $119 400 - $120 300
Stop-Loss: $117 300 - $118 000
Take-Profit 1: $121 800 → $122 200
Take-Profit 2: $123 000 → $123 500
Optional “Hype” TP instead of TP 2: $125 000 → $126 500
(for a parabolic push if the upcoming House vote prints strong headlines — targets at 78.6%–100% BC extensions)
Entry Confirmation (any one):
1 h bullish engulfing or inside bar within entry zone
RSI (14) closes back above 50 on the hourly
PVT prints a higher low with renewed buy-side volume
BTCUSD.PM trade ideas
BTC: Swimming with sharks!BTC: Swimming with sharks!
.
Wait for a shakeout, and join the plan.
The target is still up ahead!
.
US STOCKS- WALL STREET DREAM- LET'S THE MARKET SPEAK!
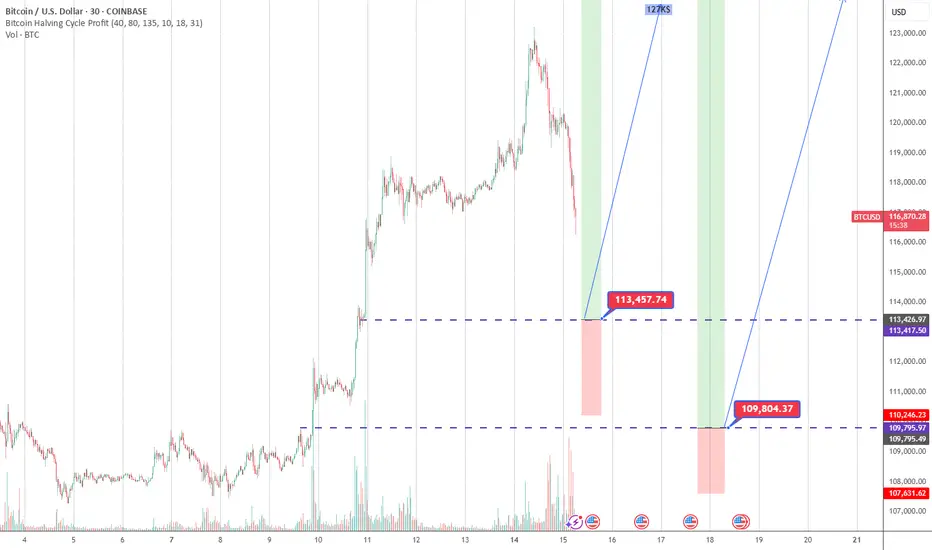
BTCUSD🚨 BITCOIN IS ABOUT TO TAKE OFF AGAIN – DON’T MISS IT! 🚀
We’re seeing a healthy pullback in play – exactly the kind of mean reversion smart money watches for. BTC is currently retracing to test the standard deviation from the 200 EMA on the 30-minute chart ⏱️📉
🔍 There are two key demand zones setting up as high-probability buy areas:
1️⃣ Zone 1 – First reaction level: ideal for aggressive entries if momentum picks up.
2️⃣ Zone 2 – Deeper support: strong confluence with fibs + previous liquidity sweep. A goldmine for patient bulls. 💰
This isn’t just another dip – it’s a technical setup with potential for explosive upside. 📊
Stay sharp. Stay ready. BTC doesn’t wait. ⚡
#Bitcoin #BTC #CryptoTrading #BuyTheDip #EMA200 #TechnicalAnalysis #CryptoAlerts 🔥
Analysis of the possibility of a high point before a pullbackAnalysis of the possibility of a high point before a pullback
The upper boundary pressure of the local rising range, the whole rising callback is half broken through the rising range and continued to fall, the overall sideways trend
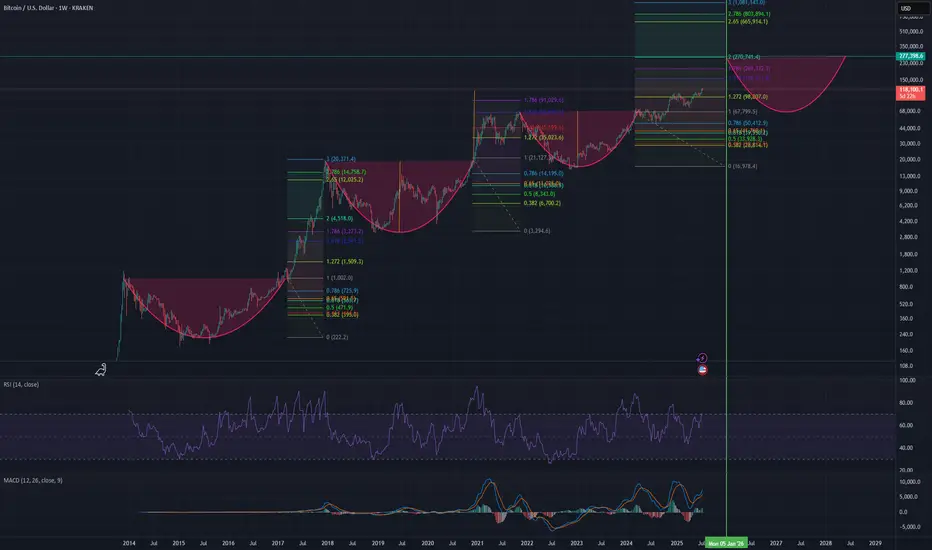
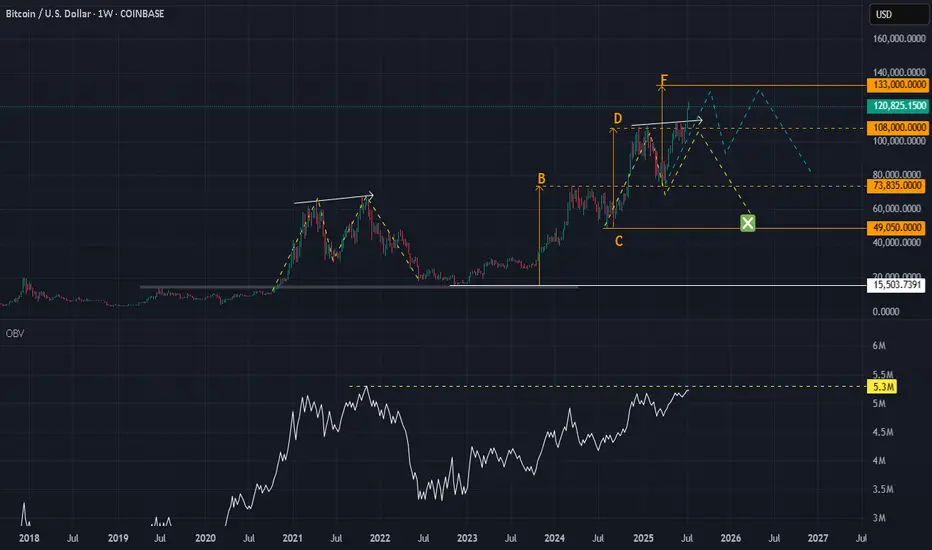
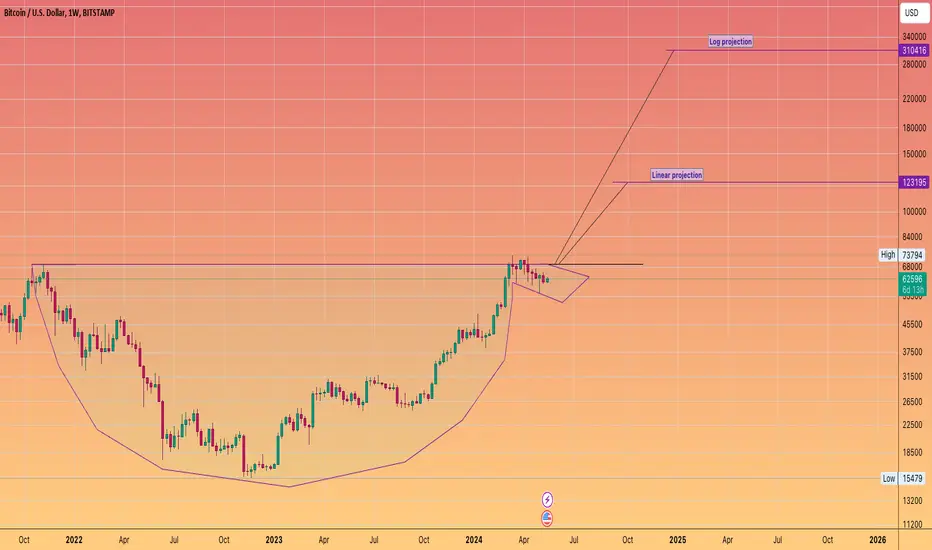
Bitcoin Cycle PredictionThis "Bitcoin Cycle Prediction" chart utilizes a long-term logarithmic view of BTC/USD price action on a weekly timeframe (1W) via Kraken exchange data, highlighting the cyclical nature of Bitcoin's market behavior across past, present, and projected future cycles.
Key features include:
Parabolic Growth Curves: Three completed macro cycles and a fourth projected cycle are visualized with rounded cup-like formations, indicating historical accumulation phases followed by exponential bull runs.
Fibonacci Retracement & Extension Levels: Each major bull run is annotated with Fibonacci retracement and extension zones, helping identify historical resistance and support levels, as well as potential future price targets. Extensions like 1.618, 2.618, and 3.0 are used to forecast upper bounds.
RSI (Relative Strength Index) : Positioned at the bottom, the RSI gives insight into historical overbought and oversold conditions, aligning well with the cycle peaks and troughs.
MACD (Moving Average Convergence Divergence): MACD crossovers and histogram movements reinforce the timing of bullish and bearish phases within each cycle.
Cycle Timing Marker: The vertical green line marks a projected inflection point around January 2026, suggesting the anticipated peak of the next bull cycle based on previous timing patterns.
Price Targets: Based on previous Fibonacci multiples, projected price targets for the upcoming cycle could reach extensions between $195,000 and $665,000+, if historical behavior repeats.
This chart is a speculative but historically informed visualization designed for educational and analytical purposes, offering long-term investors and cycle theorists a structured look at Bitcoin's repeating macro trends.
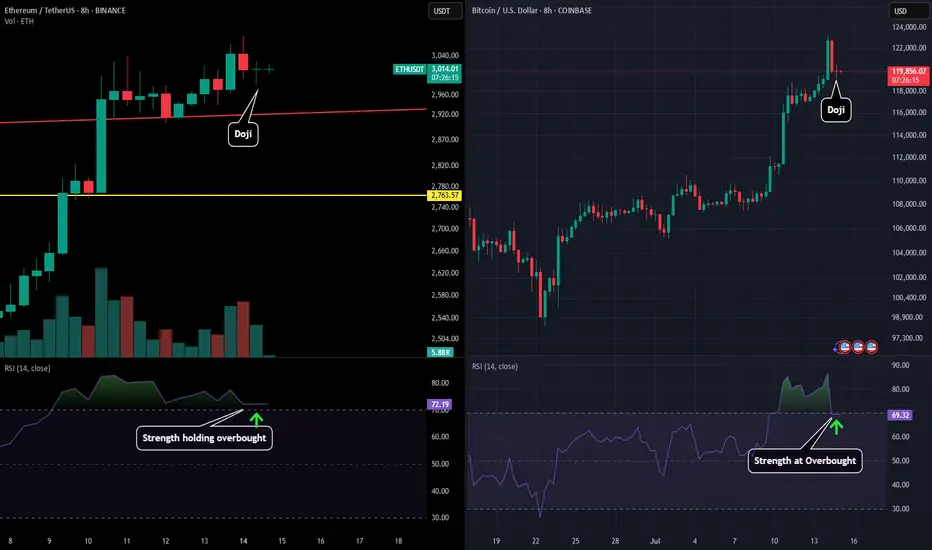
BTC & ETH - 8H Important DevelopmentWe have seen a very important development on the 8H chart for both BTC and ETH.
Both assets after seeing a selloff through the day then found some LTF support and ending up printing reversal dojis on the 8H.
Apart from the doji printing both assets are at extremely important levels for the RSI.
ETH is slight above overbought conditions meaning if we can see price start to go back up here the strength should get stronger which could help push price past the $3,100 level and towards that $3,400 level.
BTC is right at the 70 level. Therefore if price and push up here then the strength should follow and show a perfect test of overbought conditions as the support level. But if BTC price fails to maintain the strength, a dip below overbought conditions could send us further down towards the $112,000-$116,000 levels depending on how strength looks at that time. The would also coincide with a perfect retest, but the most important indicator in the short term will see how price reacts to this over the next 8 hours.
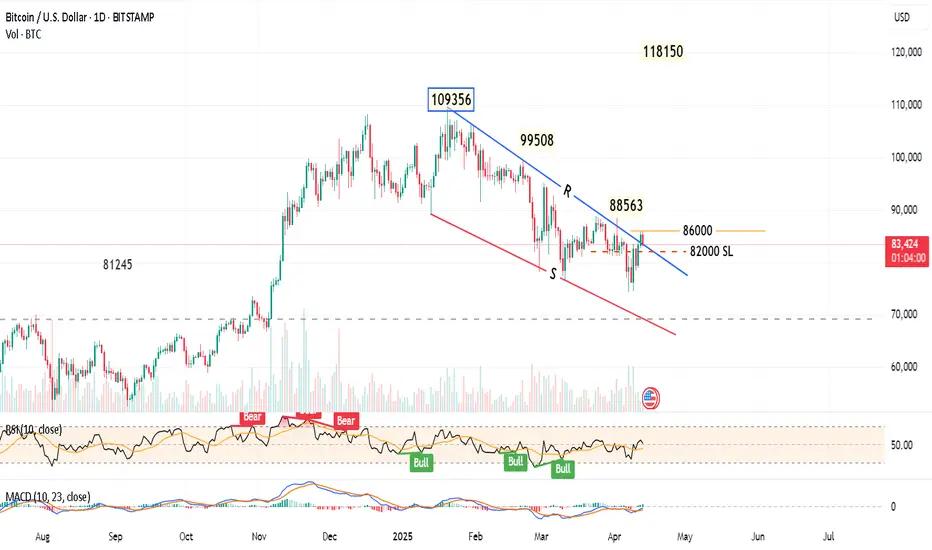
Bitcoin Towards $118KDaily chart,
The Bitcoin BITSTAMP:BTCUSD has just formed a falling wedge pattern, down from the highest High 109356.
Some consolidation may happen in the range 86000 to 82000.
Closing above 86000 for 2 days will give a strong buy signal for a bullish movement, and the target will be 118150 passing through the shown resistance levels.
Consider the Stop Loss below 82000
Note: Always place a near profit protection level, as the BTC is volatile.
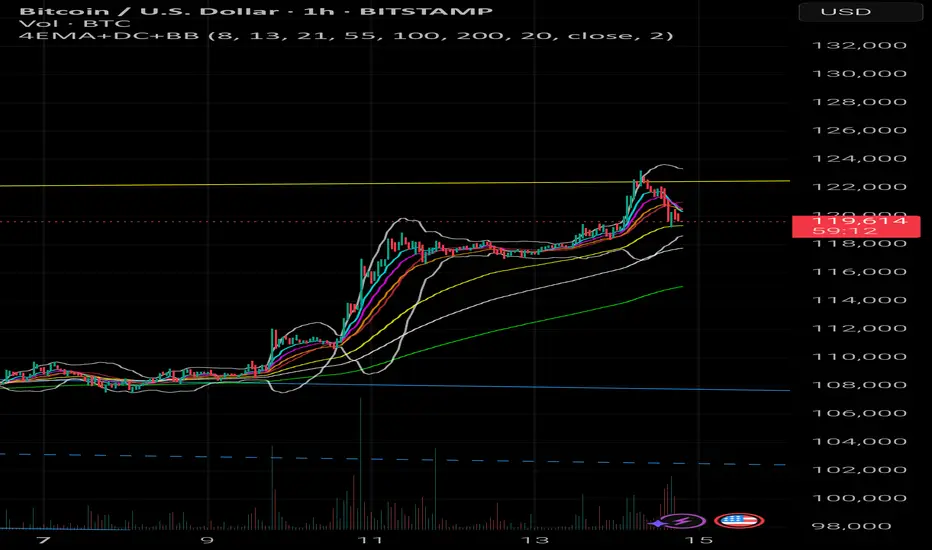
Major Flag Breakout Meets Multi-Year Resistance – What’s Next?After breaking out of the large flag pattern that had been forming on the daily chart, Bitcoin pushed upward with conviction — fueled by a clean 4-hour impulse move. This move carried price directly into a major resistance zone that has held for the past 7–8 years.
I was initially skeptical of a full continuation here, given the historic strength of this zone. But observing how price behaved — especially the smooth structural advance, EMA alignment, and volume absorption — I’ve revised my bias.
We’ve seen liquidity swept from the downside, and price continues to find support in every micro-dip. Given the compression and resilience at these levels, I now expect the market to push further.
Key zone to watch: If we reclaim the midrange after this consolidation, a clean extension beyond the resistance becomes increasingly likely.
Caution: This is not a blind long — entries must be placed with discipline, especially as we test macro resistance.
#BTC #PriceAction #TradingView #CryptoAnalysis #Breakout
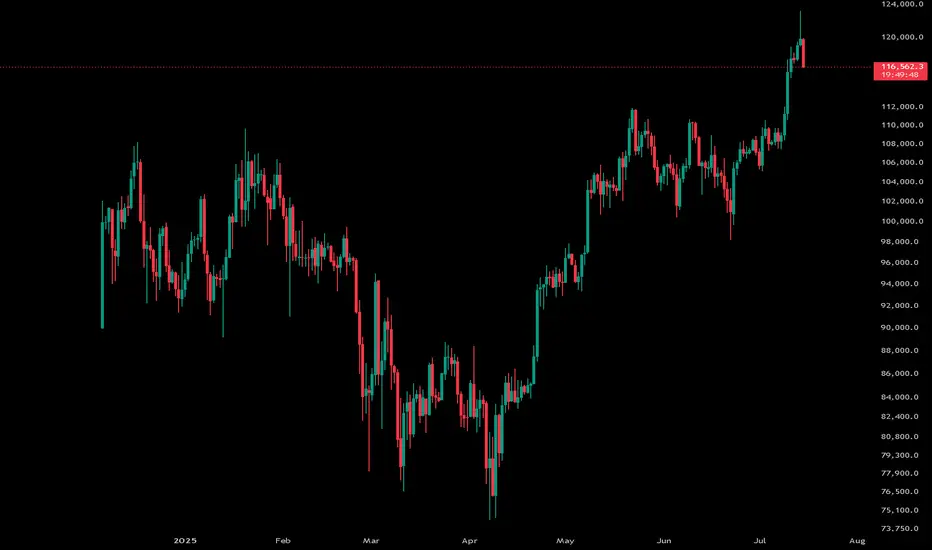
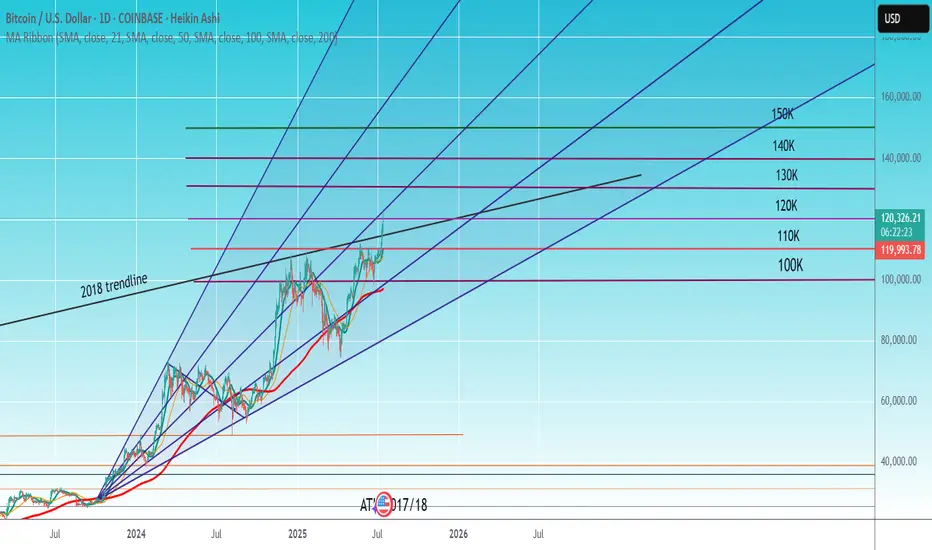
BTC price discoveryBroke the 2018 ATH Trendline. I won't day trade BTC, just gives me a feel on alts and crypto stocks.
BTCUSDBTCUSD is currently trading at 120,246, presenting a favorable buy zone near the current price.
The first resistance level lies at 123,352, where price may face initial selling pressure.
The second resistance is stronger at 125,857, indicating a more significant hurdle for upward momentum.
A confirmation of bullish strength will be established if BTCUSD breaks and holds above 126,857.
Traders can consider entering long positions around 120,000–120,300, aligning with the current market level.
To manage risk, a stop-loss should be placed just below the key support at 117,988.

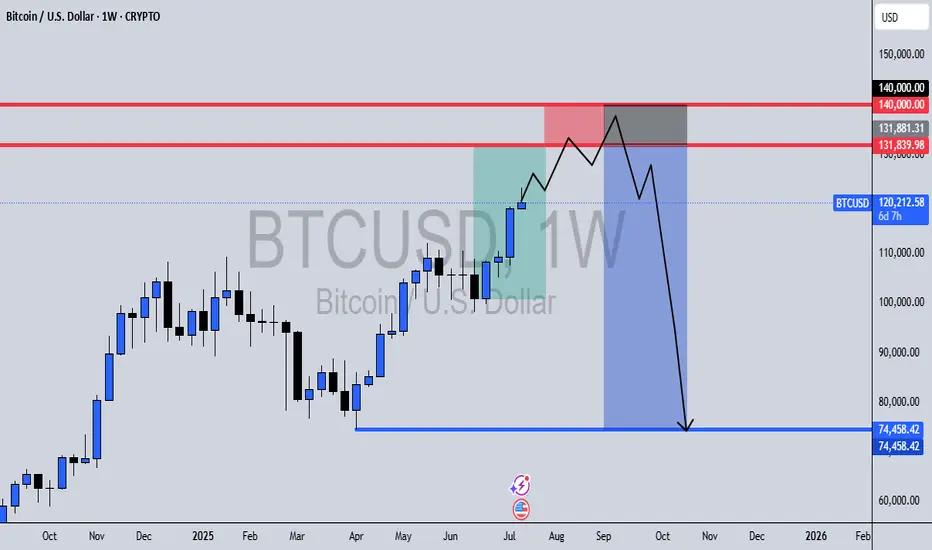
BTCUSD Weekly Outlook📅 Date: July 14, 2025
📍 Timeframe: 1W (Weekly)
🔍 Key Zones:
🔴 $131,839 – $140,000: Major liquidity pool & reversal zone
🔵 $74,458: External range liquidity target
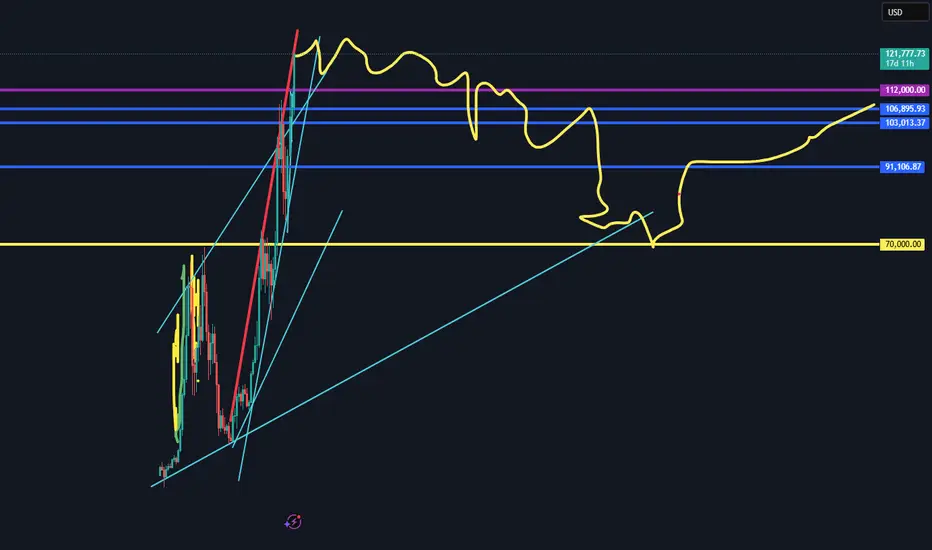
Bitcoin has been pushing higher week after week, but this setup hints at a trap for late bulls.
Here’s what I’m watching:
Reversal Zone Between $131K – $140K
Price is approaching a critical area packed with buy-side liquidity, where I anticipate a liquidity sweep followed by a shift in market structure. This area also aligns with previous highs and psychological resistance.
Liquidity Sweep & Break of Structure
Once price sweeps the highs and takes out weak hands, I expect a bearish breaker block to form as the reversal confirms. This will be the key signal for a move down.
Targeting External Range Liquidity at $74K
The sharp decline afterward is expected to reach the external range liquidity around $74,458, taking out long-term resting liquidity. This aligns with clean inefficiencies and unmitigated imbalances on the chart.
🔔 Conclusion:
While the short-term bias may remain bullish into the red zone, I’m prepping for a high-probability swing short after signs of exhaustion and confirmation at the top. This is a classic smart money play—liquidity grab, breaker, and redistribution.
📌 Set alerts around $131K – $140K and monitor for structure breaks and bearish rejections.
BTC POTENTIAL PULL BACK ????Will Bitcoin continue going higher or will it crash a bit? Its something we have to wait and see. We have to be ready and prepared for what it wants to do!!!
Here is my technical analysis, but may the Lord lead you as you trade and invest. May you allow Him to show you where to cast your nets!!! (John 21:6 KJV)

It is over moonboysMajor correction on the way. I saw many billboards in my country this week for buying Bitcoin. Strong sell signal. It is happening. Bog boys needs liquidity for selling.

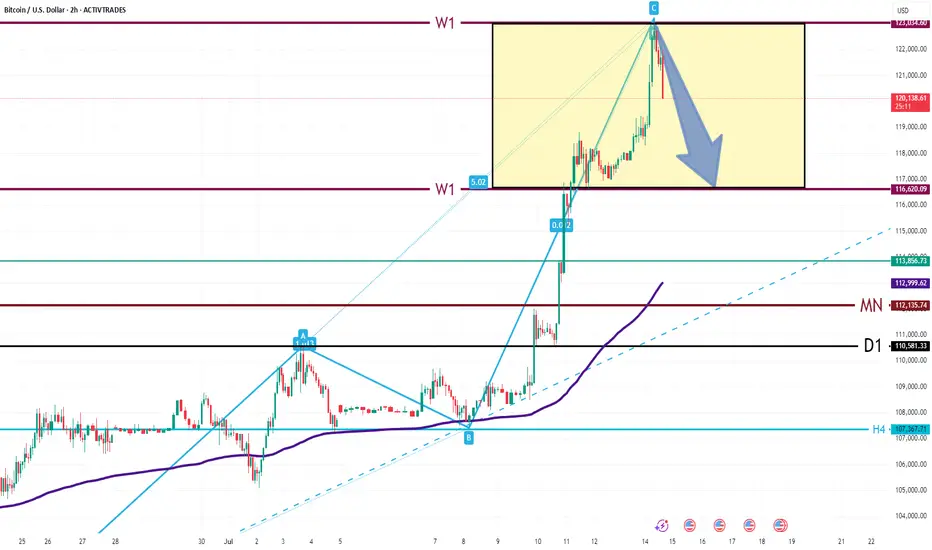
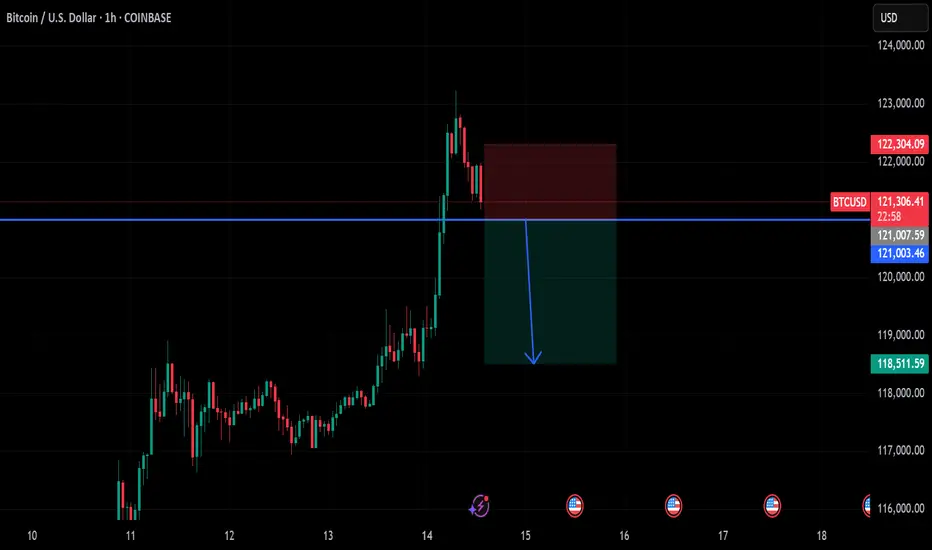
BTC/USD: Rejection from 123,000 Triggers Correction Market Overview:
Bitcoin surged to the 123,000 resistance zone, completing a potential ABC bullish pattern. The price has since pulled back sharply, indicating the start of a correction. Current price action suggests consolidation within the 116,600 – 123,000 range, as traders lock in profits and reassess direction.
Technical Signals & Formations:
— ABC bullish pattern completed at the top
— Strong weekly resistance at 123,000
— Horizontal support at 116,600 acting as key pivot
— EMA(144) far below, suggesting room for deeper correction if weakness persists
Key Levels:
Resistance: 123,000, 126,000
Support: 116,600, 113,800, 113,000, 110,580
Scenario:
Primary: continued pullback toward 116,600. A breakdown below this level may lead to further downside targeting 113,800–113,000.
Alternative: stabilization within the range, followed by a rebound and potential retest of 123,000.
BTCUSD : b-e-c-a-r-e-f-u-lMaybe price is just trying to buy back what was sold previously.
Of course, now at a higher price.
By the look of it, there isn't any new 'supply'.
Do you think price can move higher if there is NO supply - no one 'selling'?
Good luck.
Bitcoin Ascends into the Clear Sky: Structural Break Confirmed.⊣
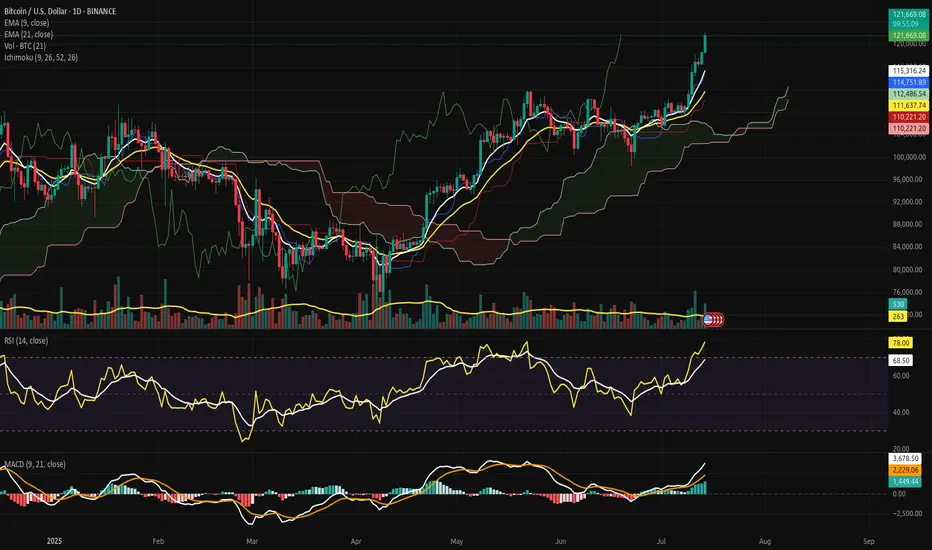
⟁ BTC/USD - BINANCE - (CHART: 1D) - (Jul 14, 2025).
◇ Analysis Price: $121,662.29.
⊣
⨀ I. Temporal Axis - Strategic Interval - (1D):
▦ EMA9 - ($115,313.08):
∴ The EMA9 is aggressively sloped upward, serving as dynamic support during the latest expansion phase.
✴️ Conclusion: Bullish control confirmed; momentum is guided tightly by the EMA9 anchor.
⊣
▦ EMA21 - ($111,636.30):
∴ EMA21 remains positively inclined, acting as a structural trend base beneath price and volume clusters.
✴️ Conclusion: Market remains structurally sound as long as price stays above the 21-day mean.
⊣
▦ Volume + EMA21 - (Volume: 497.79 BTC - EMA21: 262 BTC):
∴ Volume surge surpasses the rolling average, confirming institutional participation and breakout legitimacy.
✴️ Conclusion: Volume expansion validates price movement - no signs of divergence or exhaustion detected.
⊣
▦ RSI + EMA9 - (RSI: 77.99 - EMA9: 68.49):
∴ RSI has entered overbought territory, yet its trajectory remains upward and wide above its smoothing band.
✴️ Conclusion: Bullish momentum sustained; overbought conditions not yet reversing.
⊣
▦ MACD - (9, 21, 9) + EMA's smoothing:
∴ MACD: 3,271.60 | Signal: 2,013.81 | Divergence: +1,257.79;
∴ The MACD line is expanding positively over its signal, confirming momentum acceleration.
✴️ Conclusion: Technical conviction favors bullish continuation; signal remains clean and unsaturated.
⊣
▦ Ichimoku Cloud - (9, 26, 52, 26):
∴ Price is decisively above the Kumo cloud - “Clear Sky” territory;
∴ Senkou Span A = 121,653.30 | Senkou Span B = 112,486.54;
∴ Tenkan and Kijun lines are sharply elevated, confirming trend authority.
✴️ Conclusion: Zero resistance above; cloud projection supports further upward development.
⊣
🜎 Strategic Insight - Technical Oracle:
∴ All indicators are aligned in a rare harmonic convergence, signaling trend expansion with no current topping structure;
∴ Market shows the behavior of an advanced impulse wave entering Phase II expansion;
∴ Strategic play remains bullish - pullbacks, if any, should be shallow and fast.
⊣
𓂀 Stoic-Structural Interpretation:
∴ Structurally Bullish – Tactically Advancing
⊢
⧉
Cryptorvm Dominvs · ⚜️ MAGISTER ARCANVM ⚜️ · Vox Primordialis
⌬ - Wisdom begins in silence. Precision unfolds in strategy - ⌬
⧉
⊢
btc on sell below 121k#BTCUSD price now on reverse, expected entry below 121k on H1 closure.
Target 118500, Stop loss 122300. First short TP at 120500 for possible reverse on buy.
Bullish can take place if the H1 doesn't close below the sell entry, any breakout above 123k again will reach 125k.
BTC TOP AND BEARISH AND CONTUNITY PREDICTION This chart is purely based on technical analysis. The RSI is still not oversold on the monthly chart, which means there might be a little more upside to this. But from the trendline, a serious reversal appears due. I could be wrong, but we'll all see. Profit taking may commence bit by bit.
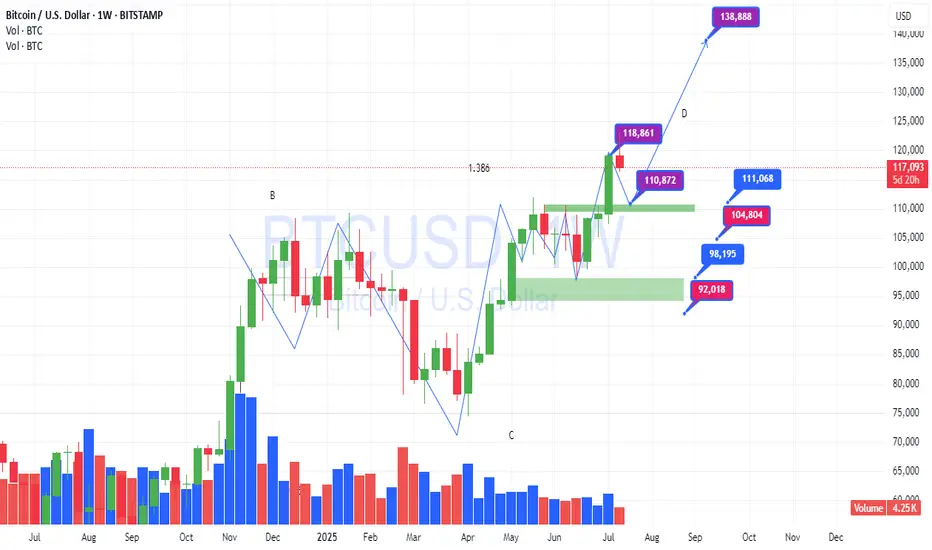
$BTC - Bitcoin Elliot Wave Analysis UpdateHello fellow gamblers,
Bitcoin hit my target zone and we could now see a retracement for Wave 4 or a bullish continuation into ATH.
I am also bringing a new update on Bitcoin and showing you all an alternative count that could take us way above our current targets.
- If we do have a Wave 4 retracement, I'm expecting price to find support at that 116.7k level.
- Levels to watch: 116.7k, 112k-110.4k

Balla is still Bullish on BITCOIN. Cup & Handle pattern. The trend is still our friend.
I still see bullish developments in the price action.
We must have patience.
Dips still must be bought.
The plan hasn't changed.
We still aiming for that time period of 9 -15 months post #BTC Halving.
We are only one month down :)
SellTrend Line Break
Previous Day Volume
Rejection Point
Untapped Order Point
London Session
High Structure Swing
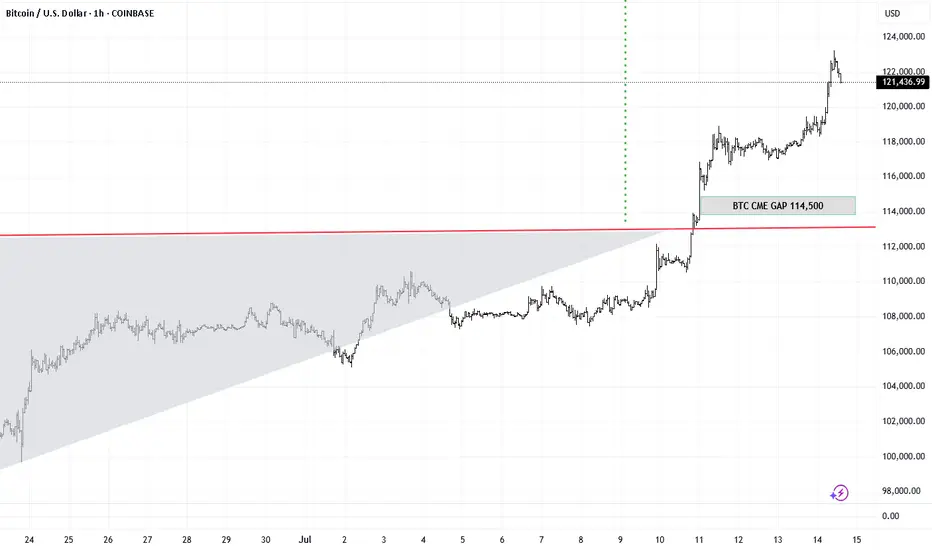
BTC CME Bearish GAPA gap to be filled in the Bitcoin CME Future at 114,000
Break of 120500 will open the door for 118,000 then 114,000 next.
I reckon buyers will pop-in near 114,000
Rally! : My Target in Sight, and It’s Only a Matter of TimeInverted Head&Shouldres -- Breakout -- Double top -- Retest Neckline -- BOOM !!
