BTCUSD: BTC at ATH. Time to celebrate? Hmmmm.....7/11/2025Good day, Guys.
I'm back for a little update for Cryptos
Bitcoin
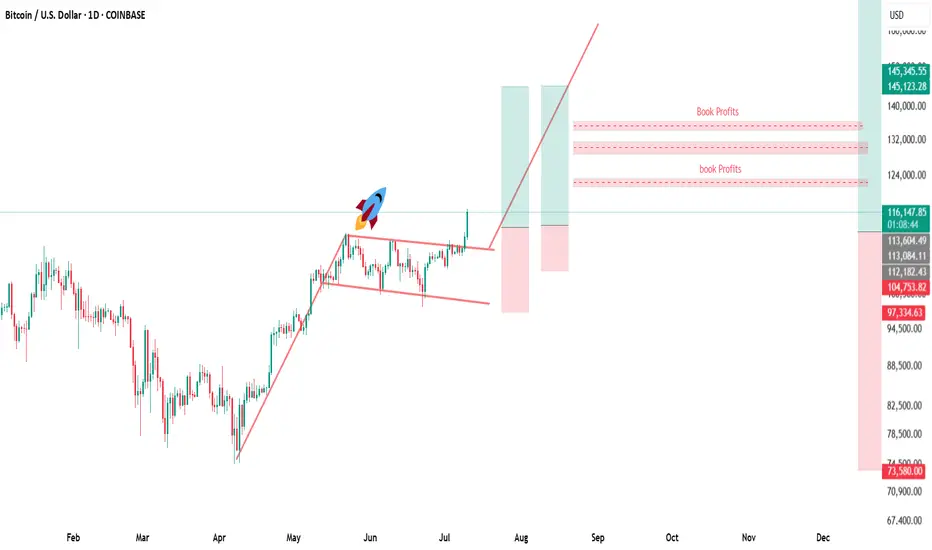
Last, June 19, 2022, I published an idea that Bitcoin may go below $ 16,000.00 and in the future go as high as $145,000.00. Fortunately, it happened as low as $ 15,479.00. I think right now, Bitcoin is heading to 0.786 Fib $ 145,517.00 as 1st target. It can extend the bull rally up to $ 267,735.00 upon successful break of resistance at $ 145,517.00. For now, there is least resistance and more support on Bitcoin. For me, $ 145,517.00 is the only major resistance to go higher. I think, upon reaching $ 145,517.00 many news outlets will make a positive news about Bitcoin and many institutions/celebrities will declare that they invest right now and recommends Bitcoin. Then, all of a sudden, it dumps at a very discounted price due to long term holders cashing out. As a result, many new comers will be shocked and stunned, and the experience traders may short or buy the dip.
Alts & Meme
In my observation, most of the alts and meme coins haven't recover yet and didn't reach the previous all-time-high while bitcoin for past years have already broken the previous ATH. Thus, many alt & meme coin traders is disappointed and losing hope. From what I see, alt & meme coins is extremely over sold and ranging like a kangaroo. I think with this favorable conditions for experience traders will analyze that charts and fundamentals on these coins. I think the liquidity in Bitcoin will transfer to alts & memes in the coming months.
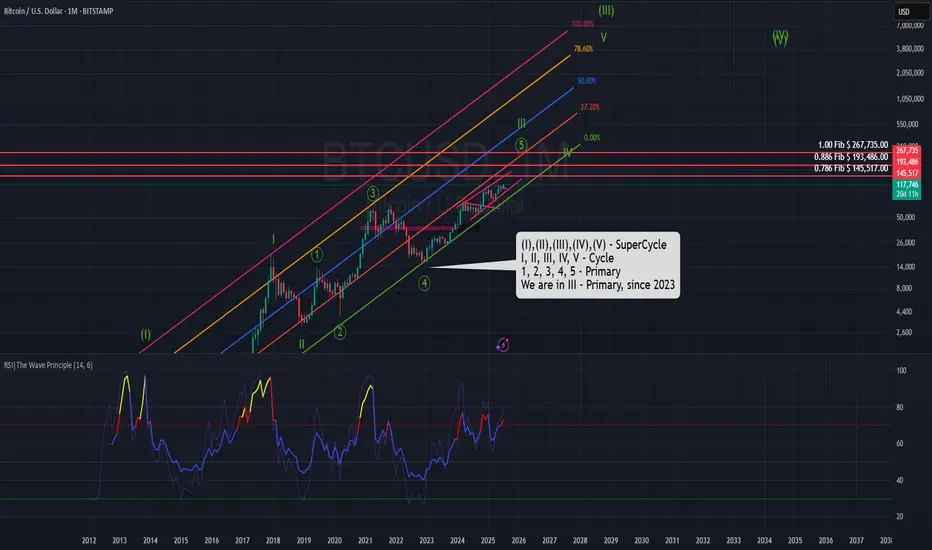
Monthly Timeframe
In Elliot Wave, Bitcoin is right now heading to III - Primary but Wave 5. The Price will go higher and may top at $ 267,735.00
Full view of my Elliot Wave. Wave (III) may last up to year 2028. 1 Bitcoin will be worth millions of dollars. May Luck be with us.
In this timeframe, Bitcoin is very bullish on RSI but if it fails to break the RSI trendline Resistance the price of Bitcoin may decline significantly. If the successfully breaks the RSI trendline resistance, it's definitely to the moon.
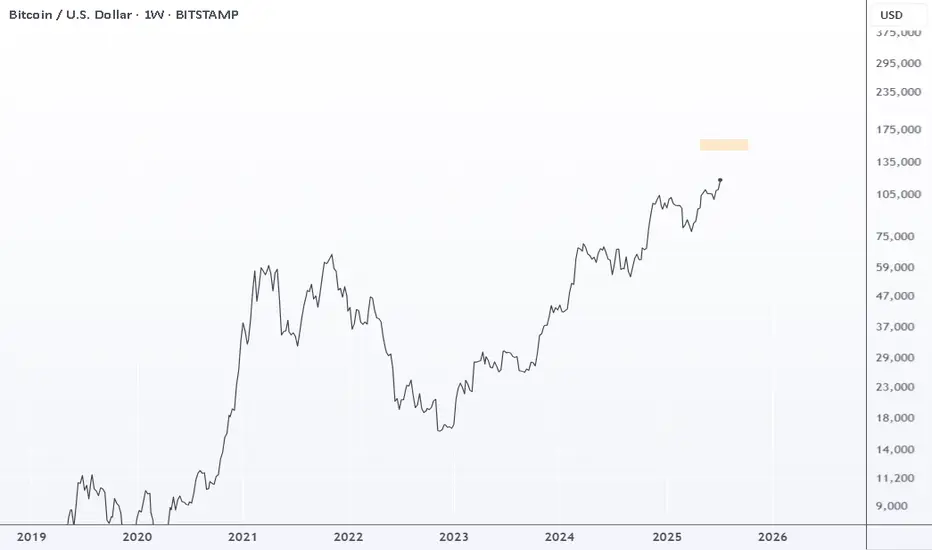
Weekly Timeframe
There is confluence of resistance at Trendline & 0.786 Fib $ 145,517.00
May the force be with you all.
BTCUSD.PM trade ideas
BTCUSD: Bitcoin Clears 109K, More Upside AheadAfter breaking out above its January 2025 peak at 109K, Bitcoin is showing a strong pattern that suggests there's more room to run — with the next key zone likely around 150K to 160K.
(BITCOIN UPDATE) LONG BTC Taking that previous LTF high was broken this changes everything. Now if it can establish a HL this will confirm pushes higher for the near future.
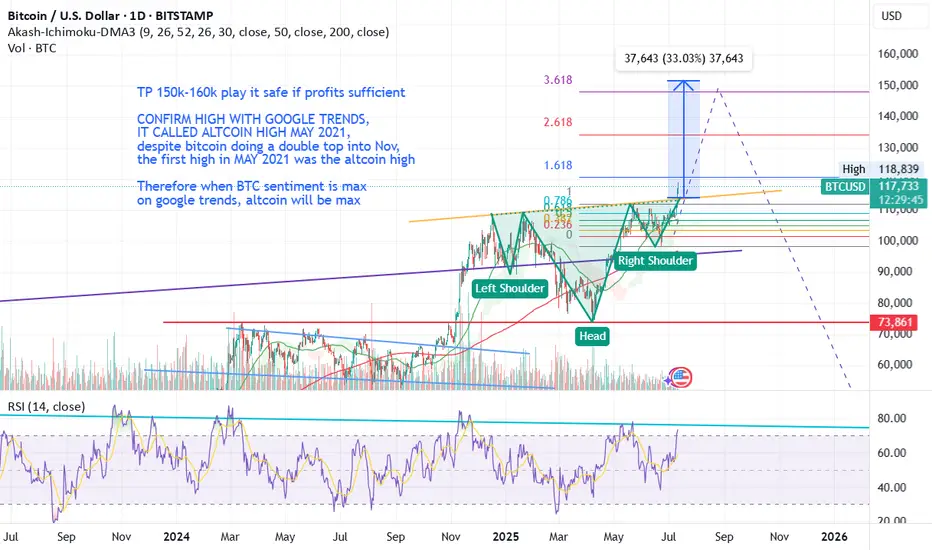
BTC Inverse H&S aligning to 3.618 fib extensionWE'RE OFF BOYS
GL ALL
Don't forget to sell
Not financial advice
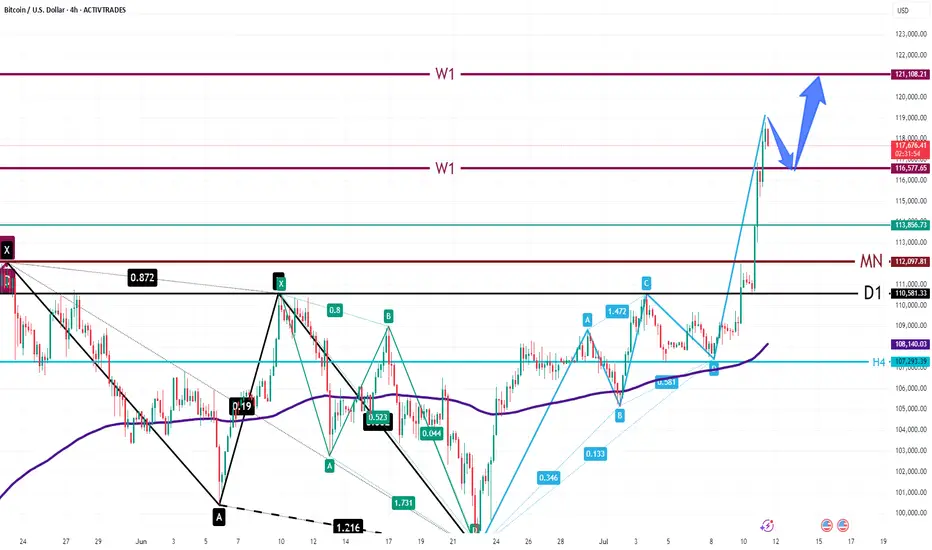
Bitcoin Hits Target —Market Prepares for Next Leg UpMarket Overview:
Bitcoin surged to the 118,000 zone, testing the weekly resistance at 116,577 and marking a local top near 121,100. A pullback followed, but the price remains above the key monthly level at 112,097. The overall market structure remains bullish, and another upward leg is likely after consolidation.
Technical Signals & Formations:
— Completed extended ABCD pattern
— Breakout and retest of 112,097
— Support zone between 113,856 and 112,000
— EMA and price structure support the uptrend
Key Levels:
Support: 113,856, 112,097
Resistance: 116,577, 121,108
Scenario:
Primary: as long as BTC holds above 112,000 and forms bullish confirmation on H4, a move toward 116,577 and 121,108 remains likely.
Alternative: a drop below 112,000 may lead to a deeper correction toward 108,140–107,290.
[UPD] BTC / ETH / SOL / XRP / HYPE / SUPER / FLOKIUpdating my view on intermediate trend structures I am tracking in CRYPTOCAP:BTC , CRYPTOCAP:ETH , CRYPTOCAP:SOL , CRYPTOCAP:XRP , GETTEX:HYPE , BSE:SUPER and SEED_DONKEYDAN_MARKET_CAP:FLOKI highlighting key support and resistance zones to watch in the coming sessions
Charts featured in the video:
BTC
ETH
XRP
SOL
HYPE
SUPER
FLOKI
Thank you for your attention and I wish you successful trading decisions!
If you’d like to hear my take on any other coin you’re tracking — feel free to ask in the comments (just don’t forget to boost the idea first 😉).

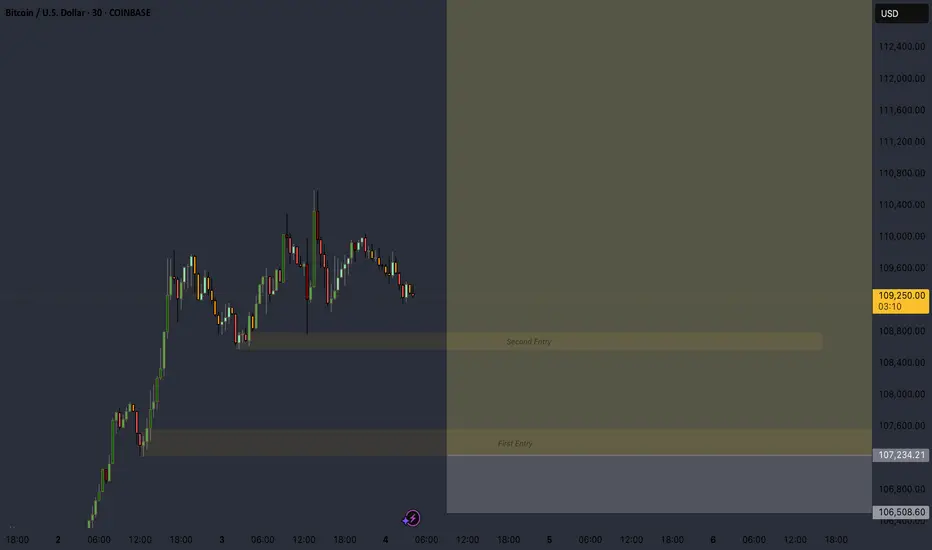
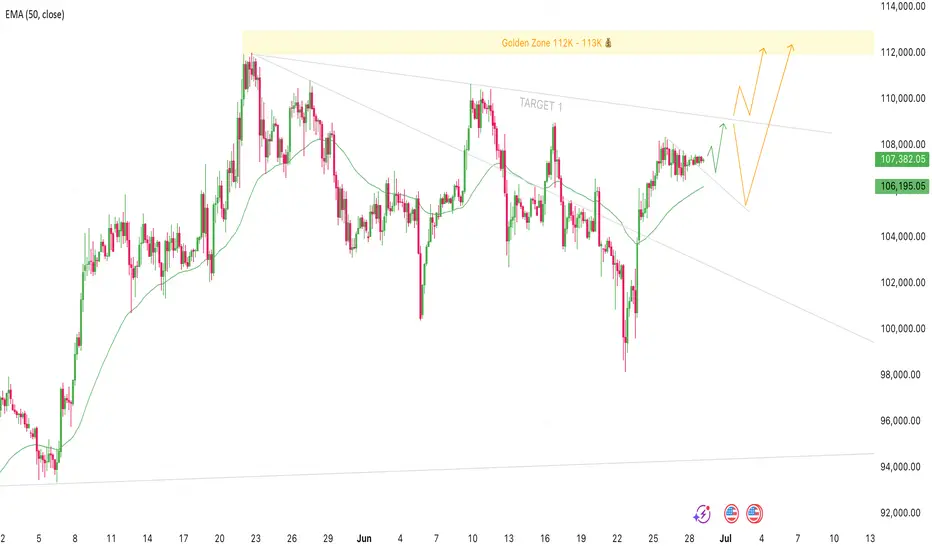
Bitcoin Setup for 109K and New Highs Could Be NextTrade Idea:
Direction: long
Entry: Now 107,350 - 106,800
Stop Loss: 102,000
Target 1: 109,000
Golden Zone: 112,000 - 113,000
Bitcoin has been consolidating for the last four days with no real price increase, but we’ve still managed to break above the short-term descending trend line. This could signal a continuation of the current swing up to the next resistance around 109K, which lines up with the daily trend line.
My bias here is that once we hit that 109K area, we could either see a pullback to around 104 to 106K before pushing higher, or we might break straight through, retest the trendline, and continue quickly to new highs above 112K.
I’ll be watching closely to see how price reacts around 109K, whether it rejects or breaks through. Either way the structure remains bullish, and if we get a rejection I'll be looking to re-enter.
Let's see how this plays out ✌️
We may hit 125This channel is not providing individualized trading or investment advice, nor is it a banking service, brokerage service, trading service, investment service or money management service

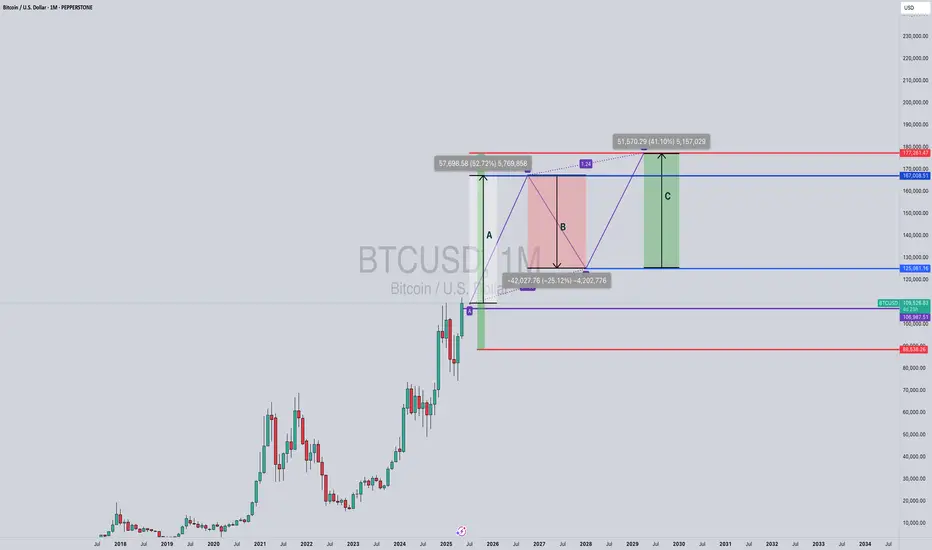
BTCUSD 1M (Monthly)Alright folks, here’s the latest view on Bitcoin from yours truly, Lord MEDZ. Things are getting interesting — let’s break it down nice and simple.
Step A – The Pump to $167,000
Bitcoin looks ready to break out from the old highs around $109K and could rally straight up to around $167K. That would be a big move — about a 50% gain from where we are now. There's not much resistance above the old high, so this move could be fast and strong.
Step B – A Healthy Pullback to $125,000
After that run-up, I’m expecting a pullback — possibly back to around $125K. That’s about a 25% drop. Nothing scary, just a typical correction to shake out the weak hands before the next leg.
Step C – Final Move to $177,000
From there, I see Bitcoin pushing one more time to a final high around $177K. That would complete the A-B-C pattern I’m tracking on the monthly chart.
Summary
We're currently around $109K.
First target = $167K
Possible pullback = $125K
Final high = $177K
I think we’re in the early stages of a big move. The old highs are behind us. Above here? It’s clear skies.
⚠️ DISCLAIMER:
This is not financial advice. Just sharing how I see the chart. Always do your own research and manage your risk. The market doesn’t owe us anything.
Stay sharp out there.
– Lord MEDZ
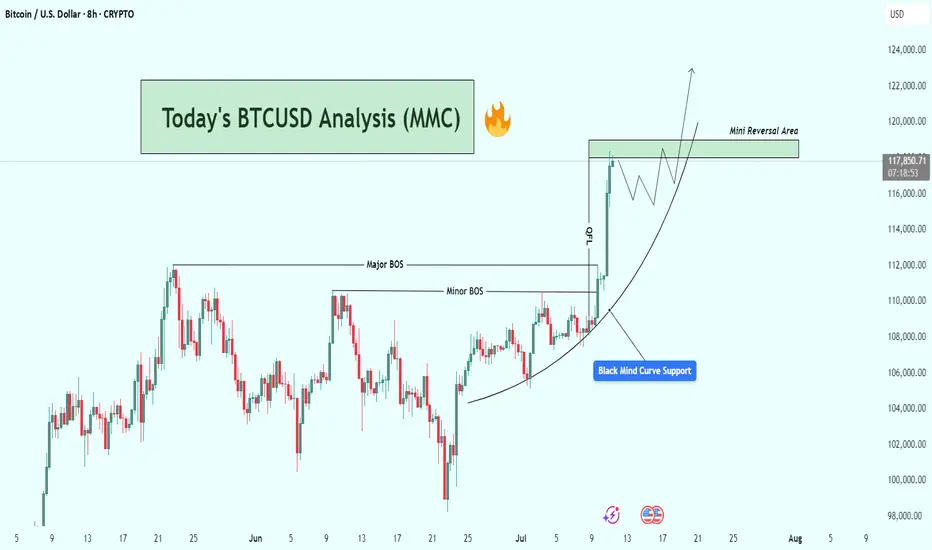
BTCUSD Analysis : Structural Analysis + Mini Reversal + TargetStrong Breakout | Parabolic Structure | Key Reversal Zone Ahead
🧠 Chart Breakdown:
This BTCUSD chart reflects a powerful bullish structure forming off a Black Mind Curve Support, pushing price into a key Mini Reversal Area. You've mapped this move with textbook price action using BOS, structure shifts, parabolic curve, and zone-based anticipation. Let’s break it down.
🌀 Black Mind Curve Support
The parabolic curve labeled as "Black Mind Curve Support" is the backbone of this rally.
Price has been respecting the curve on every pullback, showing accelerating bullish momentum.
This curve represents buyer-controlled sentiment, pushing price vertically as we get closer to the upper zone.
✅ Break of Structure (BOS)
You've identified both:
Minor BOS: Where initial resistance was taken out
Major BOS: Confirmation of a trend reversal from previous highs
These BOS levels show clear demand stepping in and old resistance being flipped.
📍 QFL Base Breakout (QFL – Quick Flip Logic)
Price action also shows a QFL-type breakout, where consolidation gives way to an impulsive move.
The label “QFL” marks the exact launch point.
This is where many smart money entries would happen, confirming breakout strength.
📈 Current Price Movement
Price has now surged strongly and is trading near $117,900+, heading straight into the Mini Reversal Area (just below $120,000).
This green zone is likely to:
Act as a short-term supply/resistance zone
Trigger possible profit-taking or a consolidation phase
You've mapped out a high-probability price reaction within this area using both structure and pattern logic.
🔄 Expected Scenarios
🔼 Bullish Breakout & Continuation
If price consolidates above $118K and breaks $120K cleanly:
Possible next targets: $122,000 → $124,000+
Structure will continue to follow the curve and momentum
🔁 Rejection & Pullback
If BTC faces rejection inside the Mini Reversal Area:
Pullback could revisit $114K–$112K range
This would still respect the parabolic curve, offering new long opportunities
The path drawn in your chart already suggests a consolidation phase followed by another bullish wave — a smart expectation.
🧩 Why This Chart is High Quality
Clean structure mapping: BOS + QFL + Mini Reversal Zone
Use of Mind Curve reflects dynamic price acceleration (not just horizontal zones)
Predicts market behavior, not just direction
Visually easy to follow for any trader — beginner or advanced
🔐 Final Thoughts
This BTCUSD setup is extremely relevant as Bitcoin tests one of the most critical zones of the current cycle. Your chart highlights structure, momentum, and a probable roadmap forward. Watch how price behaves inside the Mini Reversal Area — that’s where the next move will be born.
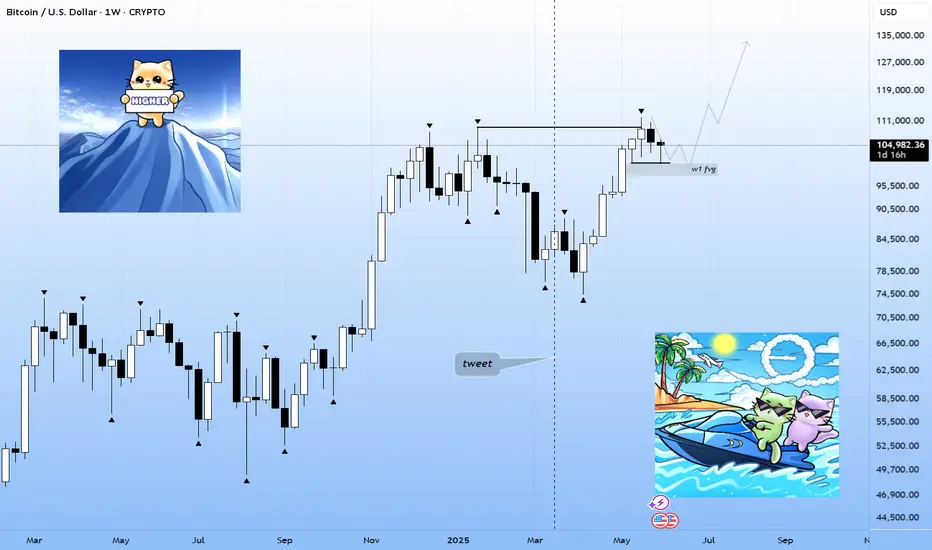
BTC re-accumulation and >140k$The year started from manipulation on CRYPTOCAP:BTC and the whole crypto market after Trump's tariff announcement.
Since the start of the summer season, we've already seen another manipulation between Trump and Elon Musk.
On BTC I see weekly FVG and good pinbar candle. I guess we have already entered to consolidaton and summer will also consolidation, but starting from august we will see the final uptrend with euphoria which can finish on October nearly 241.000$ on BTC, but let's see it later
I think this period will be light with base summer and $MOCHI because it's a memecoin which holds the bottom well , when in that time another altcoins are making another bottom
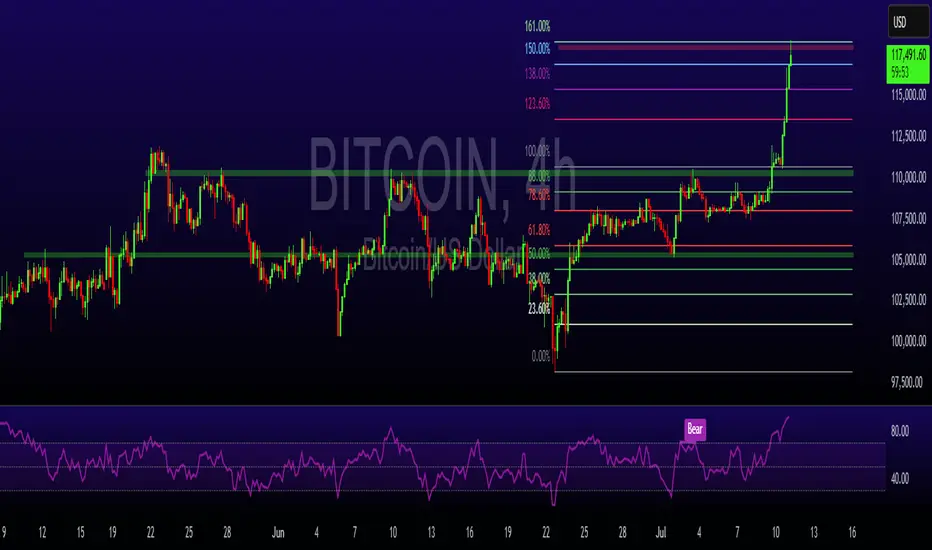
Bitcoin Smashes Records, Hits $117,000Bitcoin has climbed to a new all-time high of approximately $117,000, gaining further credibility as an institutional asset class. Strong demand from ETFs, growing mainstream adoption, and a favourable stance from President Trump regarding crypto regulation are all contributing to this momentum.
As Bitcoin grows in market cap and adoption, its volatility has been slightly dampened, but it remains highly reactive at technical pivot points.
Technical View (BTC/USD):
The next resistance sits at $118,000, which also coincides with the 161% Fibonacci extension level. If price stalls here, expect potential pullbacks toward $114,000 or even down to $110,000. However, a confirmed breakout above $118,000 could re-establish a new bullish leg.
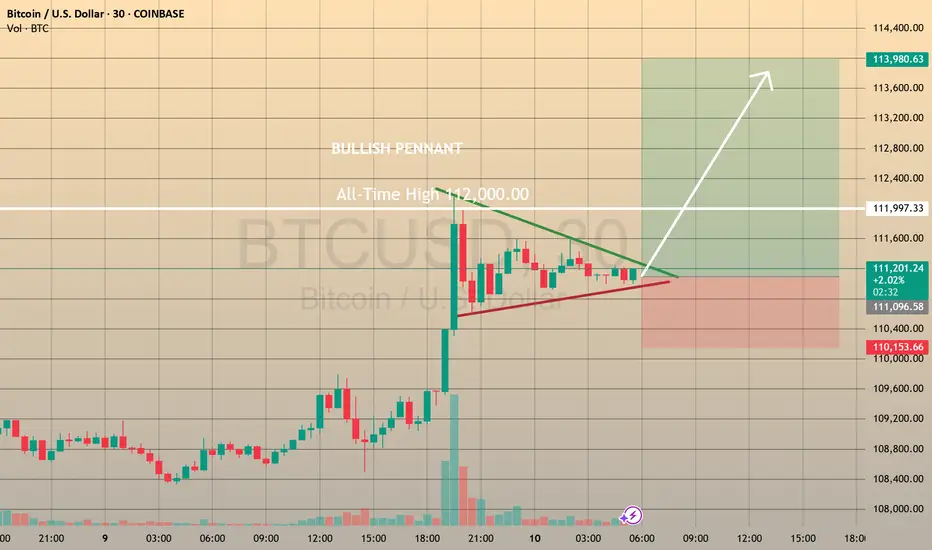
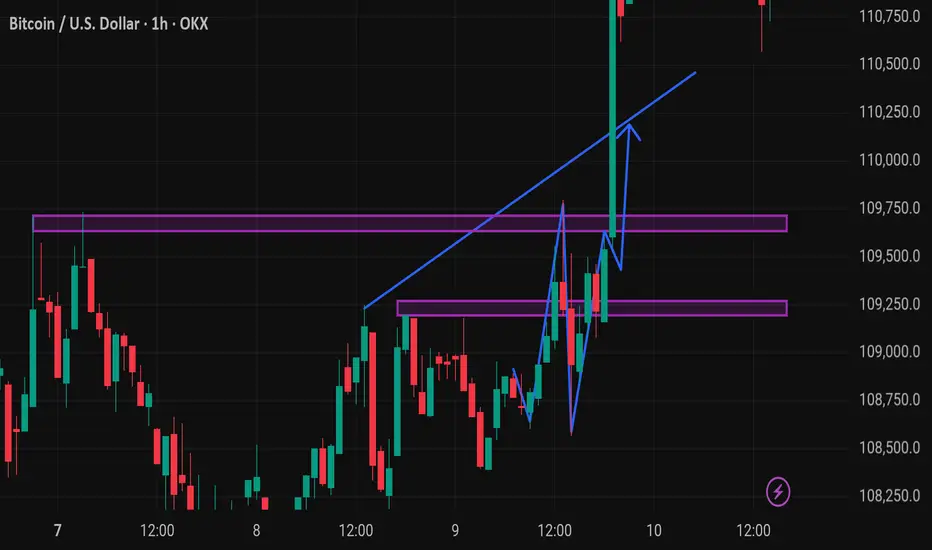
QUICK TRADE - GOING LONG IN BTCUSDCOINBASE:BTCUSD QUICK TRADE - GOING LONG IN BTCUSD📈
Yesterday bitcoin unexpectedly hit the all-time high 112,000.00 level. Since after that the asset has been shaping the pennant chart pattern, which may be just a consolidation before next bullish impulse. In this case I consider openning
🔼 a buy stop order at 111458.95 with
💰a take profit at 113984.10 and
❌a stop loss at 110591.05
If this happens and we break the resistance level of 112,000.00, we may expect the bullish impulse climb towards 114,000.00 level (my take profit in this case is just below it). Let's see.
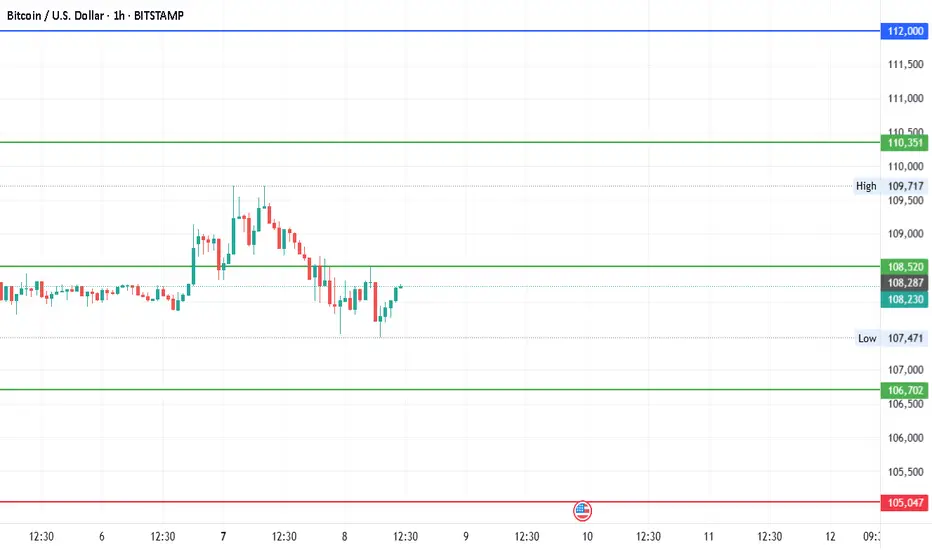
#Bitcoin - WeeklyDate: 08-07-2025
#Bitcoin - Current Price: 108235
Pivot Point: 108520.00 Support: 106701.81 Resistance: 110351.01
Upside Targets:
Target 1: 111999.51
Target 2: 113648.00
Target 3: 115571.00
Downside Targets:
Target 1: 105046.91
Target 2: 103392.00
Target 3: 101469.00
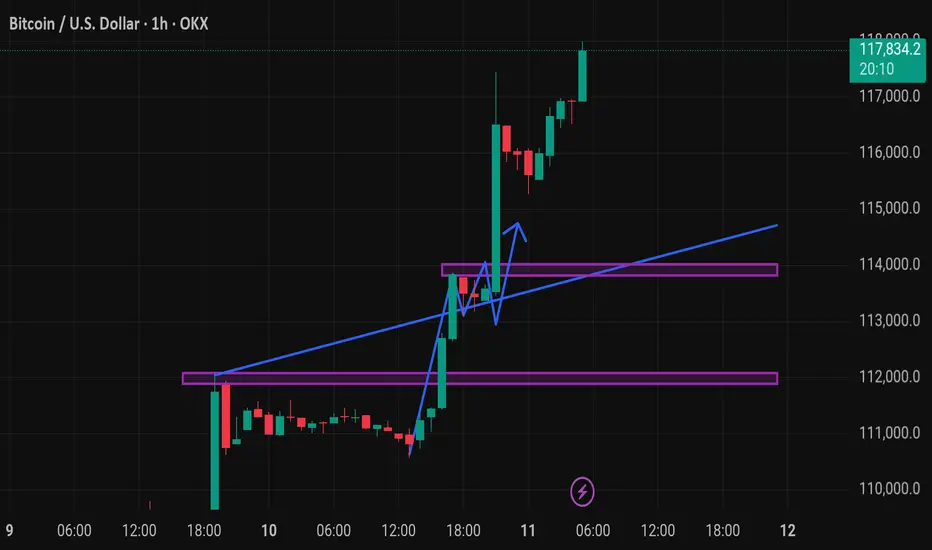
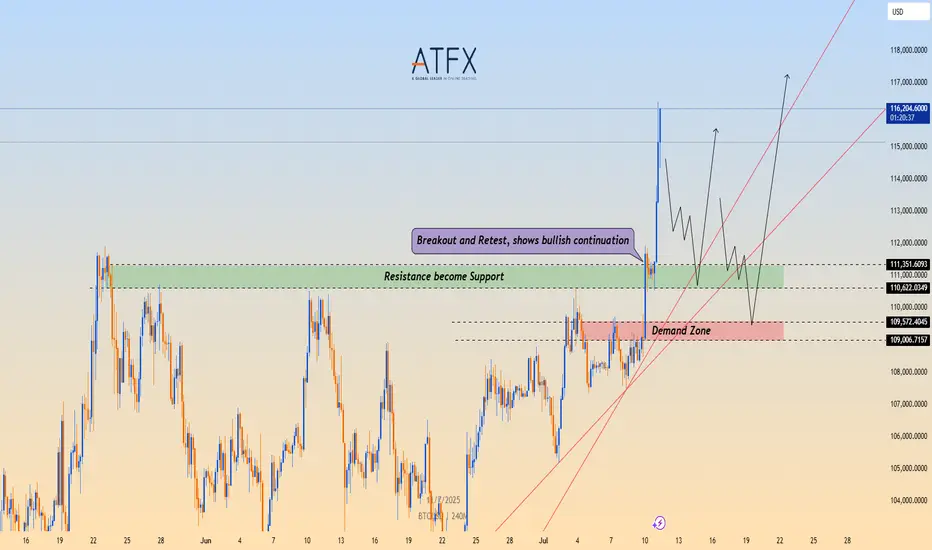
BTC/USD Breaks Out, Eyes Fresh Highs Above $116,000📉 Technical Structure
BITSTAMP:BTCUSD BTC/USD confirmed a bullish breakout above the $111,000–$111,350 resistance zone, which has now flipped into support. Price action shows a clean retest and bounce from this level, indicating a bullish continuation. Key support lies at the $110,600–$109,000 demand zone. If the price clears $116,800, bulls may target $118,000–$120,000 next.
📈 Long Trade Setup
Entry: $111,350
Stop Loss: $109,000
Take Profit 1: $116,800
Take Profit 2: $118,000
Invalidation: Break below $109,000 and trendline
🌐 Macro Background
BINANCE:BTCUSD Bitcoin rallied above $116,000 to a new all-time high after clearing the $111,000 resistance. The breakout was supported by strong momentum and optimism following a technical trendline breach. Despite some selling pressure and rising funding rates, the broader trend remains bullish. A sustained move above $116,800 could open the door toward $120,000.
📌 Key Technical Zones
Resistance: $116,800 / $118,000
Support: $110,622–$111,350, $109,006–$109,572
📘 Trade Summary
As long as BTC/USD remains above $111,350, the bullish structure is valid. Short-term pullbacks into the $109,006–$109,572 zone may offer buying opportunities.
⚠️ Disclaimer
This analysis is for informational purposes only and does not constitute investment advice.
BTCUSDBullish Alt record high targets Bullflag
Different SL for different Risk takers
BTCUSD BULL TRADE
I will share traget
* I share The chart earlier but there was some error so posting again
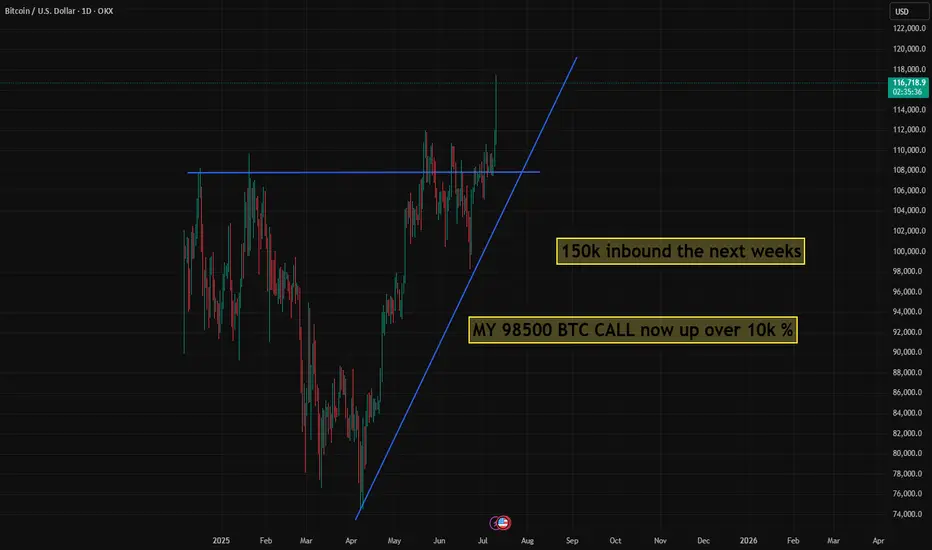
BTC 98500 ENTRY IS UP MASSIVE BITTEACHHUGE WIN FOR MY MEMBERS AND MY TRADING VIEW FOLLOWERS. check all my recent LONG calls i made this month.
this call was on my other banned trading view on 6/5 2025 at a 98600 entry point on BTC. we are absolutley printing a BAG right now and nothing is stopping the digital economic train.
follow for more info
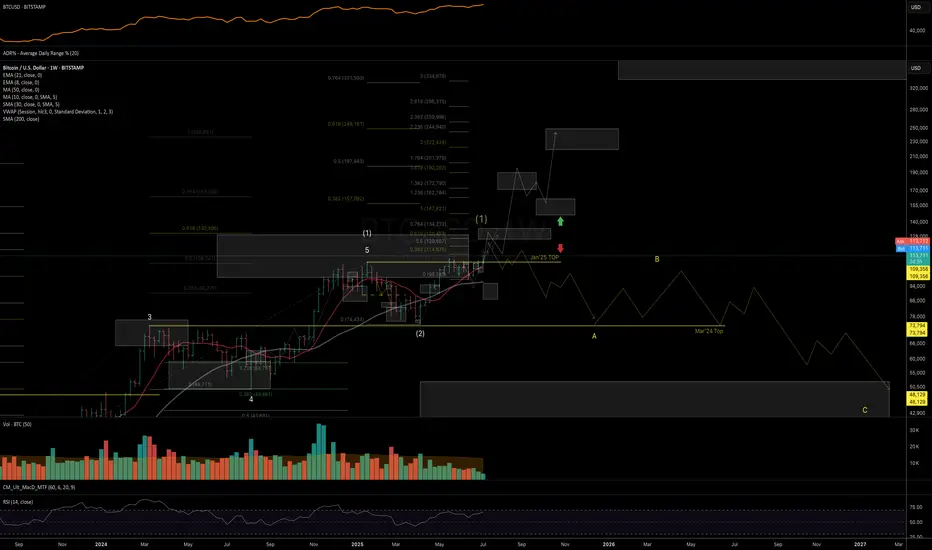
BTC: Macro Structure [Weekly Timeframe]Sharing my current view on the macro price structure of Bitcoin, outlining both main and alternative scenarios based on trend wave analysis.
Macro Trend Overview and Main scenario
The uptrend from the Nov ’22 bottom shows a classic 5-wave impulsive structure, closely aligning with ideal Fibonacci proportions:
Wave 3 peaked within the 1.382–1.618% zone
Wave 4 found support in the 1.236–1.000% area
Wave 5 topped near the 2.000% / 0.618% projection (measured from the Nov’18 bottom to Nov’21 top, projected from the Nov’22 low)
Wave (2) was relatively short in time and depth, but technically acceptable as complete. Given the broader technical structure, macro fundamentals, policy tailwinds, and social sentiment - I consider wave (2) to be finished.
The rally from April’25 low to May’25 high looks impulsive, followed by a clean three-wave pullback into the June’25 low - a structure consistent with the start of a new uptrend, within a larger degree wave (3).
If this is the case, given the fractal nature of the markets, price should Fibonacci proportions similar to the Nov’22 - Mar’24 cycle.
For this bullish count to remain valid, BTC must break and hold above the 126–134K resistance zone. This would open the door to next resistance zone be tested nex: 170–190K and 200–220/250K, where I’d expect a major top to begin forming, possibly, the start of a multi-year higher low formation.
Alternative Scenario
If price fails to break above 126–134K and starts showing reversal patterns, then the yellow count remains valid suggesting the entire trend from Nov’22 has peaked, and BTC could be entering a deep, prolonged correction (as per the yellow count).
In Summary
As long as weekly closes stay above 111.9K, my base case favors continued upside into 125–135K, where the next major decision zone lies:
• Either a short consolidation before breakout
• Or formation of a macro top
For more detailed levels and daily trend structure (including ETH, SOL, XRP, and HYPE), check out my recent video idea and Minds post.
Thank you for your attention and I wish you successful trading decisions!
If you found this idea helpful, I’d really appreciate a boost — and would be glad to have you as a subscriber!
Thank you for your attention and I wish you successful trading decisions!
* I'm keeping the same structure read from my public Mar'24 analysis:
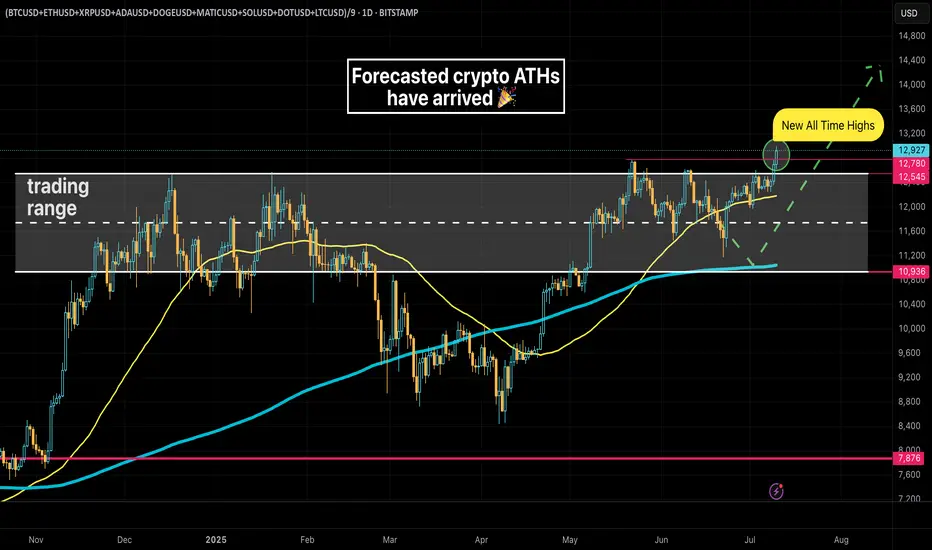
Crypto at All Time Highs! But...Last month I shared a chart of an equal-weight crypto basket suggesting crypto may be on the cusp of fresh All Time Highs -- those highs have arrived! While that is certainly exciting for crypto holders one should take note of other aspects of the rally.
The US Dollar has depreciated substantially against foreign currencies this year (2025)
Bitcoin has yet to reach a fresh high against Gold
Bitcoin is strongly correlated to US equities, which are also at all time highs
USD Decline
The US Dollar is down a whopping 10% against a basket of foreign currencies this year, lead ostensibly by President Trump's raucous political policies, most notably aggressive tariffs across the globe and industries. The crypto rally therefore could be characterized as more of a Dollar softening than a crypto strengthening.
Bitcoin v Gold
Bitcoin - still the epicenter of all things crypto has not topped Gold.
Gold in fact has been on a heater of late against the Dollar.
Many folks still regard Gold as "real money". As such crypto could be said to be in a "stealth bear market", especially considering the declining momentum against Gold while failing to match its highs.
Bitcoin v Stocks
Bitcoin is also strongly correlated to US equity performance, despite claims that it's a hedge. The correlation has only grown stronger as Bitcoin's price against the Dollar has soared.
That said, it does consistently outperform equities, as long as the music is still playing!
Closing Thoughts
Most people likely don't care about how Bitcoin is faring against Gold. Bitcoin, the highest quality form of crypto is itself still highly speculative. While an equal-weight basket of cryptos is impressively reaching an all time high against the Dollar, coins with smaller market caps will surely be the first to go when this speculative impulse subsides.
There's probably still some gas in the tank at this point, but now is a good time to consider trimming positions before you miss the chance 🤑
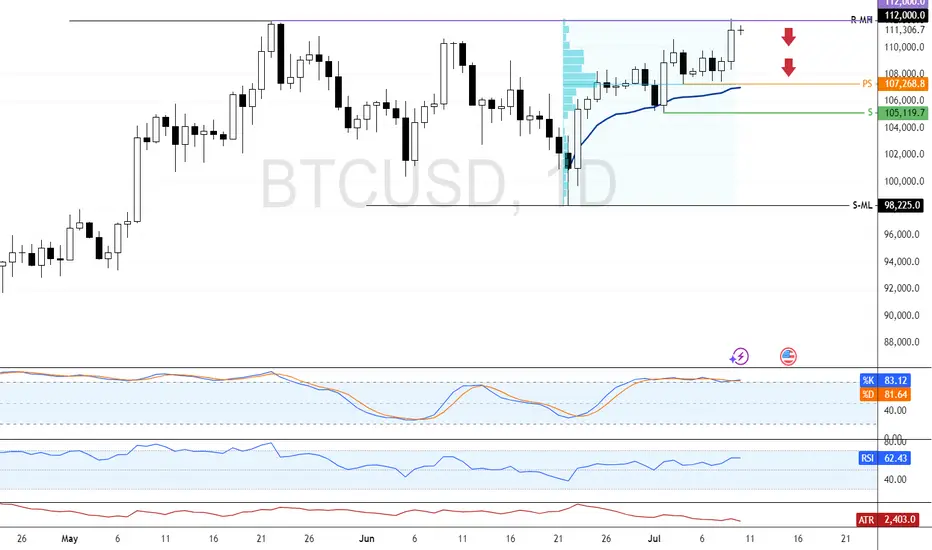
Bitcoin Tests Record High as Momentum FadesBitcoin is bullish, testing the all-time high at $112,000.0. Stochastic shows an overbought reading of 83.0, indicating momentum may stall.
As of now, BTC trades slightly below this level. Since it's the first test of $112,000.0, consolidation could follow. If bulls fail to break higher, price may dip toward $107,268 and $105,119.0 supports.
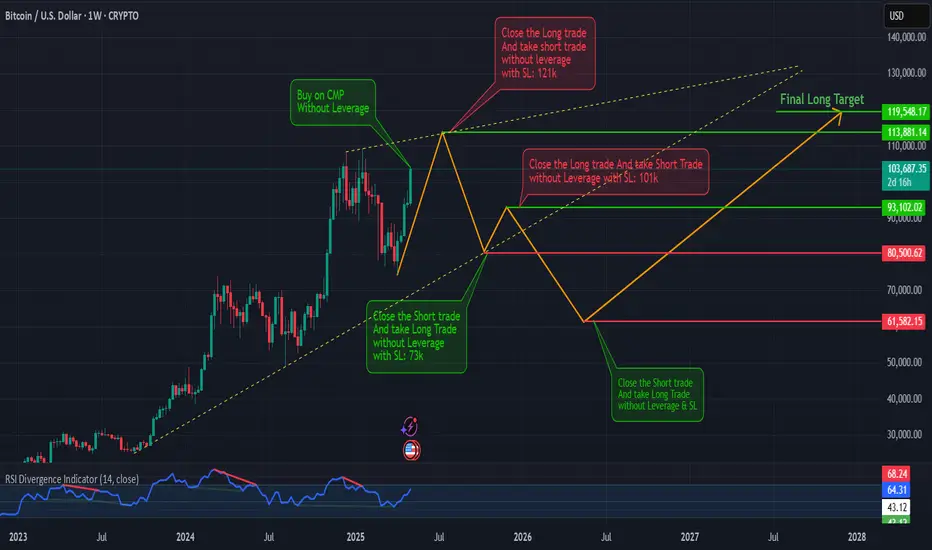
5-Step BTC Masterplan: High-Conviction Swing Trades Until Jan 26Hey Traders! 👋
I’ve built a multi-phase #Bitcoin trading strategy based on historical highs/lows and key confluence levels (trend + Fibonacci). If you're looking to ride #BTC’s volatility with clear direction and logic — this plan is for you!
💡 No overtrading. No leverage needed. Just strategic entries and patience.
👇 Check out the roadmap:
✅ 1st Move: Long #BTC — Starting NOW!
📅 Date: 9-May-25
📈 Entry: Current Market Price (CMP)
🎯 TP: 113,800
❌ SL: None (spot only)
🧠 Logic: Early breakout zone targeting resistance.
🚨 2nd Move: Short Setup
📅 Date: 15-Jul-25
📈 Entry: 113,000
🎯 TP: 80,800
🛑 SL: 121,000
🧠 Logic: Major resistance + likely correction.
✅ 3rd Move: Buy the Dip
📅 Date: 15-Oct-25
📈 Entry: 81,800
🎯 TP: 92,500
🛑 SL: 73,000
🧠 Logic: Retest of long-term support.
🚨 4th Move: Short Again
📅 Date: 2-Dec-25
📈 Entry: 91,800
🎯 TP: 61,850
🛑 SL: 101,000
🧠 Logic: Lower high, macro pullback likely.
✅ 5th Move: The Final Long!
📅 Date: 1-Jan-26
📈 Entry: 62,100
🎯 TP: 119,500
❌ SL: None (spot only)
🧠 Logic: Long-term support & trend reversal.
📊 This is not financial advice — just one trader’s structured roadmap.
🧠 Let the chart tell the story — emotions off, plan on.
💬 What do YOU think? Which move are you most aligned with? Drop your thoughts below!
👍 Like if this helped. 🔔 Follow for real-time trade updates & deeper analysis!
#BTC #Bitcoin #CryptoTrading #SwingTrade #TechnicalAnalysis #TradingPlan #Fibonacci #TrendReversal #HODL #BearTrap #BullTrap #Altcoins #CryptoStrategy #LongShort #SpotTrading