BTCUSD📈 Bitcoin (BTCUSD) Market Update
Current Price: $105,000.00
Outlook: Strongly Bullish
Bitcoin is currently trading at $105,000 and showing continued bullish momentum. Price action indicates strong demand at current levels, with technical structure suggesting potential for an explosive move upward.
Key Insight:
Buy pressure remains dominant, with no immediate signs of reversal. BTC is holding above key support zones and appears poised for a continuation rally.
📊 Trade Idea:
Bias: Long (Buy)
Entry Zone: Market Price (~$105,000)
Short-Term Targets:
🎯 Target 1: $110,000
🎯 Target 2: $120,000
🎯 Target 3: $130,000
Note: Monitor for consolidation above $105,000 as a base for further upside. Risk management remains essential—adjust stop-loss levels as per your strategy.
BTCUSD.PM trade ideas
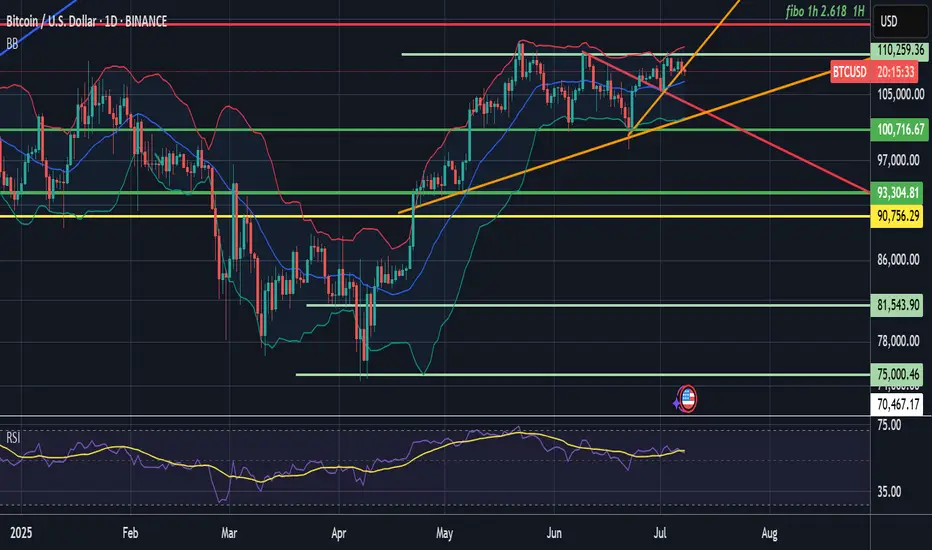
Price: ~$107,900 Trend: Consolidating after a breakout from a dCurrent Setup Analysis
BTC broke out of a falling wedge pattern (red trendline) and is holding above support near $100K.
Higher lows since June indicate bullish accumulation.
The price is riding above the ascending orange trendline.
Bollinger Bands suggest potential continuation; RSI isn’t overbought.
▶️ Buy Setup (Long Bias)
Entry (Buy): Between 107,500–108,000
Stop Loss: Below 104,000 (just under trendline and BB midline)
Target 1: 110,259 (key horizontal + BB upper area)
Target 2: 112,000 (psychological resistance)
Target 3: 114,266–116,000 (Fibo 2.618 + extension zone)
Sell Setup (Short Bias) – only if rejection
Entry (Sell): If there's a clear rejection candle near 110,000–112,000
Stop Loss: Above 114,500
Target 1: 100,716
Target 2: 93,304
This is a low-probability setup unless rejection is clear.
Final Recommendation
High probability of bullish continuation (above 60%)
Prefer a buy-the-dip strategy with stop under $104K
Watch 110K area — could act as a breakout or rejection point
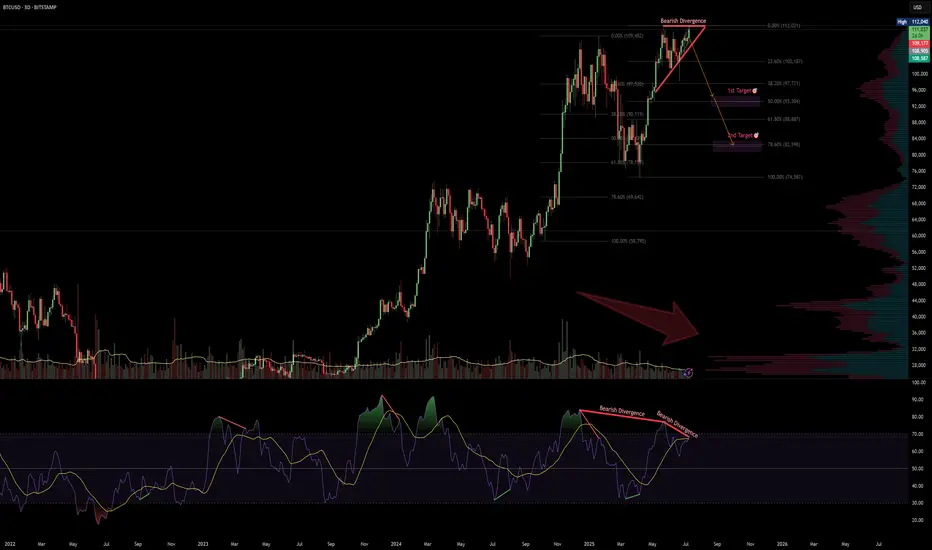
BTCUSD · 3D — Bearish Divergence + Volume Drop Suggest Pullback
🧠 Setup Overview
Bitcoin is showing signs of exhaustion after a parabolic rally:
Bearish divergence is visible on the 3D RSI — price made higher highs while RSI made lower highs.
Volume is shrinking with each push up, suggesting buyer momentum is fading.
Price is pressing into all-time highs without conviction, signaling potential for a pullback.
🔻 Downside Targets
Target 🎯 Level Why It Matters
Target 1 $93,300 (50% Fib) Midpoint of last impulse + first strong demand area.
Target 2 $82,500 (61.8% Fib) Volume-profile support + key confluence zone.
🔎 What Confirms the Setup?
Breakdown below $108K structure
Daily close below $105K with increasing volume
RSI losing midline support = momentum shift confirmed
❌ Invalidation
Daily close > $112K with strong volume = idea invalid
Would suggest continuation toward blue-sky breakout
✅ Summary
Bearish divergence + volume drop = classic topping signals
Risk is well-defined, with Fib-backed targets offering clean R:R
Trade cautiously — momentum is fading, not gone yet
📛 Disclaimer: This is not financial advice. Do your own research and manage risk according to your plan.
#Bitcoin #BTC #CryptoAnalysis #BearishDivergence #RSI #VolumeProfile #Fibonacci #TradingView
Bitcoin Strategic Breakout at the Threshold of Silence!⊣
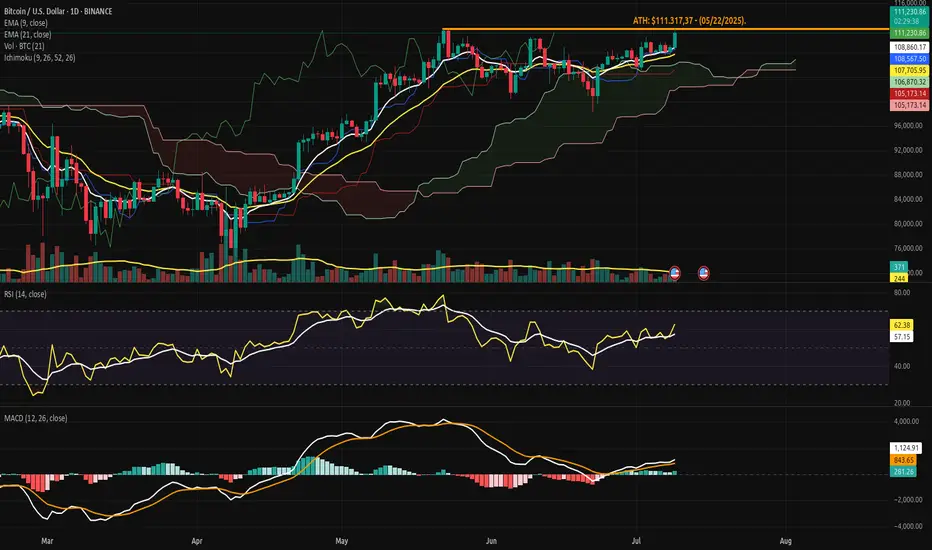
⟁ BTC/USD - BINANCE - (CHART: 1D) - (Jul 09, 2025).
◇ Analysis Price: $110,767.80.
⊣
⨀ I. Temporal Axis - Strategic Interval - (1D):
▦ EMA9 - ($108,767.55):
∴ Price remains above the 9-day EMA, maintaining a short-term bullish posture;
∴ The moving average acts as dynamic support with positive slope.
✴️ Conclusion: Immediate trend remains intact, with momentum supported at $108,767.55.
⊢
▦ EMA21 - ($107,663.85):
∴ EMA21 acts as the structural support of the medium-term trend;
∴ Price maintains a healthy gap above it, confirming bullish continuity.
✴️ Conclusion: Structural integrity remains bullish - no threat of reversal below $107,663.85.
⊢
▦ Ichimoku Cloud - (Senkou A: $106,870.32 / Senkou B: $105,173.14):
∴ Price is clearly above the Kumo, with bullish Tenkan/Kijun alignment;
∴ Lagging Span (Chikou) is above both price and cloud - clean trend confirmation.
✴️ Conclusion: Primary trend remains bullish; cloud structure provides layered support between $106,800 and $105,100.
⊢
▦ RSI - ($61.33):
∴ RSI is rising, currently at 61.33, still below the overbought threshold;
∴ No divergence or bearish signal present; EMA9 of RSI is supportive at 56.94.
✴️ Conclusion: Momentum is healthy and climbing - room to extend toward the 70 level.
⊢
▦ MACD - (MACD Line: 251.71 / Signal Line: 836.26):
∴ Recent bullish crossover confirmed; histogram turning increasingly positive;
∴ MACD shows early-stage trend resumption with growing momentum.
✴️ Conclusion: Renewed bullish phase underway - MACD structure confirms sustained strength.
⊢
▦ Volume + EMA21 - (Current: 352.24 / MA: 244):
∴ Current daily volume significantly exceeds 21-day average;
∴ The breakout candle is technically validated by volume strength.
✴️ Conclusion: Real buying presence behind the move - not a hollow breakout.
⊢
🜎 Strategic Insight - Technical Oracle:
∴ All technical indicators are in alignment;
∴ Price is supported by volume, short-term EMA's, bullish Ichimoku structure, and clean RSI/MACD momentum;
∴ The price is approaching the (ATH - $111,317.37) and any confirmed close above it, backed by volume, could trigger a Fibonacci-based extension toward - ($115,000 / $117,300).
⊢
∫ II. On-Chain Intelligence - (Source: CryptoQuant):
▦ Exchange Inflow Total - (All Exchanges) - (13.4K Bitcoin):
∴ No abnormal spikes - inflows remain historically low.
✴️ Conclusion: Selling pressure is absent - no signs of miner or whale unloading.
⊢
▦ Exchange Reserve - (Binance) - (537.4K Bitcoin):
∴ Continuous outflow trend - reserves have declined sharply in recent weeks.
✴️ Conclusion: Structural supply contraction - classic hallmark of accumulation.
⊢
▦ Funding Rates - (All Exchanges)- (+0.006%):
∴ Slightly positive, well within neutral zone - no euphoria.
✴️ Conclusion: Leverage is present but controlled - not overheating.
⊢
▦ Open Interest - (All Exchanges) - (gradually increasing):
∴ OI rising gradually without abrupt spikes.
✴️ Conclusion: Positions are being built systematically - not impulsively.
⊢
🜎 Strategic Insight - On-Chain Oracle:
∴ The breakout is not driven by leverage, but rather by spot accumulation and institutional withdrawal;
∴ This environment mirrors previous (pre-expansion) phases (notably late 2020), when reserves declined and funding stayed flat;
∴ All vectors are aligned - a structurally sound rally is underway.
⊢
⧈ Codicillus Silentii - Strategic Note:
∴ The market exhibits complete silence beneath price - no inflows, no speculative buildup;
∴ Only those attuned to the deeper rhythm perceive the pressure building within this compressed structure;
∴ The Codex observes no disruptive anomalies; the energy is latent, not explosive - yet.
⊢
▦ Tactical Range Caution:
∴ Immediate Support: $108,767.55 - (EMA9);
∴ Structural Support: $107,663.85 - (EMA21);
∴ Previous ATH: $111,317.37;
∴ Breakout Extension Target: $115,000 - $117,300.
⊢
𓂀 Stoic-Structural Interpretation:
▦ Structurally Bullish - Tactically Confirming.
⊢
⧉
Cryptorvm Dominvs · ⚜️ MAGISTER ARCANVM ⚜️ · Vox Primordialis
⌬ - Wisdom begins in silence. Precision unfolds in strategy - ⌬
⧉
⊢
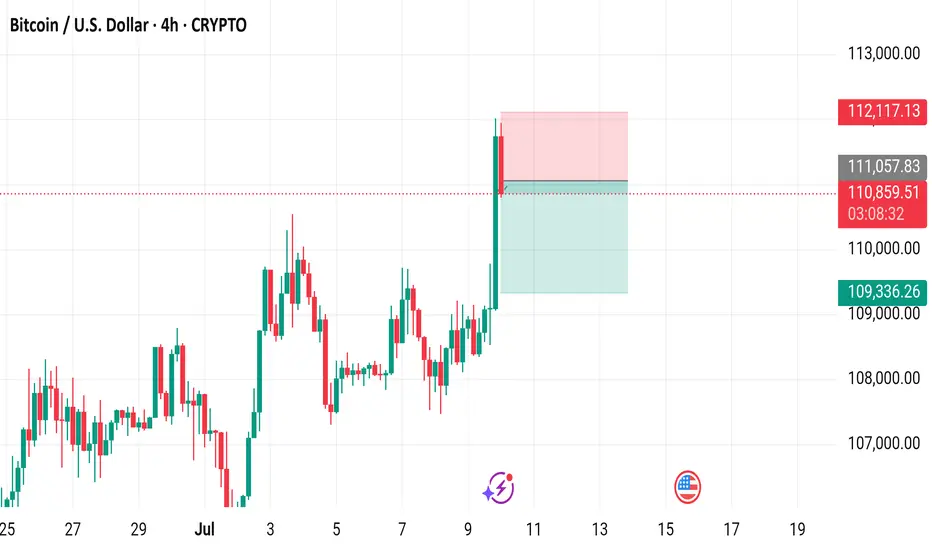
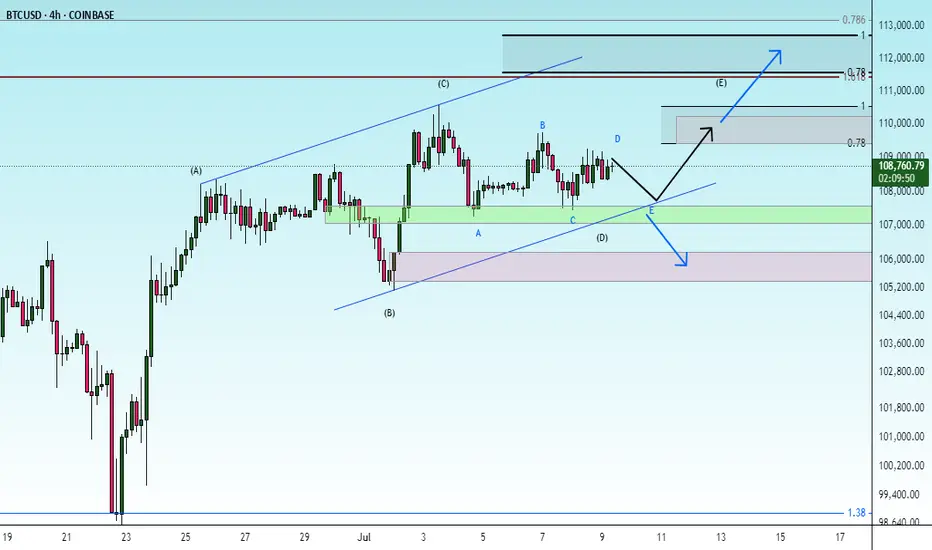
Bitcoin / U.S. Dollar 4-Hour Chart - CRYPTO4-hour candlestick chart displays the price movement of Bitcoin (BTC) against the U.S. Dollar (USD) from late June to mid-July 2025. The current price is $110,838.12, reflecting a 1.75% increase (+$1,908.56). The chart highlights a recent significant upward movement, with a notable green candlestick indicating a strong buying trend. Key price levels include a support zone around $109,336.26 and resistance near $112,117.13. The chart also shows buy and sell options at the current price level of $110,838.11.
Fake pumpWe had a good run.
BTC is due a correction.
Weekly RSI is Overbought.
Trendlines match fibonacci zones.
Overall fundamentals seem good longterm, but market needs a reset.
Many shorts to be liquidated in 115-117k , more than a billion dollars.
A billion dollars worth of longs to be liquidated at 97k.
Betting on fake pump,majorly overbought daily RSI, liquidate shorts, dump bitcoin, liquidate longs, load and reset.
95k seems reasonable, but theres a Fair Value Gap at 91k, and these get filled almost every time.With a spike through to the 0.61 fibonacci at 88k.
Possibility of 80k if theres a black swan mass panic event, this will touch the 0.78 fib and touch an unbroken bullish trendline from 2023. But very unlikely right now, just a healthy correction and reset before the true bull starts.
Alts will probably bleed hard, since faith is so shaken in them. Stack when theres mass fear.
After the next real pump rotation most probabably begins.
Good idea is to DCA at 95k, 90k is a solid zone, 80k would be absolutely perfect. Good levels for alts are corresponding to these prices.
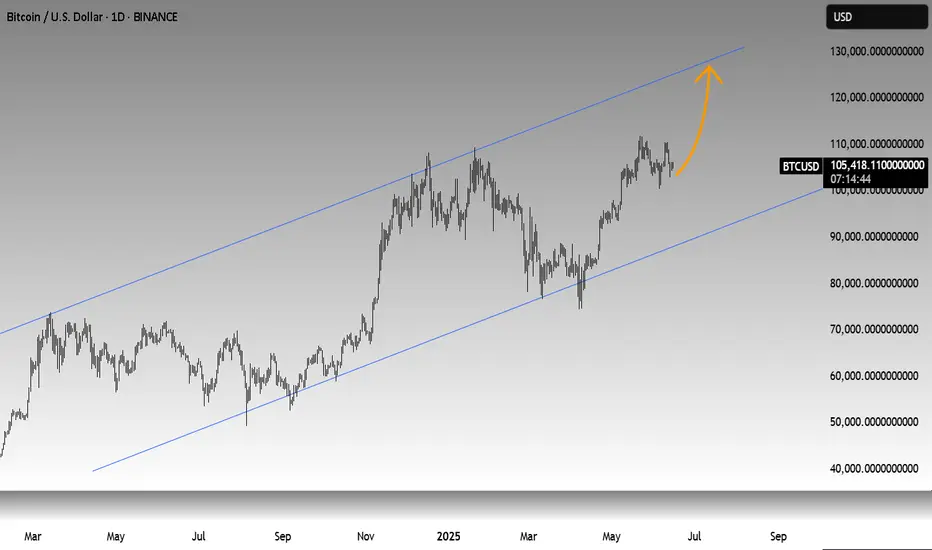
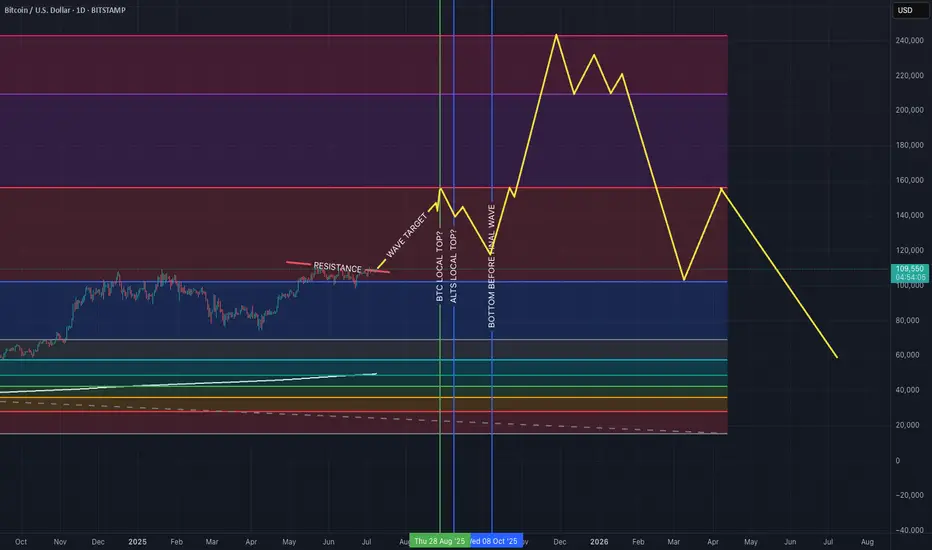
BTC H2 2025 - H2 2026My idea of what I think will unfold the rest of the year and next year for BTC.
Analyst Highlight: Bitcoin Levels to Watch After new Highs $109KA close-up analysis of BTC's push beyond $109k: Short vs Long Mas, VWAP alignment, and potential retracement zones. Expert-scoped with easy-to-read annotations and key entry/exit gates- perfect for adding to your watchlist.

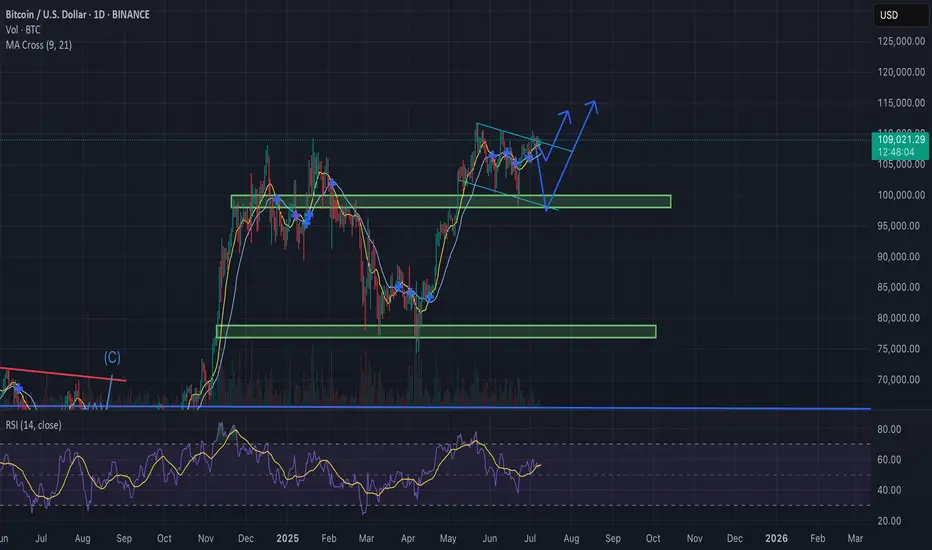
Bitcoin Update – Bullish Falling Wedge in Play?BTC/USD is currently trading near $108.8K, compressing within a falling wedge formation — historically a bullish continuation pattern, especially after a strong uptrend.
Why the Bias Remains Bullish:
Bullish MA Cross: Short-term MAs (9/21) are aligned for upside momentum.
Falling Wedge: Price compressing with lower highs and lows, coiling for a breakout.
RSI Strength: RSI (purple) remains elevated, supporting continued upside pressure.
Fundamental Catalysts:
Trump delays trade war announcements, reducing global uncertainty.
FOMC meeting in late July: Trump pushes for rate cuts, potentially bullish for risk assets like BTC.
If BTC breaks out above the wedge resistance with convincing volume:
Retest likely at ~$110K
Targets : $115K → $120K+
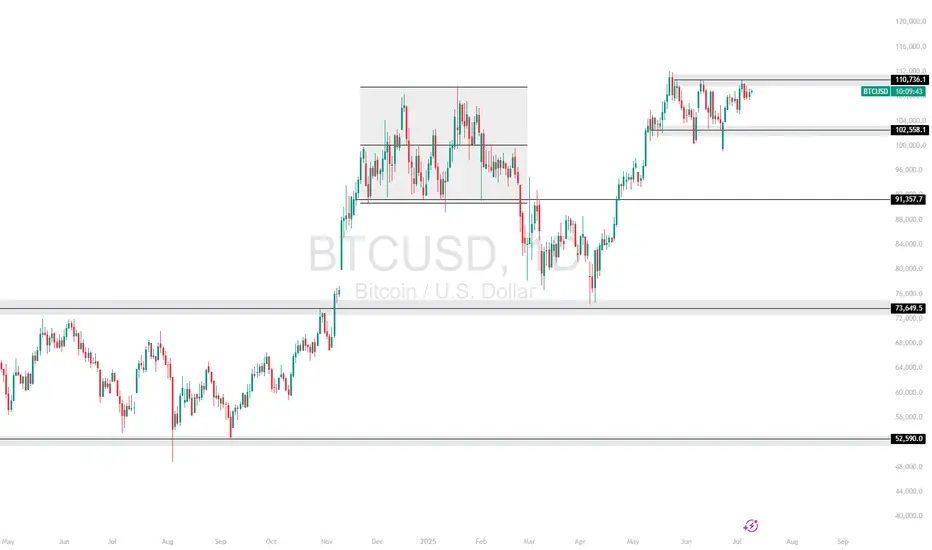
BTCUSD – Range High Retest at 110KBitcoin is consolidating below the 110,736.11 resistance after reclaiming support from the 102,558.1 zone. Price is holding a tight range, building pressure just under key resistance — a breakout above this could spark a move to new highs.
Support at: 102,558.1 🔽 | 91,357.7 🔽
Resistance at: 110,736.1 🔼 (range high)
🔎 Bias:
🔼 Bullish: Break and hold above 110,736.1 opens room for bullish continuation.
🔽 Bearish: A break back below 102,558.1 would suggest a potential shift toward 91,357.7 support.
📛 Disclaimer: This is not financial advice. Trade at your own risk.
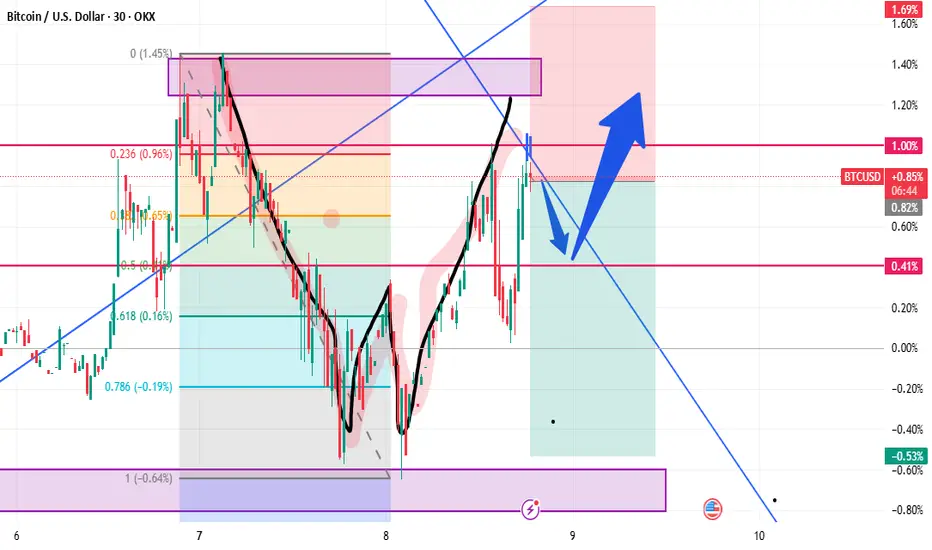
possibility of uptrendIt is expected that the triangle pattern will form according to the specified paths, then there will be a possibility of a trend change and the beginning of the upward trend.
If the price crosses the support area, the continuation of the downward trend will be likely.
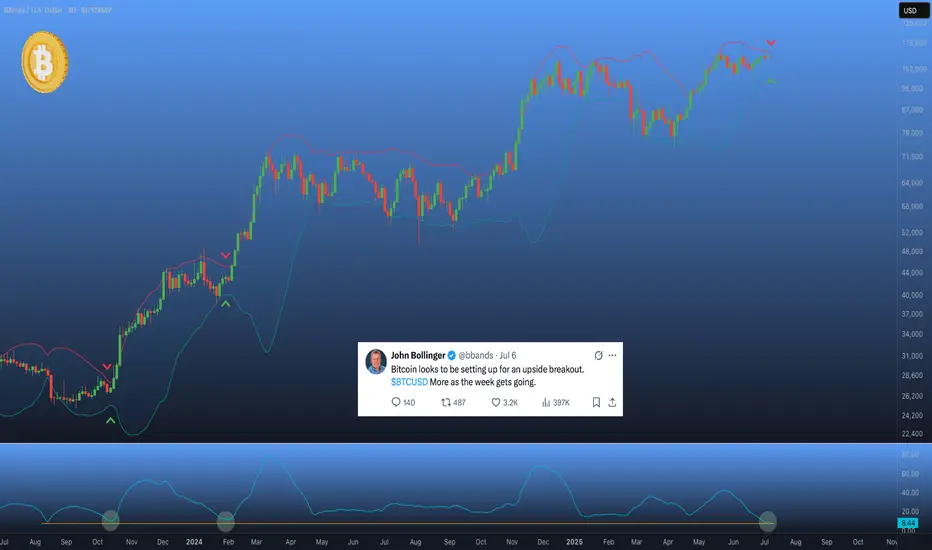
Bitcoin is ready for the breakout ?🤏 On #Bitcoin’s 3D chart, the Bollinger Bands have tightened to record levels — a signal that historically precedes massive moves. 🚀
📉 Volatility has also dropped to levels not seen since late 2024, right before #BTC launched from $26k to $70k.
✖️ Even John Bollinger himself, the creator of the indicator, hinted in his X post that a powerful impulse might be on the way.
Something’s brewing... 👀
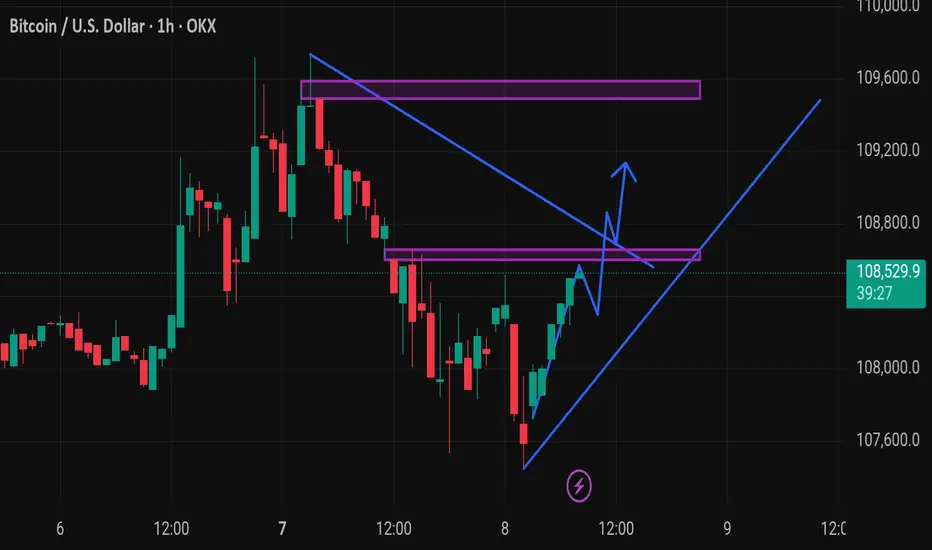
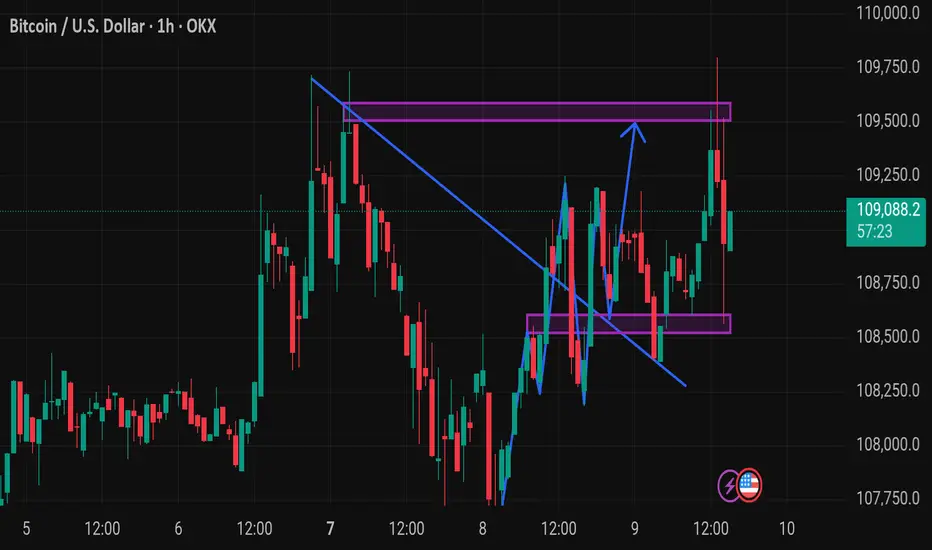
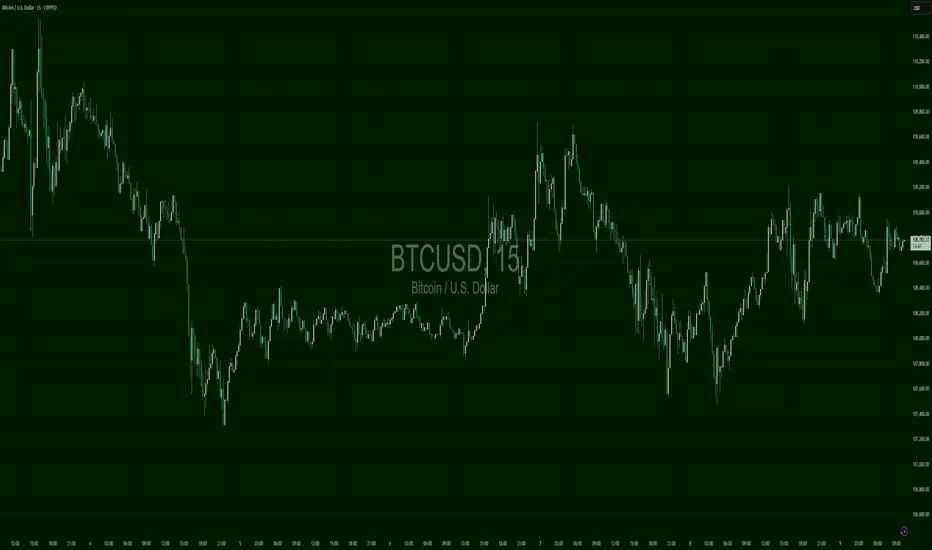
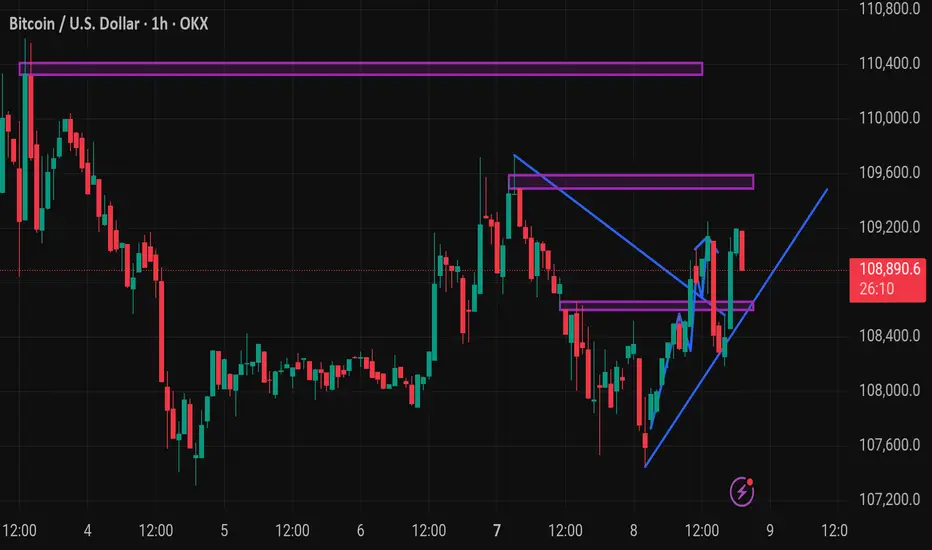
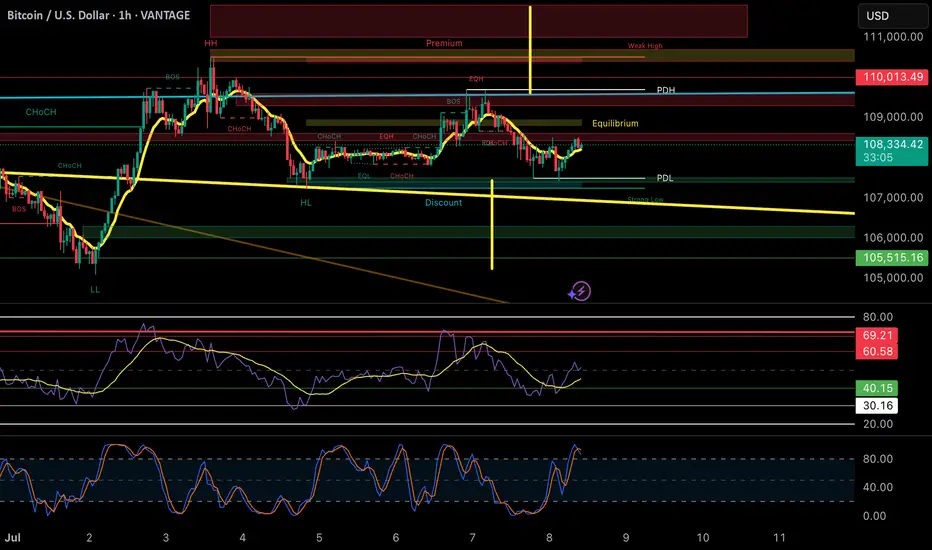
BTCUSD – Quiet Push After the StormBTC plunged from $110K into $105.5K, then ground sideways in a long accumulation zone. Recent breakout took price toward $109.2K, but it stalled and faded slightly. Still holding structure. Bulls want a clean break over $109.5K to challenge $110K again.
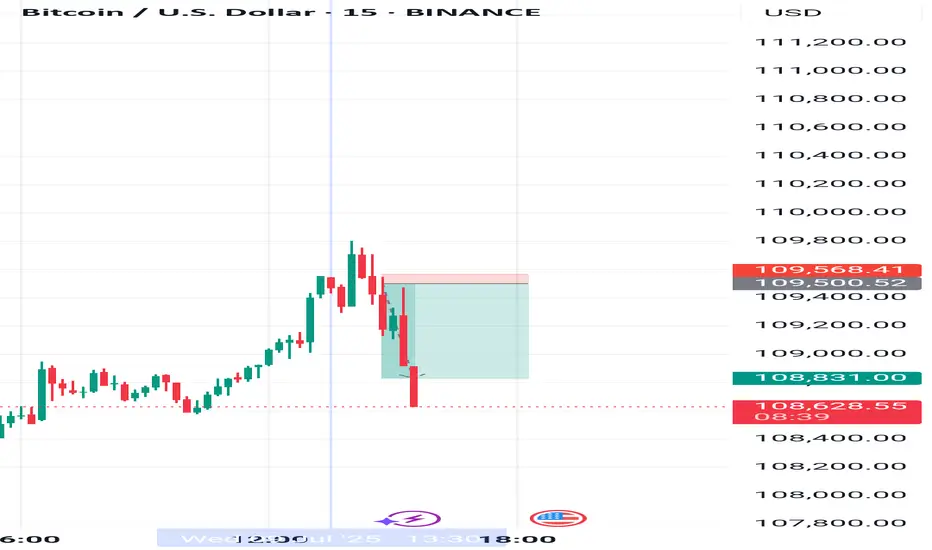
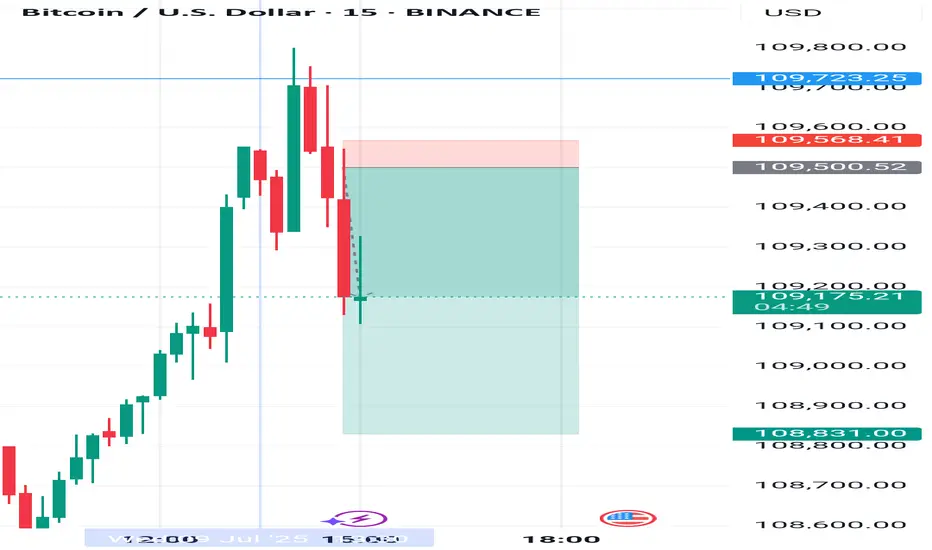
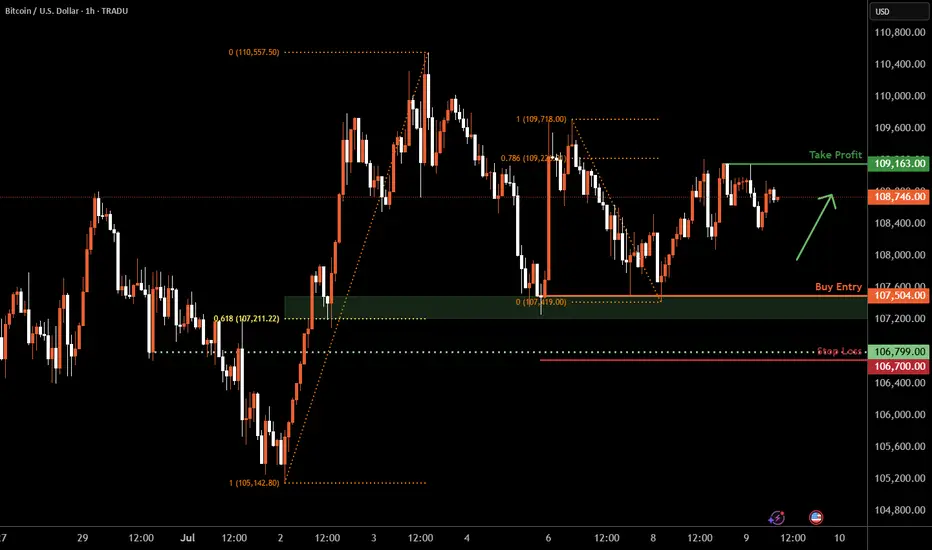
Bitcoin H1 | Potential bounce off a multi-swing-low supportBitcoin (BTC/USD) is falling towards a multi-swing-low support and could potentially bounce off this level to climb higher.
Buy entry is at 107,504.00 which is a multi-swing-low support that aligns closely with the 61.8% Fibonacci retracement.
Stop loss is at 106,700.00 which is a level that lies underneath an overlap support.
Take profit is at 109,163.00 which is a swing-high resistance that aligns with the 78.6% Fibonacci retracement.
High Risk Investment Warning
Trading Forex/CFDs on margin carries a high level of risk and may not be suitable for all investors. Leverage can work against you.
Stratos Markets Limited (tradu.com ):
CFDs are complex instruments and come with a high risk of losing money rapidly due to leverage. 63% of retail investor accounts lose money when trading CFDs with this provider. You should consider whether you understand how CFDs work and whether you can afford to take the high risk of losing your money.
Stratos Europe Ltd (tradu.com ):
CFDs are complex instruments and come with a high risk of losing money rapidly due to leverage. 63% of retail investor accounts lose money when trading CFDs with this provider. You should consider whether you understand how CFDs work and whether you can afford to take the high risk of losing your money.
Stratos Global LLC (tradu.com ):
Losses can exceed deposits.
Please be advised that the information presented on TradingView is provided to Tradu (‘Company’, ‘we’) by a third-party provider (‘TFA Global Pte Ltd’). Please be reminded that you are solely responsible for the trading decisions on your account. There is a very high degree of risk involved in trading. Any information and/or content is intended entirely for research, educational and informational purposes only and does not constitute investment or consultation advice or investment strategy. The information is not tailored to the investment needs of any specific person and therefore does not involve a consideration of any of the investment objectives, financial situation or needs of any viewer that may receive it. Kindly also note that past performance is not a reliable indicator of future results. Actual results may differ materially from those anticipated in forward-looking or past performance statements. We assume no liability as to the accuracy or completeness of any of the information and/or content provided herein and the Company cannot be held responsible for any omission, mistake nor for any loss or damage including without limitation to any loss of profit which may arise from reliance on any information supplied by TFA Global Pte Ltd.
The speaker(s) is neither an employee, agent nor representative of Tradu and is therefore acting independently. The opinions given are their own, constitute general market commentary, and do not constitute the opinion or advice of Tradu or any form of personal or investment advice. Tradu neither endorses nor guarantees offerings of third-party speakers, nor is Tradu responsible for the content, veracity or opinions of third-party speakers, presenters or participants.
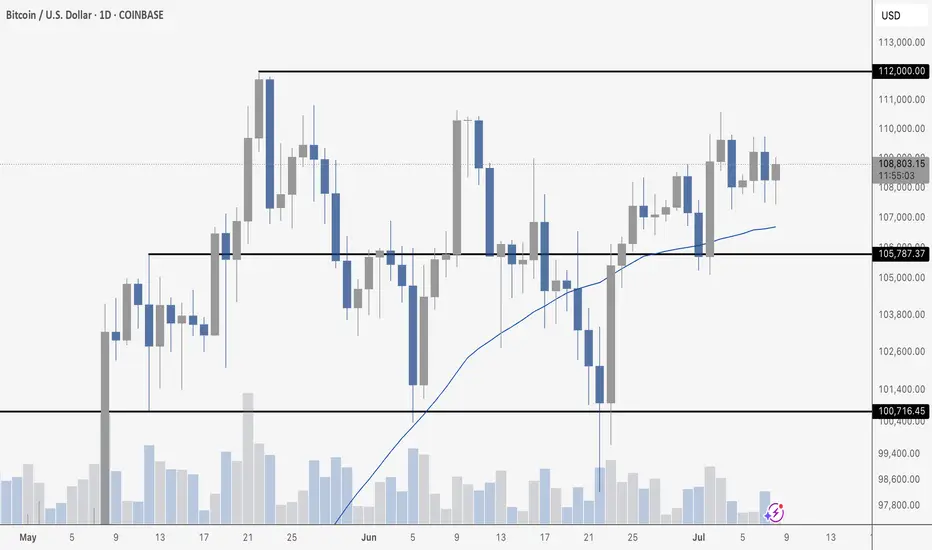
Bitcoin ConsolidatingBitcoin continues to hold strong just below resistance at $112K after a clean reclaim of the $105,787 support zone and the 50-day moving average. Price is consolidating in a tight range, printing higher lows and showing signs of strength as it flirts with a potential breakout.
Volume has tapered off slightly during this sideways action, which is typical in a coiling pattern before a move. If bulls can finally push through $112K with conviction, we’re likely headed for a fresh leg higher. On the flip side, a drop back below the 50 MA and $105K would invalidate the short-term bullish structure.
Until then, it’s just a waiting game inside this range – but the bias leans bullish.
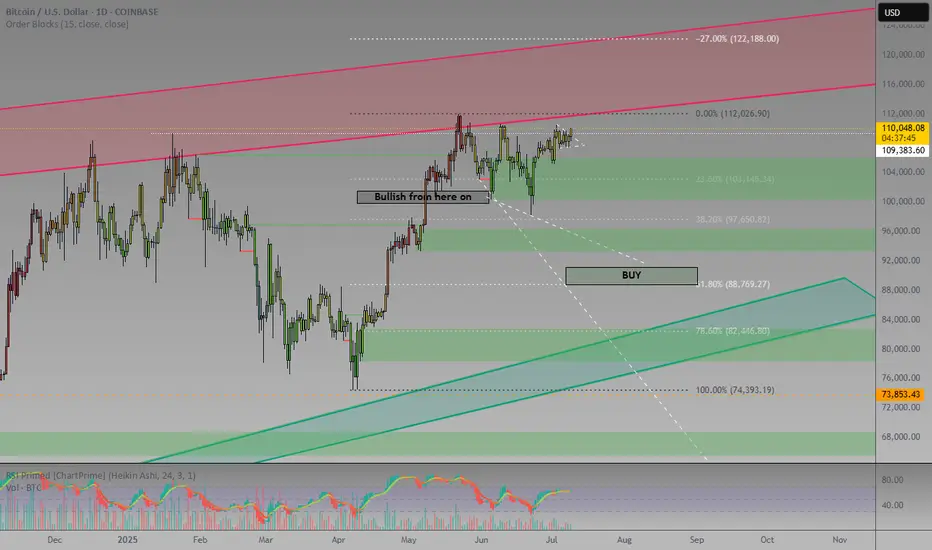
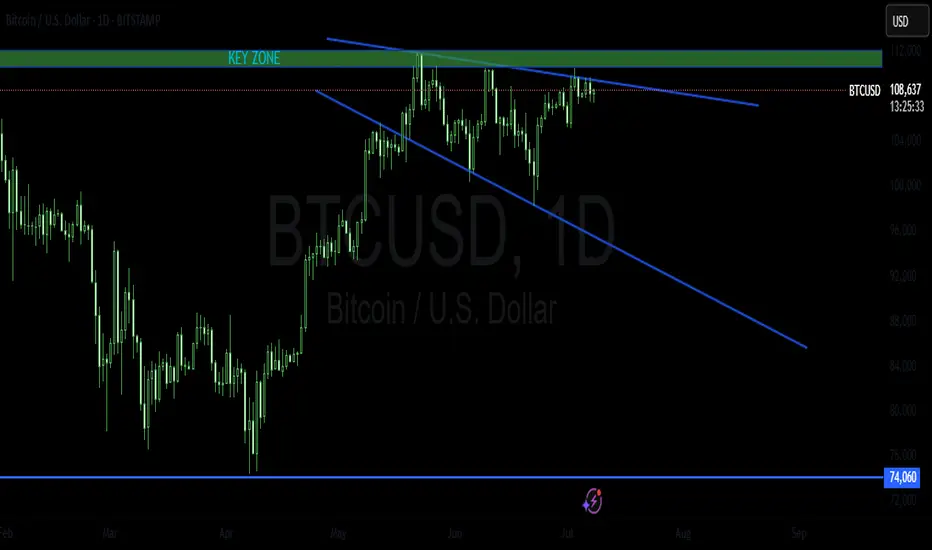
BTCUSD LONG TRADE PLANFollowing a classic technical view. The instrument has been trading in a global bull trend. Recently, it formed a descending expanding wedge pattern next to a key zone which I view as an accumulation.
When to buy ? In my view, I will only buy if breakout of this pattern and break above the key zone.
Please do your own analysis before placing any trades.
Cheers and Happy Trading !!!!
BTC 106/105 before athI seeing a down move towards 106k and 105.5k before we make a new ath (fakeout to 115k) before we start breaking down into bear season
Btcudt techinical analysis.Btcusd techinical analysis next move posibale at h1 time frame.not finchinal advice.