Market ViewWatch
Trade
Manage
Smile
Good morning, service to all of God creature take another level in life of purpose., we all got our role. Make the decision today.
BTCUSD.PM trade ideas

Market ViewWatch
Trade
Manage
Smile
@Odesina Folorunsho Alabi
The scale of interpretation and trade execution is at each individual hands, we got to make the call either right or wrong, take charge.

BTCUSD What Next? BUY!
My dear subscribers,
My technical analysis for BTCUSD is below:
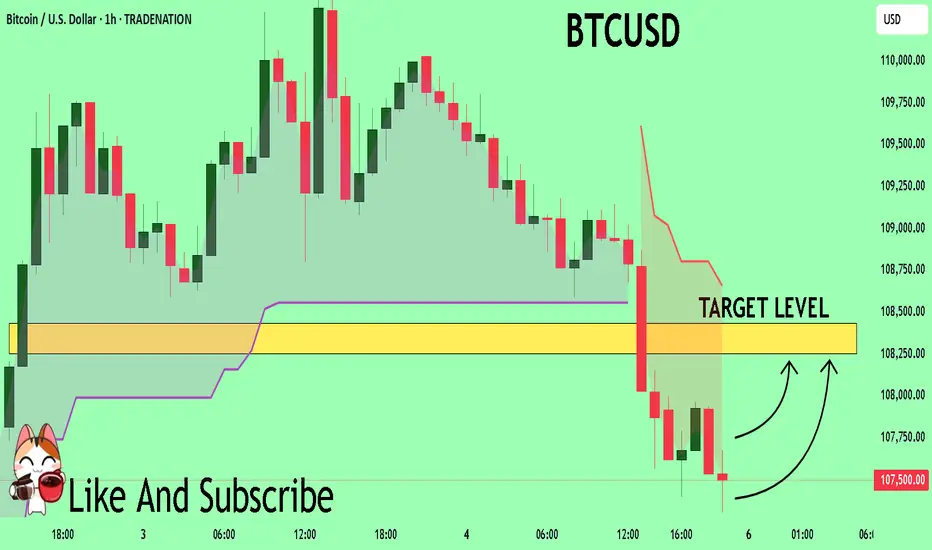
The price is coiling around a solid key level - 10750
Bias - Bullish
Technical Indicators: Pivot Points Low anticipates a potential price reversal.
Super trend shows a clear buy, giving a perfect indicators' convergence.
Goal - 10825
About Used Indicators:
By the very nature of the supertrend indicator, it offers firm support and resistance levels for traders to enter and exit trades. Additionally, it also provides signals for setting stop losses
Disclosure: I am part of Trade Nation's Influencer program and receive a monthly fee for using their TradingView charts in my analysis.
———————————
WISH YOU ALL LUCK
Btcusd techinical analysis.Btcusd techinical analysis next move posibale at h1 time frame.not finchinal advice.
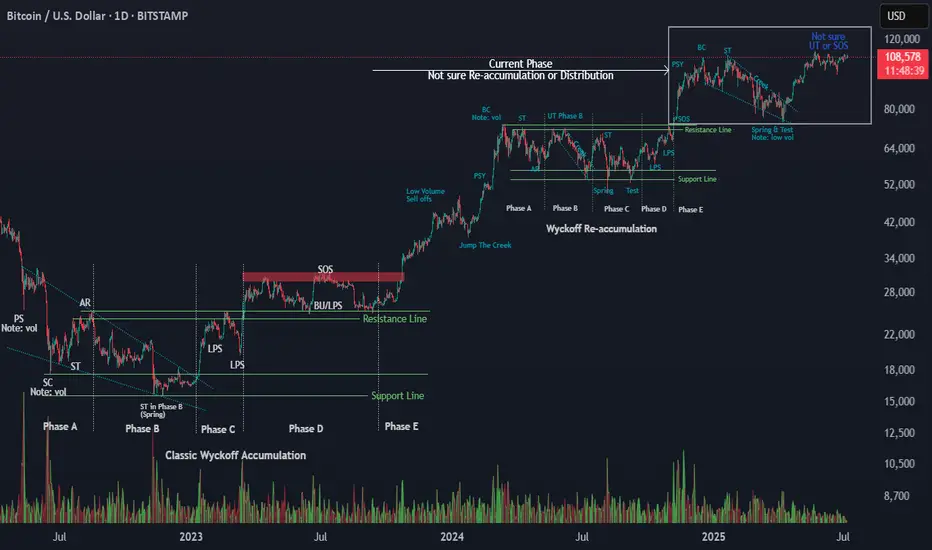
Wyckoff Logic – Test PhaseI won’t say much — the chart speaks for itself.
Based on my ongoing study of Wyckoff methodology, it appears that Bitcoin is currently in the Test phase within a re-accumulation structure. This suggests the Mark-Up phase is not yet complete, and we may still have room for price expansion before the next major distribution.
This is not a prediction, but a reference for structural context using classical Wyckoff logic.
As always, price confirmation and volume behavior will be the key to validate the next move.
Observations:
Strong support zone holding after Spring/Test
Price respecting higher lows
Volume profile supports continuation
Feel free to share your perspective below 👇
#Wyckoff #Bitcoin #BTC #Reaccumulation #MarketStructure #PriceAction #TradingView #CryptoTA
BTC CHOPSBitcoin is quietly grinding higher, holding above the key $105,787 level after reclaiming it with authority. Price is consolidating just under $112,000 resistance, pressing against the top of the range while riding the 50-day moving average like a support rail.
The dip to $100,716 was a trap. Buyers stepped in hard, and price hasn’t looked back. But without a decisive close above $112K, this remains a waiting game. A breakout sends us flying. A rejection brings $105K and $100K back into view. No need to guess - just let the levels speak.
Possibility of correction The uptrend is expected to continue to the specified resistance levels. Then, a trend change and the start of a downtrend are likely. If the price consolidates above the resistance level, the uptrend may continue.
July 4 Bitcoin Bybit chart analysisHello
This is Bitcoin Guide.
If you "follow"
You can receive real-time movement paths and comment notifications on major sections.
If my analysis was helpful,
Please click the booster button at the bottom.
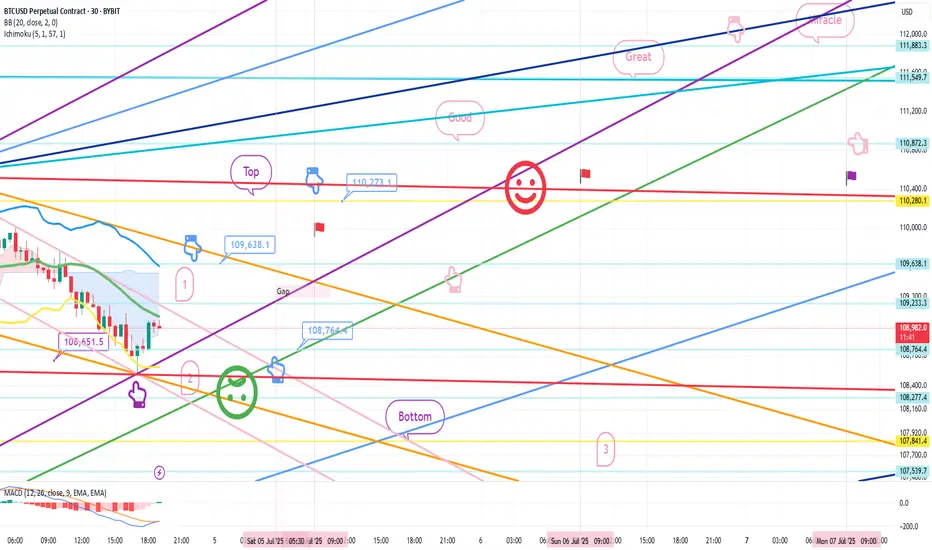
Here is the Bitcoin 30-minute chart.
There is no Nasdaq index announcement today.
There is a possibility that Nasdaq will fall sharply,
but even if it moves sideways, the probability of the strategy succeeding increases.
On the left, with the purple finger,
I connected the 2nd section of the long position that I entered yesterday.
*When the blue finger moves,
Bidirectional neutral
Short->Long or long waiting strategy
1. 109,638.1 dollars short position entry section / cut-off price when orange resistance line is broken
2. 108,764.4 dollars long position switching / cut-off price when green support line is broken
3. 110,273.1 dollars long position 1st target -> target price in order from Miracle
If the strategy is successful, I left a simulation with the pink finger,
so please refer to it.
Those who held long positions yesterday, please check if the purple support line is broken,
If it falls immediately from the current position or
If the pink resistance line is not broken when the 1st section at the top is touched,
It is a vertical decline section,
And if the 109,638.1 dollar short position entry section at the top is not touched,
It is a long waiting strategy at the 2nd section at the bottom.
I think it would be good to think of it as a game in the 1+4 section.
From the 2nd section breakout, I have marked the Bottom -> 3rd section at the bottom.
Up to this point, please just refer to and use my analysis,
I hope you operate safely with principle trading and stop loss prices.
Thank you for your hard work this week.
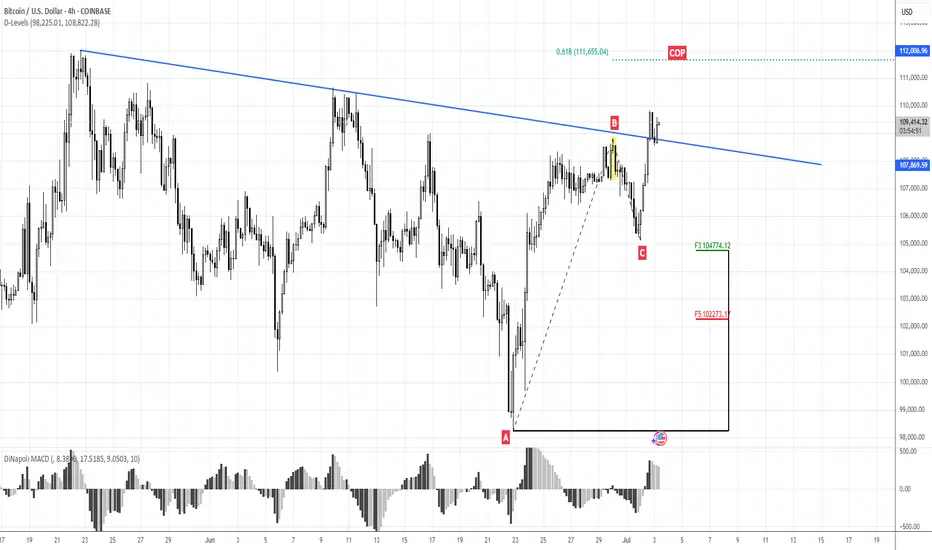
111.65 against 105KMorning folks,
So we've got great entry with our H&S but it is early to relax. To avoid long explanations - BTC has to stay above 105K lows to keep current tendency valid. So, if you still plan to buy BTC here - you do not need to watch for too deep standing Fib levels.
If BTC will still drop below 105K, we could get extended downside action to 100K and maybe even deeper.
Nearest upside target with our current plan is 111.65K.
BTC is looking Bullish This is not a financial advice... btc is bullish but I think this might be a BULLtrap.
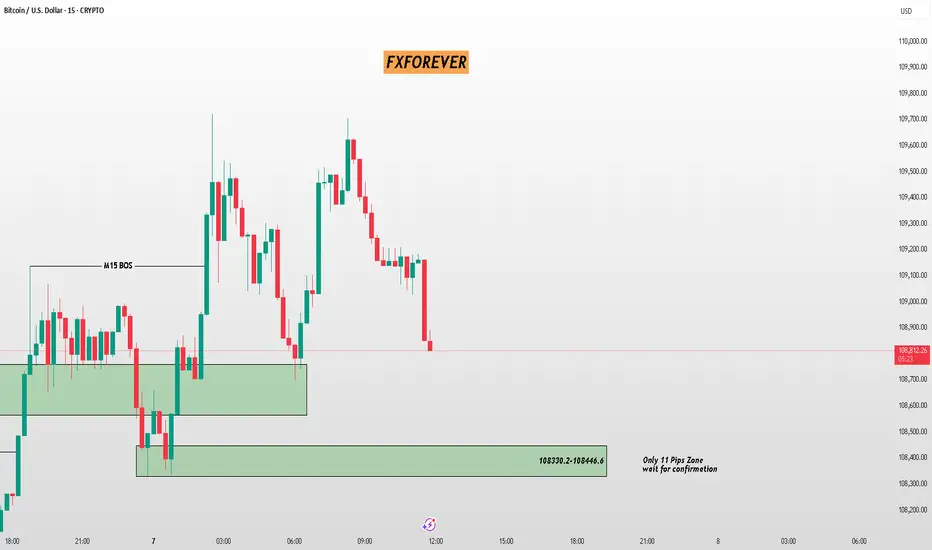
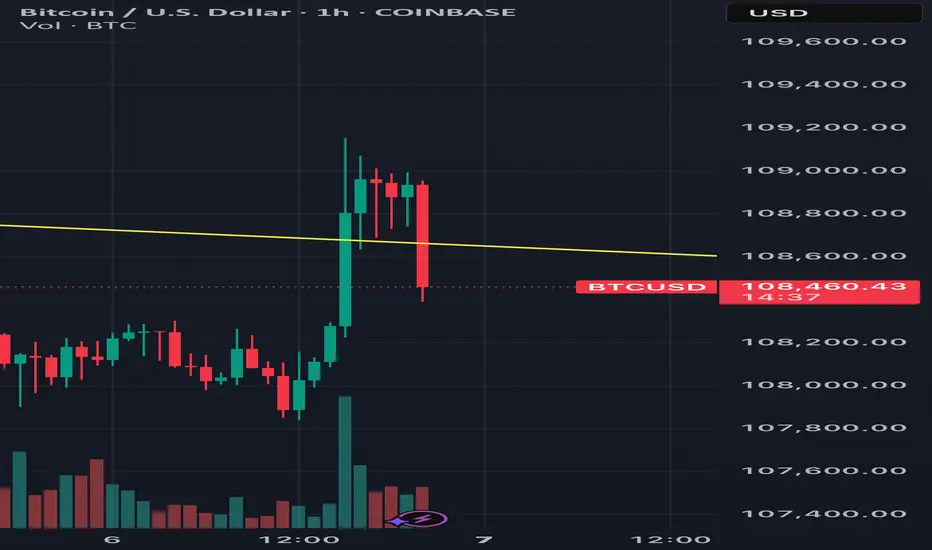
BTC/USD – Sharp Drop Into Micro Demand Zone (7 July 2025)📉 BTC/USD – Sharp Drop Into Micro Demand Zone (7 July 2025)
Price broke structure on M15 and is now falling into a tight 11-pip demand zone (108330.2–108446.6).
📊 Key Details:
🔸 M15 BOS already formed
🔸 Zone Size: Only 11 pips – requires extra caution
🔸 Setup: Wait for confirmation before reacting
📍 Aggressive buyers might watch for LTF CHoCH or engulfing from the zone. Safer entries lie in confirmation-based setups.
🎯 FXFOREVER – Precision levels. Calculated decisions.
#BTCUSD #FXFOREVER #SmartMoneyTrading #DemandZone #BreakOfStructure #M15Chart #CryptoSetup #BitcoinStrategy #PriceActionForex
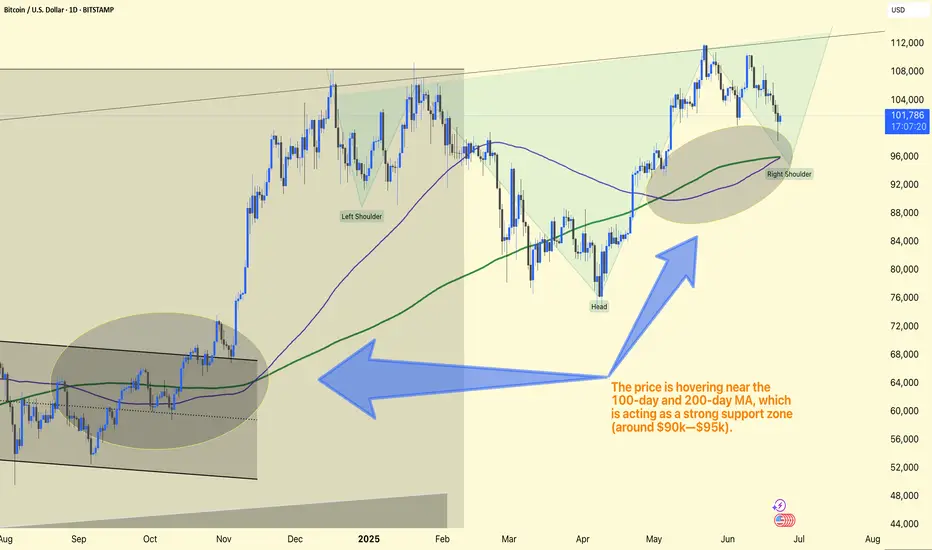
BTC/USD Analysis Update. Chart Pattern:
The chart clearly shows an Inverse Head & Shoulders structure:
Left Shoulder
Head
Right Shoulder
This is a strong bullish reversal pattern.
Moving Averages:
Price hovers near the 100-day and 200-day MA, acting as a strong support zone (around $90k–$95k).
This area is critical for sustaining long positions.
Expected Move:
Strong bullish potential towards the $113k–$115k zone, aligned with the upper trendline target.
RSI also suggests room for a bullish recovery from this zone.
Trade Plan:
Ideal Entry: Near $90k–$95k (Right Shoulder area)
Stop Loss: Just below $88k
Target: $113k–$115k
This structure is very favorable for long positions if the price confirms strength within the right shoulder zone.
BTCUSD 7/6/2025Come Tap into the mind of SnipeGoat, as he gives you a Weekly Market Breakdown of Bitcoins current Price Action to determine Price's next move.
_SnipeGoat_
_TheeCandleReadingGURU_
#PriceAction #MarketStructure #TechnicalAnalysis #Bearish #Bullish #Bitcoin #Crypto #BTCUSD #Forex #NakedChartReader #ZEROindicators #PreciseLevels #ProperTiming #PerfectDirection #ScalpingTrader #IntradayTrader #DayTrader #SwingTrader #PositionalTrader #HighLevelTrader #MambaMentality #GodMode #UltraInstinct #TheeBibleStrategy

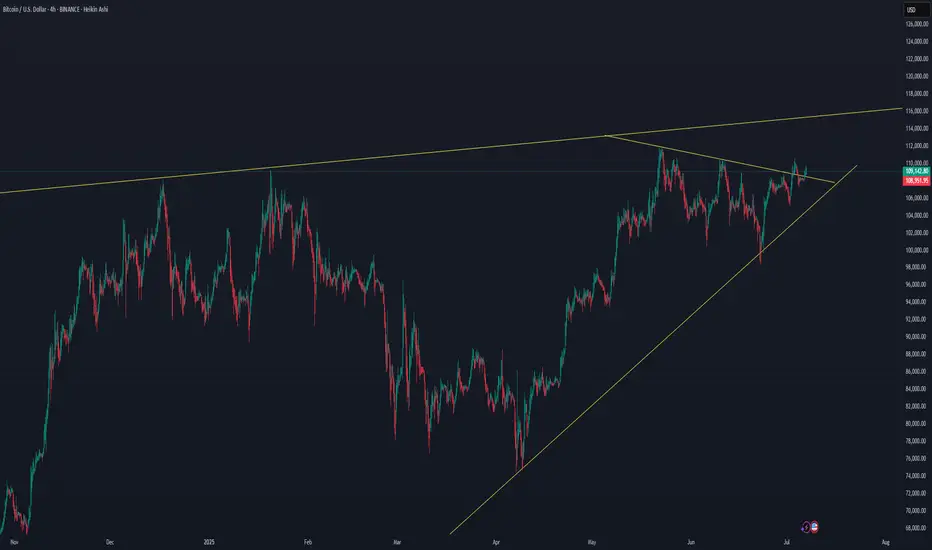
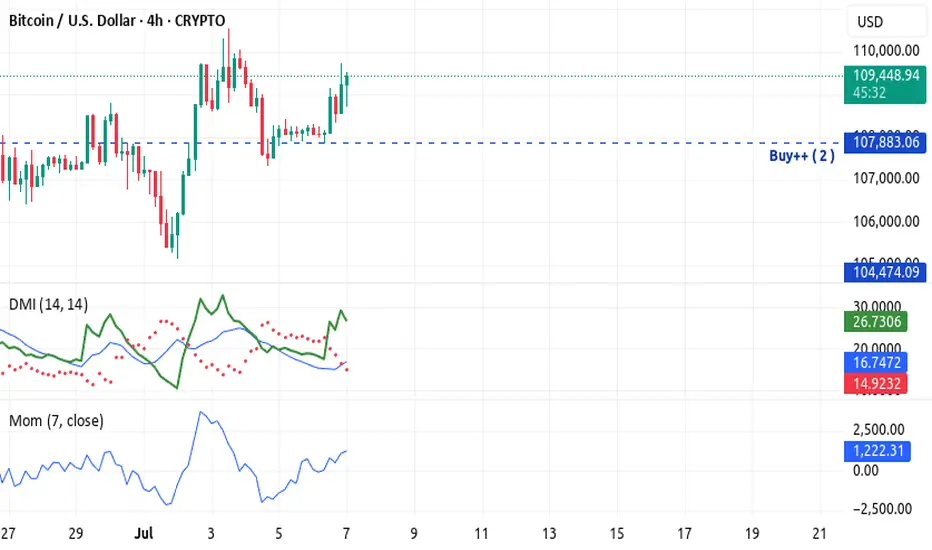
Bitcoin 4H Rocket Booster Strategy – Bullish Setup with EMA Bitcoin 4H Rocket Boost Strategy – Bullish Setup with EMA Alignment, Gap Action, ADX Strength, and Stoch RSI Signal
Bitcoin (BTC/USD) is currently displaying a textbook bullish setup on the 4-hour chart, closely matching the Rocket Boost Strategy
criteria. Traders using a trend-following system with momentum confirmation will find this setup particularly appealing.
1. Price Above the 50 EMA
Bitcoin is trading firmly above the 50 EMA, a key sign that short-term momentum is tilted in favor of the bulls. The 50 EMA often
acts as dynamic support during strong uptrends, and current price action respecting this level shows the market is in a healthy
bullish phase.
2. Price Above the 200 EMA
The long-term trend is also confirmed as bullish, with price positioned well above the 200 EMA. This alignment of the 50 and
200 EMAs forms what many traders call a “bullish stack,” which strengthens confidence in long opportunities.
3. Gap Action / Aggressive Breakout Behavior
While cryptocurrencies don't technically gap in the same way as stocks or forex (due to 24/7 trading), Bitcoin has shown strong
impulsive breakout candles with little to no wick retracement—often referred to as "synthetic gaps" or aggressive breakouts.
This behavior typically reflects institutional buying or whale-driven momentum entering the market suddenly.
4. ADX Indicator Confirms Trend Strength
The ADX (Average Directional Index) is rising above the 20–25 level, which indicates that the current trend is gaining strength. A
rising ADX while price moves higher means that the upward momentum is not just temporary noise—it’s a signal that buyers
are firmly in control.
5. Stochastic RSI Gives Reversal Buy Signal
The Stochastic RSI recently dipped into oversold territory and has now crossed back upward. This reversal buy signal, especially
when aligned with a trending environment, often marks the end of a short-term pullback and the beginning of a new impulse leg upward.
What This Means for Bitcoin Traders
When all these components align—price above both EMAs, strong ADX trend, breakout behavior, and a fresh Stoch RSI buy
signal—it often results in what traders using the Rocket Boost Strategy refer to as a “momentum ignition point.” It’s not just a
signal to enter, but a signal that the market may accelerate in the current direction.
This could lead Bitcoin to test new resistance zones or even break psychological levels if volume supports the move. Key zones to
watch would be previous highs and Fibonacci extensions drawn from the most recent swing.
Disclaimer: This article is for educational purposes only and does not constitute financial advice. Always perform your own due
diligence and use proper risk management when trading.
To learn more about this kind of setup, search for Rocket Boost Strategy content.
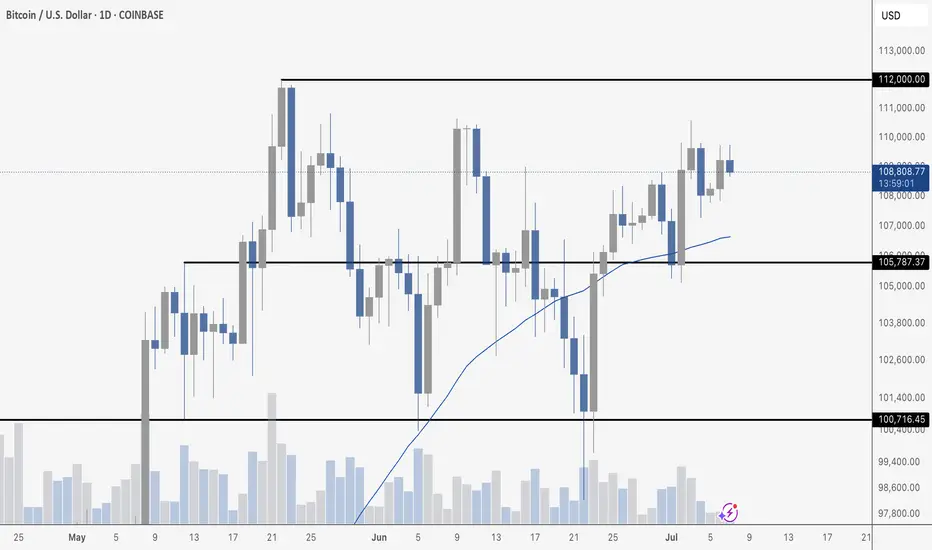
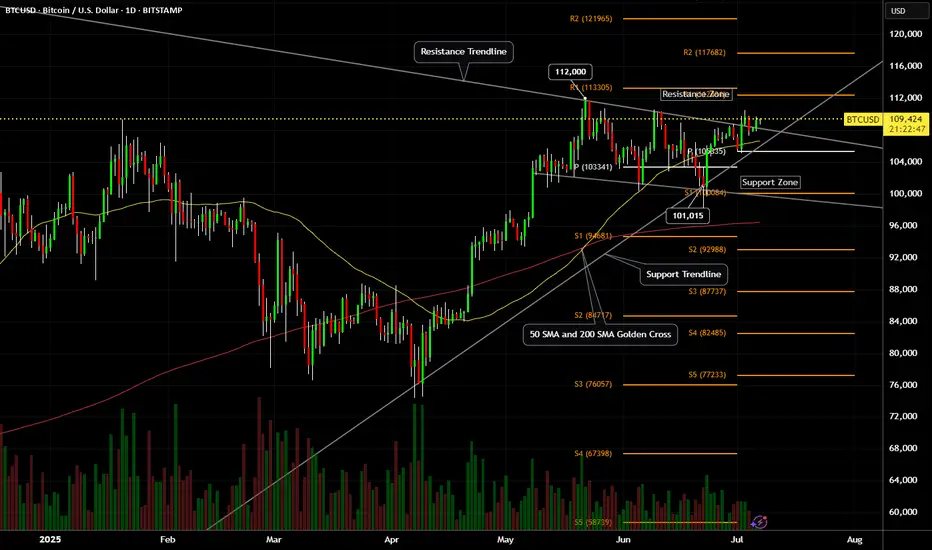
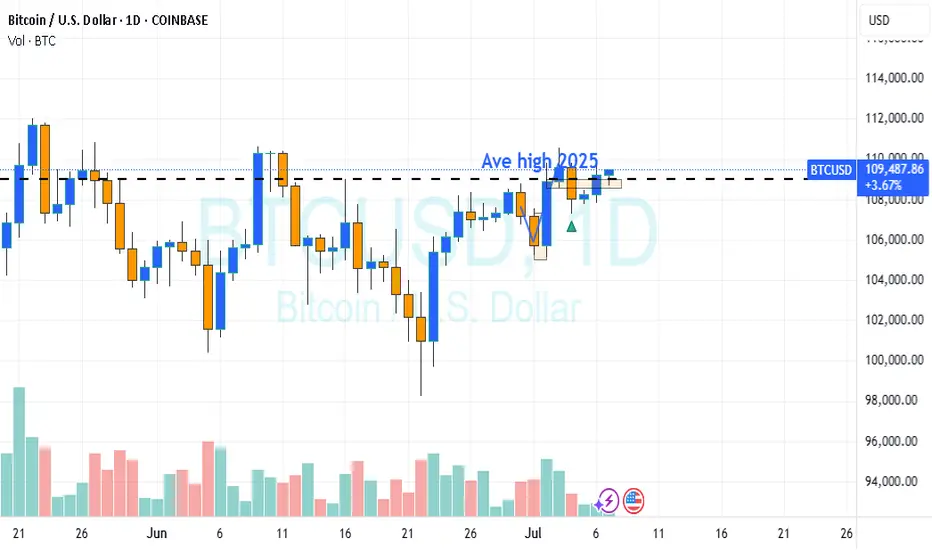
Bitcoin (BTCUSD) - Daily Price Uptrend, Resistance Breakout TestBitcoin (BTCUSD) has been in a recent Daily price Uptrend, rallying up from the $100,000 price support level.
A SMA Golden Cross printed on May 21st, 2025.
Bitcoin price is attempting a resistance zone test and has yet to breakout and hold above the $111,000 to $112,000 price zone.
Resistance levels: $110,000 , $112,000 , $117,000 , $121,000.
Support levels: $108,000 , $107,000 , $105,000 , $104,000 , $100,000.
Recent crypto industry, government legislation news, and institutional crypto purchases have helped to keep Bitcoin price above $100,000 support.
Stock market correlation volatility could also affect the crypto market and prices for the next 30 to 45 days.
BTC?
Hi
We have a predicament when we enter a trade
Buy or Sell
That's all
We need to have a belief
How do we have the bias?
Knowledge base
In your research : Is it valuable in 6months till 24mo & why?
If it is push button buy; if not going to be why would youu.??
So laymen.. and not so complex.
The issue is leverage, greed and get it quick and you need to have it now.
Again.
Not a guru
NB/ patience boss
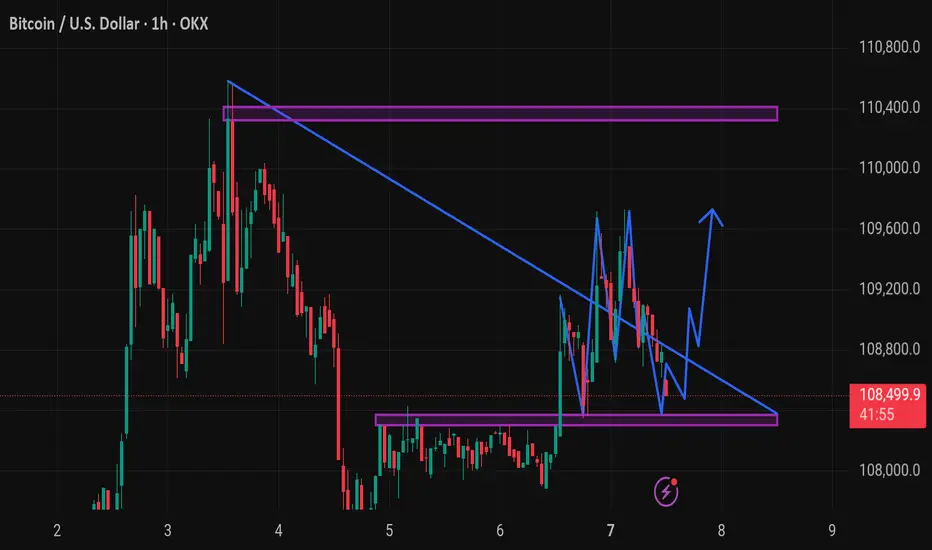
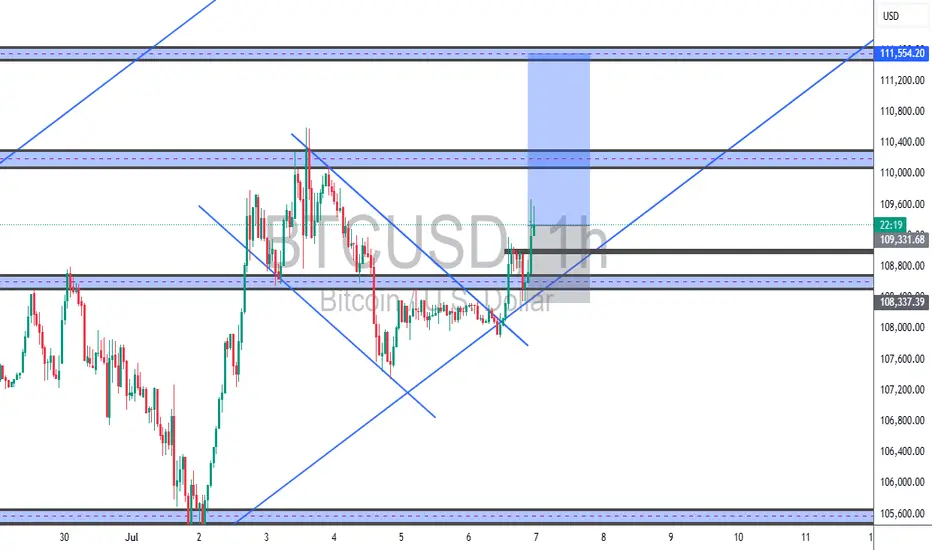
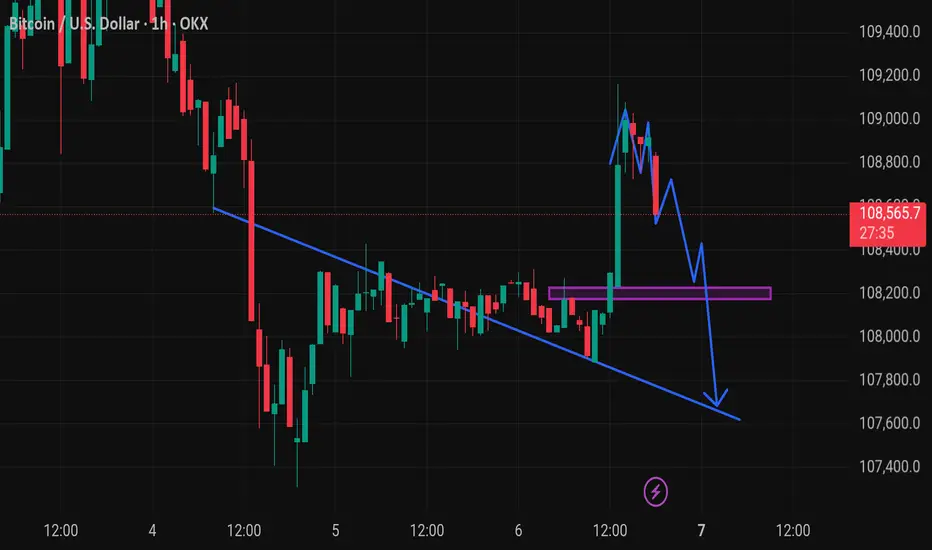
BTCUSD – Bullish Breakout (TCB Strategy A+ Setup)📈 BTCUSD – Bullish Breakout from Falling Wedge (TCB Strategy A+ Setup)
Timeframe: 1H
Strategy Phase: ✅ Countertrend Phase (bullish breakout)
🔍 Analysis:
BTCUSD formed a well-defined falling wedge (countertrend structure) during a bullish market environment. After a clean liquidity sweep of the wedge lows and several failed breakdowns, price broke out with strong bullish momentum.
A successful retest of the broken wedge + horizontal support zone (~108,926) provided a perfect entry opportunity, aligning with the TCB Countertrend Strategy rules.
📌 Entry: 108,926
📉 Stop Loss: ~108,200 (below wedge low)
📈 Take Profit: 111,554 (next major resistance zone)
💡 Risk-to-Reward: ~1:3+
🎯 Checklist Score: ✅ 100% (A+ Setup)
📋 TCB Confluences:
Countertrend Falling Wedge ✅
Breakout with Momentum ✅
Retest of Structure + Demand ✅
Liquidity Sweep Below Lows ✅
Clean Market Structure to TP ✅
🧠 Trade Management:
SL to BE at 1:1 RR (~110,100)
Optional partial TP around 110,400–110,800
Re-entry only on new continuation flag or structure retest
📚 Strategy: TCB Strategy (Trend – Countertrend – Breakout)
Focus: Identifying high-probability setups by combining structure, momentum, and confluence for precision
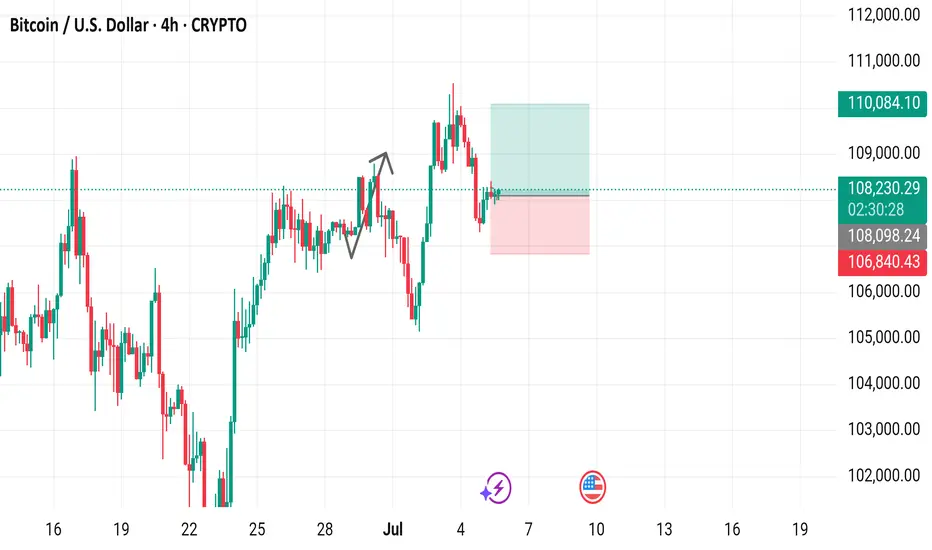
Bitcoin / U.S. Dollar 4-Hour Chart - CRYPTO4-hour candlestick chart displays the Bitcoin (BTC) to U.S. Dollar (USD) price movement, currently at $108,252.17 with a 0.21% increase (+$230.82). The chart highlights a recent upward trend with key price levels marked, including a buy price of $108,252.17 and a sell price at the same level. Support and resistance zones are indicated with a pink shaded area around $106,840.43 to $108,252.17 and a green shaded area near $110,084.10. The chart spans from late June to July 7, 2025, with the latest data point at 06:27 PM PKT on July 5, 2025.
Market ViewWatch
Trade
Manage
Smile
@Comtent is pure technical and candle interpretation. Watch and remember to be at peace with your trade decision, as the present is key ingredient to regret or rejoice.

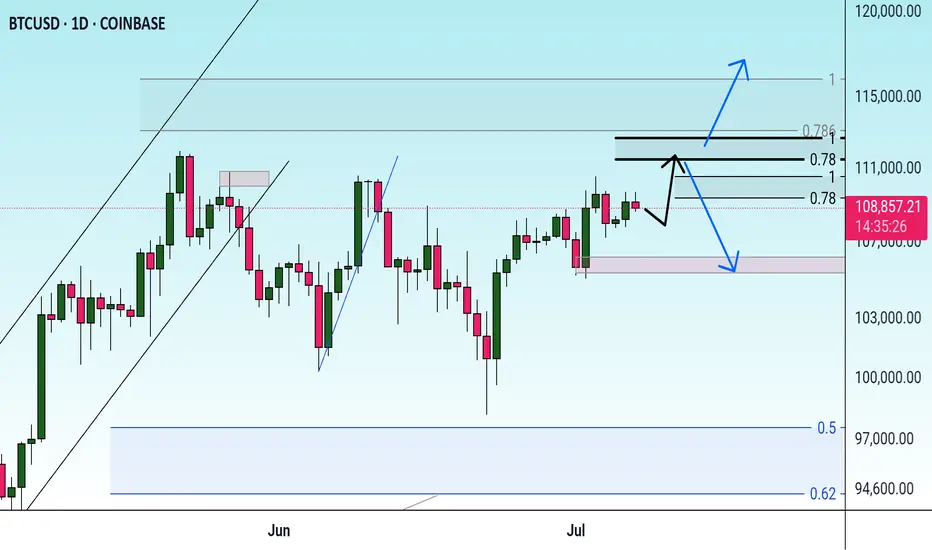
Weekend books are razor-thinUnless we now see follow-through into a daily close > $112 k, the move is noise, not signal. The key pivot levels and base-case roadmap (range drift toward 104 k or 101 k unless 112 k breaks) stay the same—just powered by weekend whipsaw rather than weekday flow.
Btcusd techinical analysis.Btcusd techinical analysis next move posibale at h1 time frame.not finichinal advce.
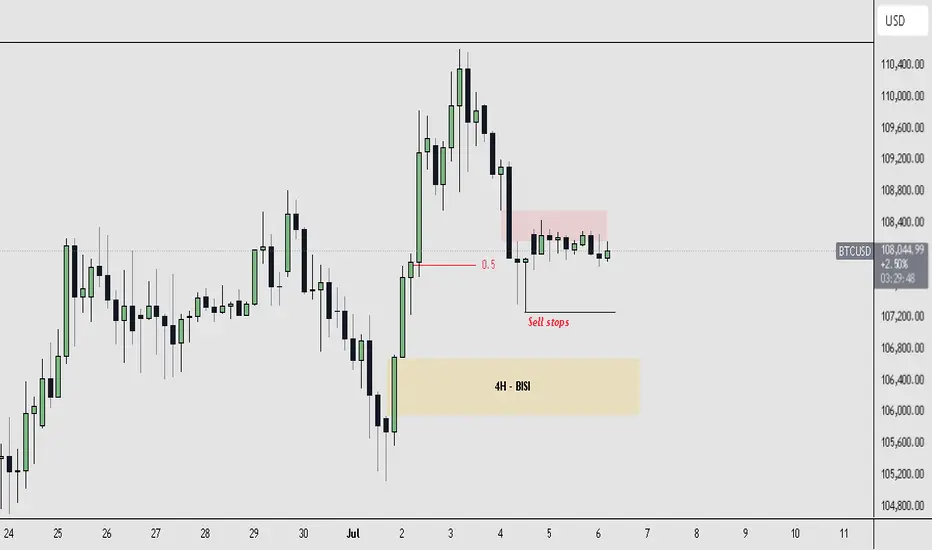
$BTCUSD Trade Idea Currently, BTCUSD is operating within a defined dealing range between $105,000 (low) and $110,600 (high). Price is consolidating near the equilibrium (0.5 level) of this range and forming a sideways structure just above visible sell-side liquidity.
We are seeing confluence with a 4H SIBI (Sell-side Imbalance, Buy-side Inefficiency) overhead, which is currently capping price and adding to short-term bearish pressure. At the same time, price is hovering above a clear liquidity pool marked by sell stops, creating a potential for a liquidity sweep scenario.
Below current price action lies a well-defined 4H BISI (Buy-side Imbalance, Sell-side Inefficiency) zone, which serves as a strong demand area and an ideal draw on liquidity before any potential bullish continuation.
BEARISH ELLIOTT WAVE PATTERN ON BITCOINIn this short video, I explain the complex Triple Three Elliott wave pattern identified on the hourly chart on Bitcoin.
Based on the identification of the second wave X at $110,600 my most probably expectation is the completion of wave Z which will take the corrective form of an A-B-C pattern to an intended target below $98,225.
The alternative scenario is that the corrective wave ended at wave Y and the depicted Y-X wave is an impulse wave 1 and were likely on wave 2 to continue to a wave 3 which will break into a new all time high above $125,000.
Currently, I am personally in favor of the completion of wave Z as wave Y-X could not break above the MAJOR Resistance at $112,000.
